Data Mining Project: Techniques, Applications, and Analysis Overview
VerifiedAdded on 2019/09/22
|17
|5286
|289
Project
AI Summary
This project provides an in-depth exploration of data mining, detailing its importance in today's data-driven world. It covers the core concepts, including data warehousing and knowledge discovery in data (KDD), emphasizing the need for data mining in various domains like business, research, and science. The project delves into the practical application of data mining, focusing on techniques such as descriptive, predictive, and prescriptive analytics, and their respective uses. The project also mentions the Million Song Dataset, and discusses the challenges of analyzing large datasets, along with the importance of data collection and the techniques used to analyze data.
INTRODUCTION
//Introduction on Data mining
In today’s world, data mining is an important term, which relates the data with the analysis of
outcomes. Data mining refers to the analyzing enormous amount of data, in order to retrieve or extract
se meaning and useful information. In this analysis, data goes through different analysis models, and
patterns are decided after the observation of data, with using multiples software’s. Demand of data
mining is all domains but majorly its demand is at its peak in business, research and science domain.
In business domain, information regarding to customer is collected, and according to their likes and
dislikes policies are adjusted. Data mining helps the business associates to know their customers even
better. Business resources are also extracted in optimum manner through this technique. All these steps
are the keys to development of business or company.
In research domain, information is gathered, and possibility of future outcomes is made on trials. This
can be done by assuming some prediction models such as linear regression model. This research helps in
surveying the different objectives. They help in knowing the society better in which we live in.
In Science domain, experiments are made concluding the database and outcomes are measured. The
correlation between data predicts the bond for the entity with the other entity.
Data mining includes, data ware housing and data ware collection. The data mining makes use of
sophisticated mathematical algorithm and techniques and is also known as KDD (Knowledge discovery in
data).
//why Data mining
Data mining is needed because with the help data analysis techniques in data mining, a clear view of
hidden features is extracted. Without data mining, different patterns which the data is following cannot
be determined. Because of the nature of exploring characteristics and going deep into the data, the KDD
as a name is given. To check if the concept of data mining is real or theoretical, cases where data mining
is practically applied can be studied. Some of these cases are CRM, e-commerce, latest trends in stocks,
real state, and telecommunication. CRM refers to the management of the business relationship with its
customer. Past feedback data is used to get an insight of customer’s view, and their demands which can
enhance the business image in such a way that will make customer satisfy and make business achieve its
goals.
Without data mining, no one could be able to predict the possibilities of future outcomes, and manages
the risks beforehand. Data mining, also allows to get the details of mistakes done so that same mistakes
would be avoided in the future. Marketing strategy uses data analysis as an essential part of itself. AS
after data mining only it is decided how to do the marketing, where to perform surveys, and how to
influence the people.
Paraphrase This Document
Need a fresh take? Get an instant paraphrase of this document with our AI Paraphraser
//how to apply data mining
After discussing the need of data mining, it comes to a point, of how it will be run or executed. How to
make data effective and easy to use. Fir this to answer, it comes a new question, what is the key point to
analyses in data mining. Data mining included the mathematical algorithm, running on data to get
analysis form that. The process of data mining involves firstly selection of the database on which the
technique is to be performed. This data set can be customer feedback data, market research data,
geographical information data, competition analysis data, etc. Business intelligence along with data
mining techniques helps in decision making.
//Collecting the data
It is a very crucial process which requires a lot of time. This time is consumed in the process of collecting
data , due to its complexity. Sometimes outsourcing companies are needed for the extracted data.
Outsourcing companies are specialized in extracting data from different sectors such as marketing,
health industry, customer to relationship management, audio, video, and financial sectors. The collected
ata can be I the form of applying analytical functioning on it, it is not in the form, than it can be younger.
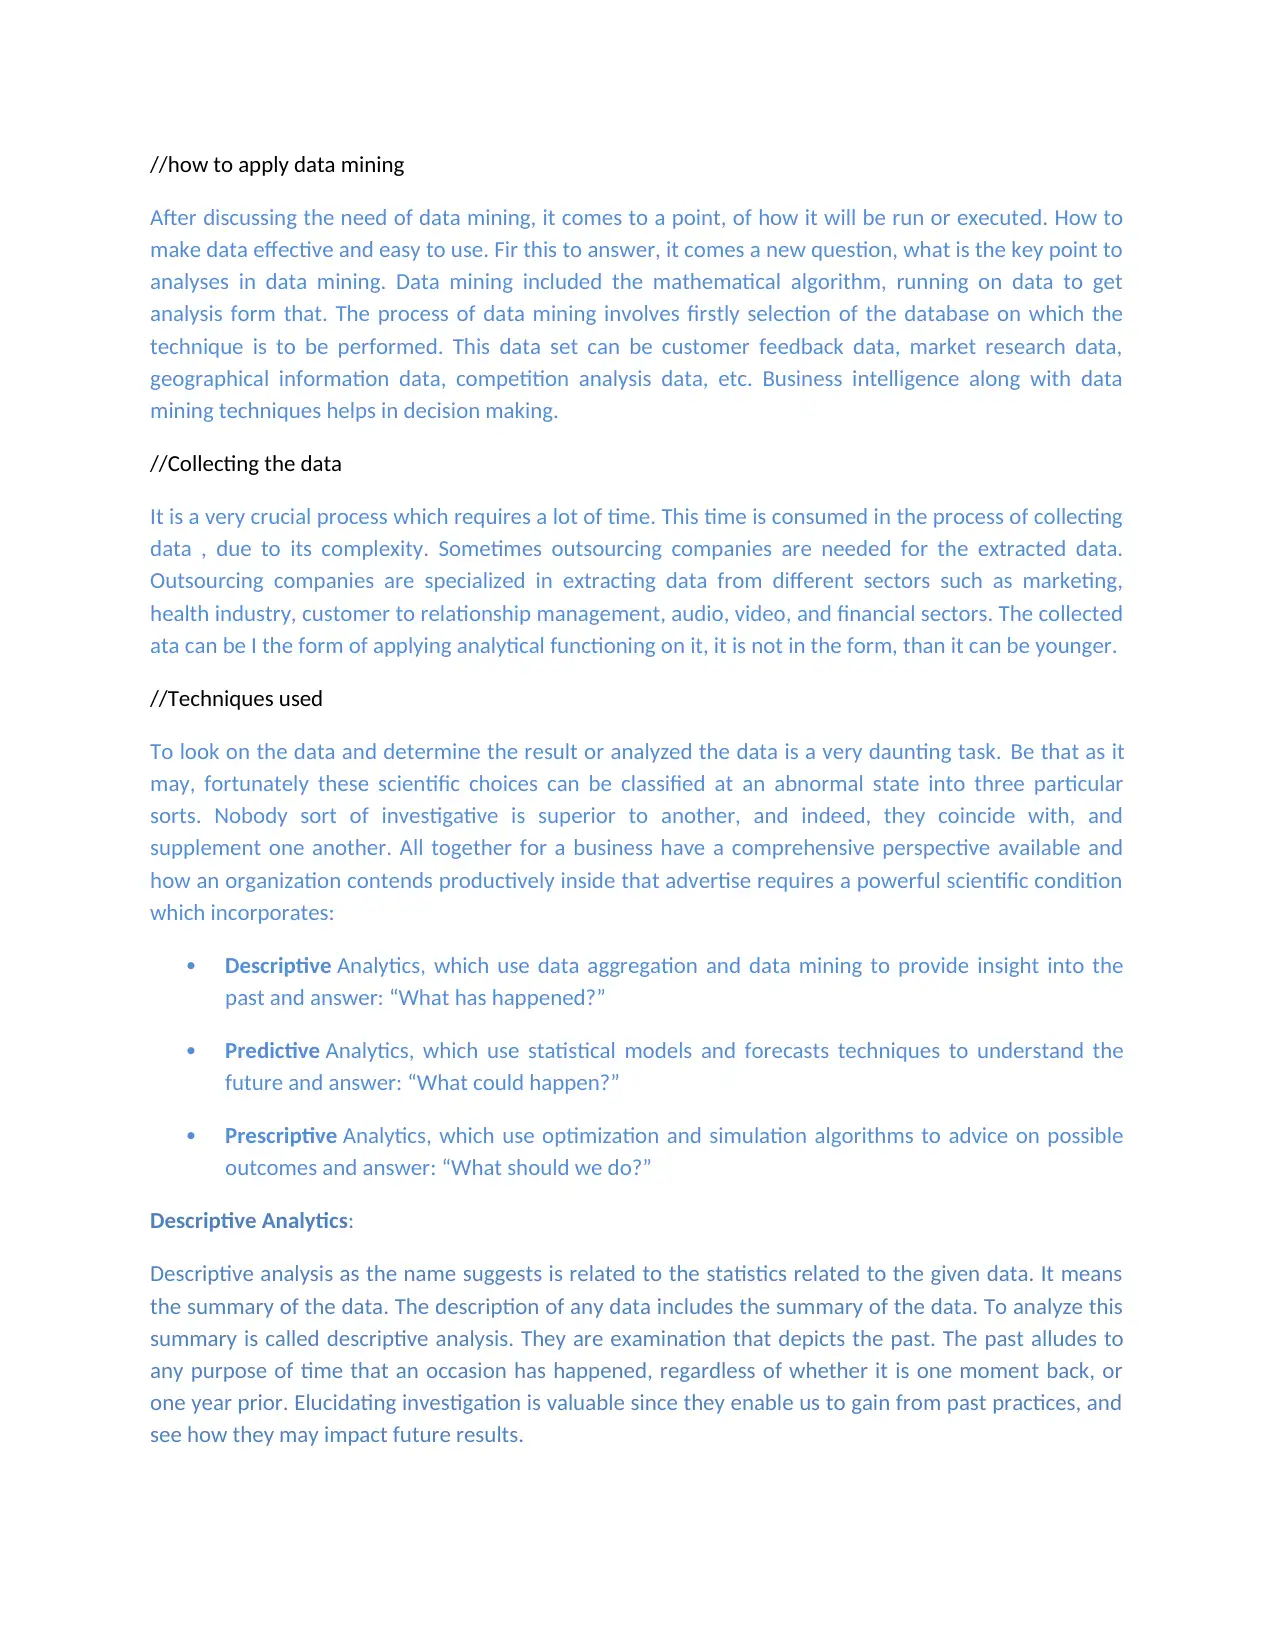
//Techniques used
To look on the data and determine the result or analyzed the data is a very daunting task. Be that as it
may, fortunately these scientific choices can be classified at an abnormal state into three particular
sorts. Nobody sort of investigative is superior to another, and indeed, they coincide with, and
supplement one another. All together for a business have a comprehensive perspective available and
how an organization contends productively inside that advertise requires a powerful scientific condition
which incorporates:
Descriptive Analytics, which use data aggregation and data mining to provide insight into the
past and answer: “What has happened?”
Predictive Analytics, which use statistical models and forecasts techniques to understand the
future and answer: “What could happen?”
Prescriptive Analytics, which use optimization and simulation algorithms to advice on possible
outcomes and answer: “What should we do?”
Descriptive Analytics:
Descriptive analysis as the name suggests is related to the statistics related to the given data. It means
the summary of the data. The description of any data includes the summary of the data. To analyze this
summary is called descriptive analysis. They are examination that depicts the past. The past alludes to
any purpose of time that an occasion has happened, regardless of whether it is one moment back, or
one year prior. Elucidating investigation is valuable since they enable us to gain from past practices, and
see how they may impact future results.
After discussing the need of data mining, it comes to a point, of how it will be run or executed. How to
make data effective and easy to use. Fir this to answer, it comes a new question, what is the key point to
analyses in data mining. Data mining included the mathematical algorithm, running on data to get
analysis form that. The process of data mining involves firstly selection of the database on which the
technique is to be performed. This data set can be customer feedback data, market research data,
geographical information data, competition analysis data, etc. Business intelligence along with data
mining techniques helps in decision making.
//Collecting the data
It is a very crucial process which requires a lot of time. This time is consumed in the process of collecting
data , due to its complexity. Sometimes outsourcing companies are needed for the extracted data.
Outsourcing companies are specialized in extracting data from different sectors such as marketing,
health industry, customer to relationship management, audio, video, and financial sectors. The collected
ata can be I the form of applying analytical functioning on it, it is not in the form, than it can be younger.
//Techniques used
To look on the data and determine the result or analyzed the data is a very daunting task. Be that as it
may, fortunately these scientific choices can be classified at an abnormal state into three particular
sorts. Nobody sort of investigative is superior to another, and indeed, they coincide with, and
supplement one another. All together for a business have a comprehensive perspective available and
how an organization contends productively inside that advertise requires a powerful scientific condition
which incorporates:
Descriptive Analytics, which use data aggregation and data mining to provide insight into the
past and answer: “What has happened?”
Predictive Analytics, which use statistical models and forecasts techniques to understand the
future and answer: “What could happen?”
Prescriptive Analytics, which use optimization and simulation algorithms to advice on possible
outcomes and answer: “What should we do?”
Descriptive Analytics:
Descriptive analysis as the name suggests is related to the statistics related to the given data. It means
the summary of the data. The description of any data includes the summary of the data. To analyze this
summary is called descriptive analysis. They are examination that depicts the past. The past alludes to
any purpose of time that an occasion has happened, regardless of whether it is one moment back, or
one year prior. Elucidating investigation is valuable since they enable us to gain from past practices, and
see how they may impact future results.
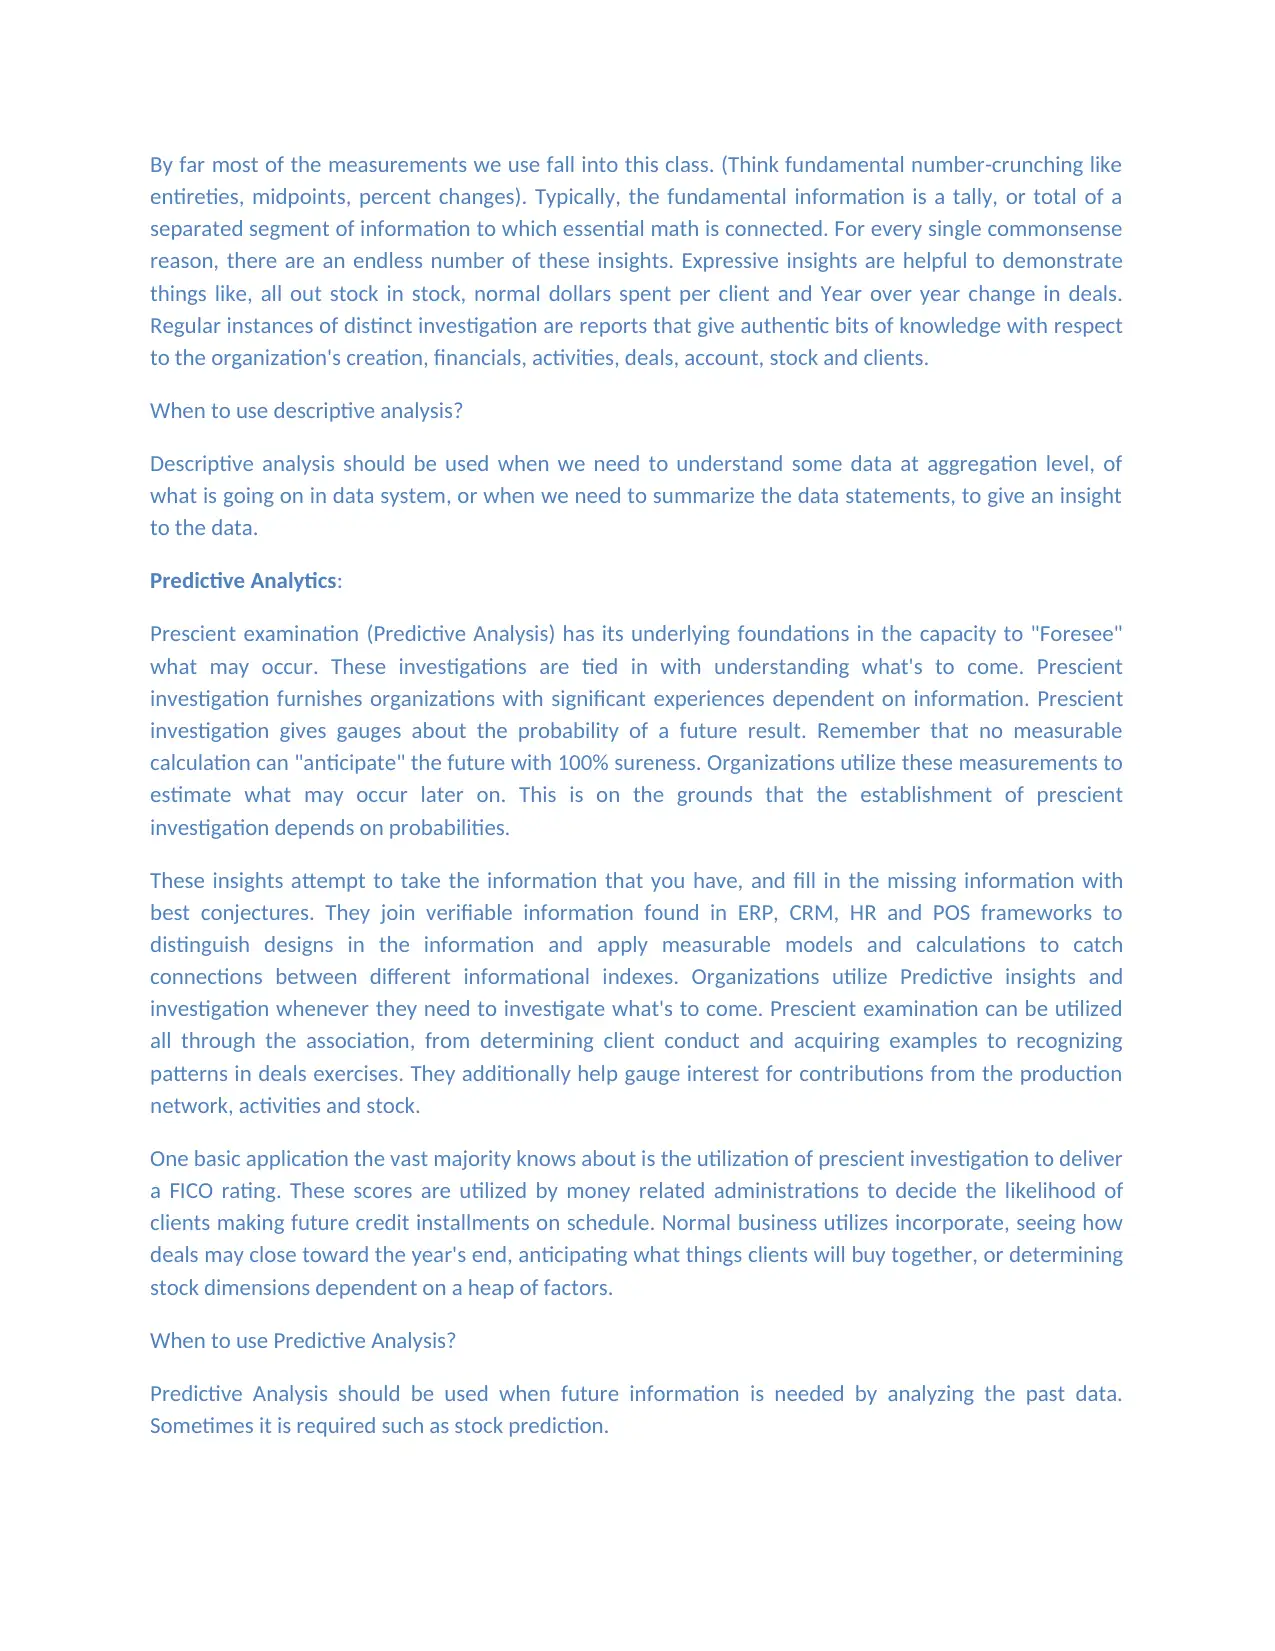
By far most of the measurements we use fall into this class. (Think fundamental number-crunching like
entireties, midpoints, percent changes). Typically, the fundamental information is a tally, or total of a
separated segment of information to which essential math is connected. For every single commonsense
reason, there are an endless number of these insights. Expressive insights are helpful to demonstrate
things like, all out stock in stock, normal dollars spent per client and Year over year change in deals.
Regular instances of distinct investigation are reports that give authentic bits of knowledge with respect
to the organization's creation, financials, activities, deals, account, stock and clients.
When to use descriptive analysis?
Descriptive analysis should be used when we need to understand some data at aggregation level, of
what is going on in data system, or when we need to summarize the data statements, to give an insight
to the data.
Predictive Analytics:
Prescient examination (Predictive Analysis) has its underlying foundations in the capacity to "Foresee"
what may occur. These investigations are tied in with understanding what's to come. Prescient
investigation furnishes organizations with significant experiences dependent on information. Prescient
investigation gives gauges about the probability of a future result. Remember that no measurable
calculation can "anticipate" the future with 100% sureness. Organizations utilize these measurements to
estimate what may occur later on. This is on the grounds that the establishment of prescient
investigation depends on probabilities.
These insights attempt to take the information that you have, and fill in the missing information with
best conjectures. They join verifiable information found in ERP, CRM, HR and POS frameworks to
distinguish designs in the information and apply measurable models and calculations to catch
connections between different informational indexes. Organizations utilize Predictive insights and
investigation whenever they need to investigate what's to come. Prescient examination can be utilized
all through the association, from determining client conduct and acquiring examples to recognizing
patterns in deals exercises. They additionally help gauge interest for contributions from the production
network, activities and stock.
One basic application the vast majority knows about is the utilization of prescient investigation to deliver
a FICO rating. These scores are utilized by money related administrations to decide the likelihood of
clients making future credit installments on schedule. Normal business utilizes incorporate, seeing how
deals may close toward the year's end, anticipating what things clients will buy together, or determining
stock dimensions dependent on a heap of factors.
When to use Predictive Analysis?
Predictive Analysis should be used when future information is needed by analyzing the past data.
Sometimes it is required such as stock prediction.
⊘ This is a preview!⊘
Do you want full access?
Subscribe today to unlock all pages.
Trusted by 1+ million students worldwide
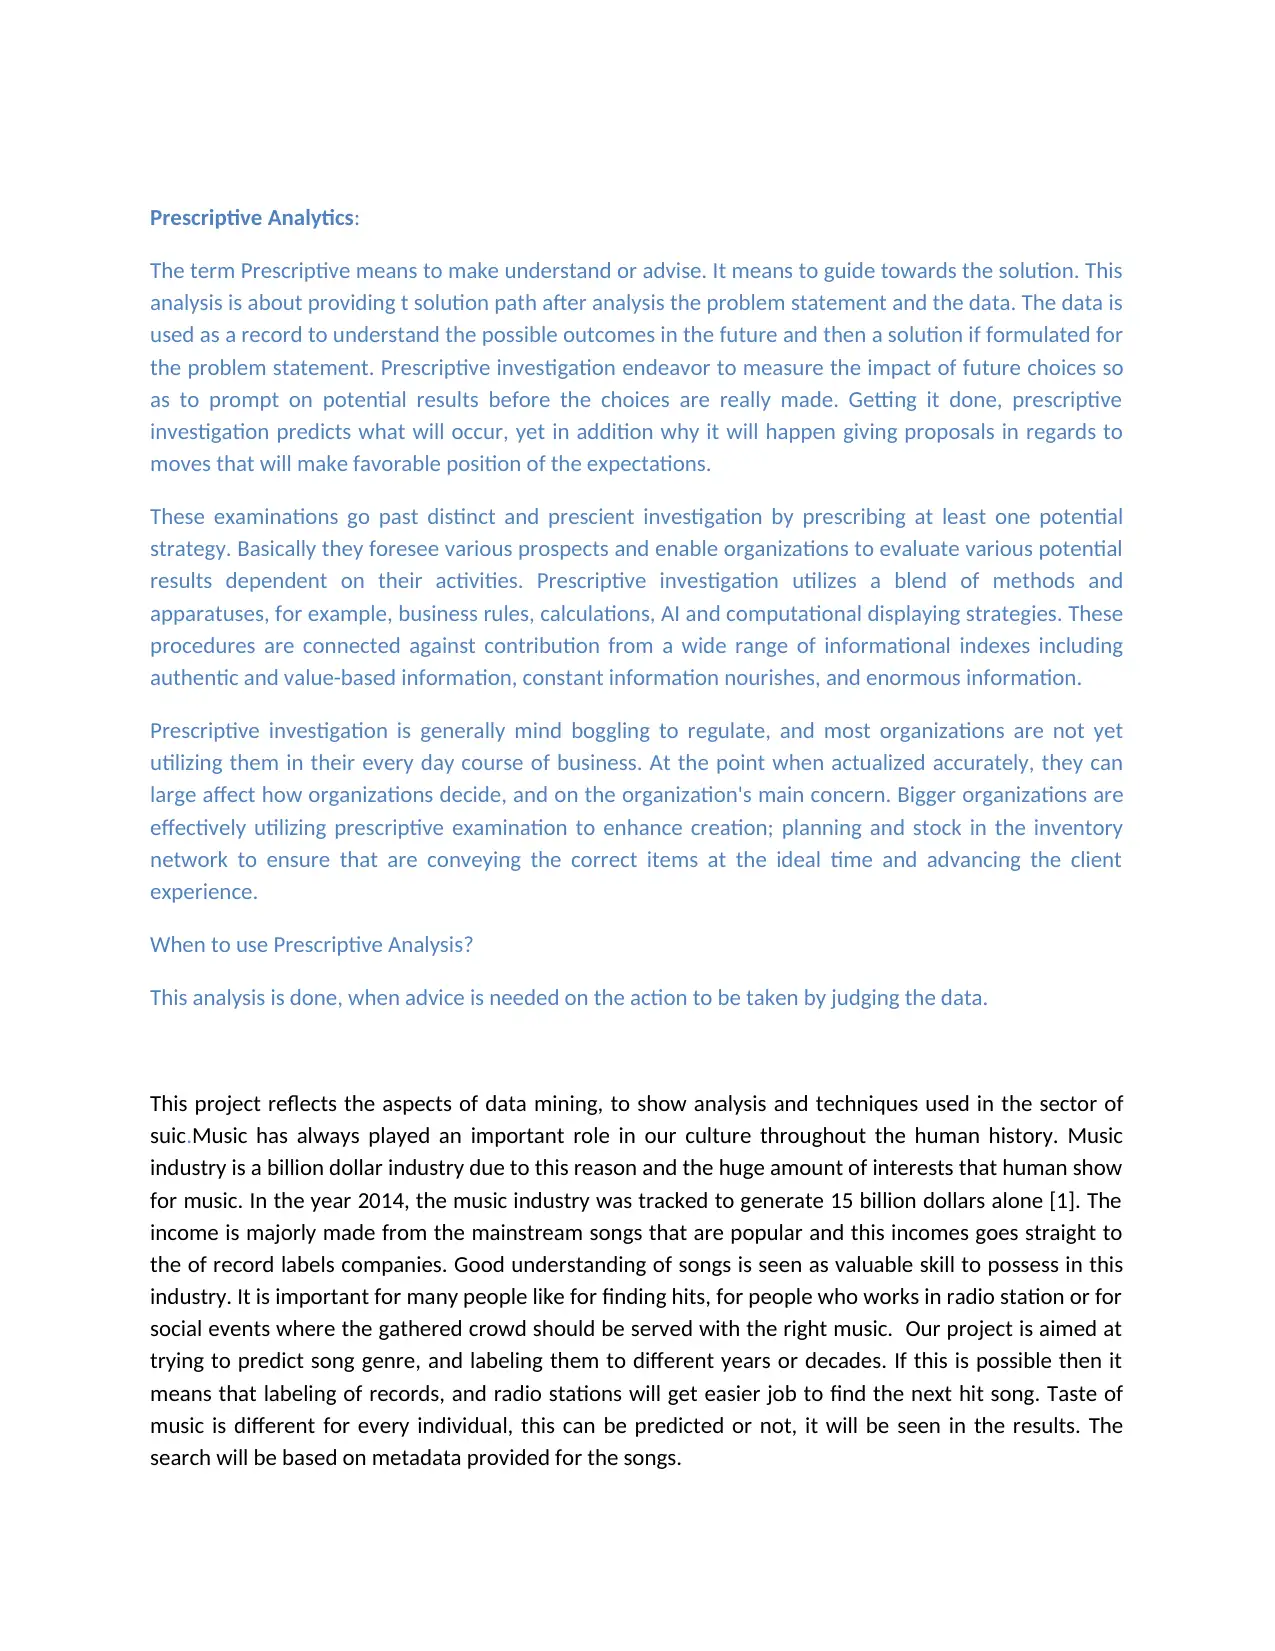
Prescriptive Analytics:
The term Prescriptive means to make understand or advise. It means to guide towards the solution. This
analysis is about providing t solution path after analysis the problem statement and the data. The data is
used as a record to understand the possible outcomes in the future and then a solution if formulated for
the problem statement. Prescriptive investigation endeavor to measure the impact of future choices so
as to prompt on potential results before the choices are really made. Getting it done, prescriptive
investigation predicts what will occur, yet in addition why it will happen giving proposals in regards to
moves that will make favorable position of the expectations.
These examinations go past distinct and prescient investigation by prescribing at least one potential
strategy. Basically they foresee various prospects and enable organizations to evaluate various potential
results dependent on their activities. Prescriptive investigation utilizes a blend of methods and
apparatuses, for example, business rules, calculations, AI and computational displaying strategies. These
procedures are connected against contribution from a wide range of informational indexes including
authentic and value-based information, constant information nourishes, and enormous information.
Prescriptive investigation is generally mind boggling to regulate, and most organizations are not yet
utilizing them in their every day course of business. At the point when actualized accurately, they can
large affect how organizations decide, and on the organization's main concern. Bigger organizations are
effectively utilizing prescriptive examination to enhance creation; planning and stock in the inventory
network to ensure that are conveying the correct items at the ideal time and advancing the client
experience.
When to use Prescriptive Analysis?
This analysis is done, when advice is needed on the action to be taken by judging the data.
This project reflects the aspects of data mining, to show analysis and techniques used in the sector of
suic.Music has always played an important role in our culture throughout the human history. Music
industry is a billion dollar industry due to this reason and the huge amount of interests that human show
for music. In the year 2014, the music industry was tracked to generate 15 billion dollars alone [1]. The
income is majorly made from the mainstream songs that are popular and this incomes goes straight to
the of record labels companies. Good understanding of songs is seen as valuable skill to possess in this
industry. It is important for many people like for finding hits, for people who works in radio station or for
social events where the gathered crowd should be served with the right music. Our project is aimed at
trying to predict song genre, and labeling them to different years or decades. If this is possible then it
means that labeling of records, and radio stations will get easier job to find the next hit song. Taste of
music is different for every individual, this can be predicted or not, it will be seen in the results. The
search will be based on metadata provided for the songs.
Paraphrase This Document
Need a fresh take? Get an instant paraphrase of this document with our AI Paraphraser
PROBLEM STATEMENT
The problem for searching the song, and their popularity have been raised in this project. This project
deals with data analysis on the songs data. The test scenario to be considered is discussed in the
Scenario section. In the project, the problem is mainly due to the three different classfiiers and analyse
how their working. Mainly the problem in the project is to deal with three different classifiers and see
how they are able to analyze the data.
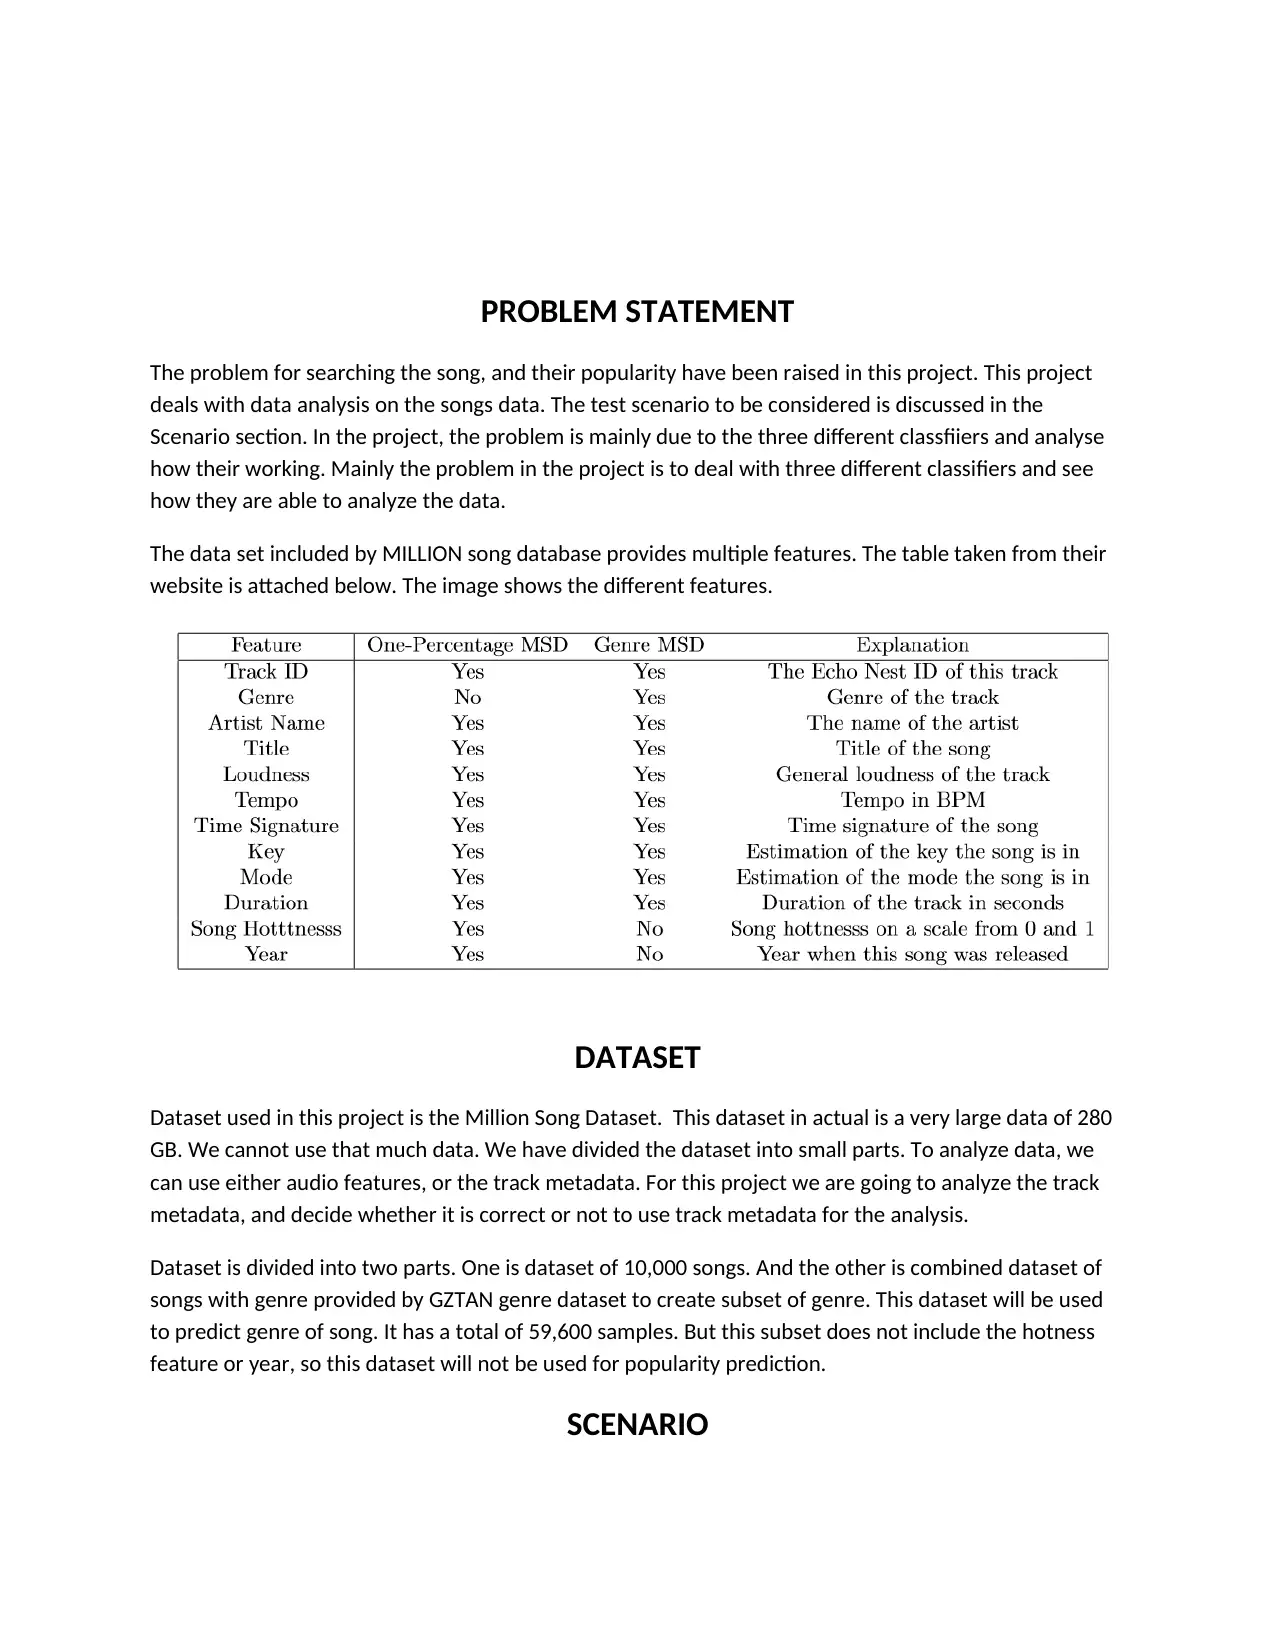
The data set included by MILLION song database provides multiple features. The table taken from their
website is attached below. The image shows the different features.
DATASET
Dataset used in this project is the Million Song Dataset. This dataset in actual is a very large data of 280
GB. We cannot use that much data. We have divided the dataset into small parts. To analyze data, we
can use either audio features, or the track metadata. For this project we are going to analyze the track
metadata, and decide whether it is correct or not to use track metadata for the analysis.
Dataset is divided into two parts. One is dataset of 10,000 songs. And the other is combined dataset of
songs with genre provided by GZTAN genre dataset to create subset of genre. This dataset will be used
to predict genre of song. It has a total of 59,600 samples. But this subset does not include the hotness
feature or year, so this dataset will not be used for popularity prediction.
SCENARIO
The problem for searching the song, and their popularity have been raised in this project. This project
deals with data analysis on the songs data. The test scenario to be considered is discussed in the
Scenario section. In the project, the problem is mainly due to the three different classfiiers and analyse
how their working. Mainly the problem in the project is to deal with three different classifiers and see
how they are able to analyze the data.
The data set included by MILLION song database provides multiple features. The table taken from their
website is attached below. The image shows the different features.
DATASET
Dataset used in this project is the Million Song Dataset. This dataset in actual is a very large data of 280
GB. We cannot use that much data. We have divided the dataset into small parts. To analyze data, we
can use either audio features, or the track metadata. For this project we are going to analyze the track
metadata, and decide whether it is correct or not to use track metadata for the analysis.
Dataset is divided into two parts. One is dataset of 10,000 songs. And the other is combined dataset of
songs with genre provided by GZTAN genre dataset to create subset of genre. This dataset will be used
to predict genre of song. It has a total of 59,600 samples. But this subset does not include the hotness
feature or year, so this dataset will not be used for popularity prediction.
SCENARIO
To analyses a song is not an easy task, as there are multiple fields on which we need to divide the
categories of analysis. Song is a very habitual thing, as it changes by the mood of listener. Still the song
which is more popular can be analyzed by the given data. Three scenarios are discussed in this session-
1) Song Popularity
In this scenario, analysis of most popular songs have been done. From the overall songs, the top
25% will be considered as popular songs, and the rest will be considered as non popular songs.
This judgment will be done on the basis of hotness of the song.
2) Predicting the Song year release date
The next scenario is the prediction scenario. In this, the prediction for the song release year is to
be done. If we analyze the year release we will notice that some specific year have more
releases. Different classes are to be formed, which will indicate the category of the songs. Then
these will be used to predict the release year for the song.
3) Genre of the Song
This test case scenario deals with the prediction of genre for the song. Already a complete
dataset is provided named Million song dataset, which contains audio features as well as track
metadata. We will not be using the audio features, instead we will be using the song track data
to predict genre of the song.
DATA ANALYSIS TECHNIQUES
Data Analysis is a vast subject having multiple ways and techniques to analyze data, and bring multiple
outputs using these data. The two techniques, discussed in the introduction section which are
exploratory ata analysis and predictive ata analysis are to be used to measure the effectiveness of each
metho on data analysis. The two techniques will be applied on the basis of the scenario assumed or
taken by us. These test case scenario includes finding the data from the given data i.e exploratory data
analysis, and predicting the data according to the given data i.e predictive data analaysis. Hence there
are two techniques-
1) Exploratory Data Analysis
2) Predictive Data Analysis
There are certain things to be done for doing data analysis. These comes in pre data mining module.
Pre-Datamining Module-
This module includes the gathering of data. The data which is taken is Million Song Dataset. This is the
collection of audio features, and metadata on a million different songs. We cannot download this
dataset as it is 280 GB including all the audio features. We will enhance our search buy using the data
analysis on 10,000 songs only. Cleaning is the process done before data analysis, so that no extra entity,
which is not required is entertained. In our cases, we have divided data into two categories. One data is
used for prediction, and one for genres. The data which is used for genres do not include year and
hotness features. This is done through deep analysis of data, and cleaning of data. In final view we have
two data set, one is text file, and the other is excel sheet.
⊘ This is a preview!⊘
Do you want full access?
Subscribe today to unlock all pages.
Trusted by 1+ million students worldwide
In this module we also look at the tool which we will be using to analyze the data. R studion will beused
to run the code and get the output.
Data-mining module
This module contains actual dealing with the data. The data is fetched in the code, and different plots
are to be formed. Two types of analysis is been done in this project. One is exploratory, for the finding of
correlation between classes of song and the loudness. Other is predictive analysis which uses three
classifiers to predict the answers. The three classifiers used are decision tree, random forest, and the
support vector machine. After this tables are forms for the result and error matrix is used to calculate
the errors percentage. On the basis of this error percentage it will be decided if it good to analyze the
dataset on the basis of track metadata or not.
Post-data mining module
After data miming and prediction is completed, results are analyzed, and conclusion ois to be done on
the basis of error percentage achieved. Error percentage should be less than 20%,else the method is not
successful. For this dataset, there can be two ways to analyze, first using the track metadata, and the
other by using audio features. We are going to analyze the track metadata for our project and conclude
that if it is the correct way to analyze song dataset or not.
IMPLEMENTATION
The Analysis is done on the basis of two techniques:-
1) Exploratory technique –
Exploratory technique is based in the description of data such as summary of data to distinguish
the data in the basis of genre, age etc. The technique used here in the music judgment
comprises the use of correlations for the loudness factors. There are several genre available in
the file, if e group the whole data according to the genre type, we will get 10 types of genre
available. A graph is plotted for genre type vs loudness showing the loudness values for the
particular genre type, and shown below:
Paraphrase This Document
Need a fresh take? Get an instant paraphrase of this document with our AI Paraphraser
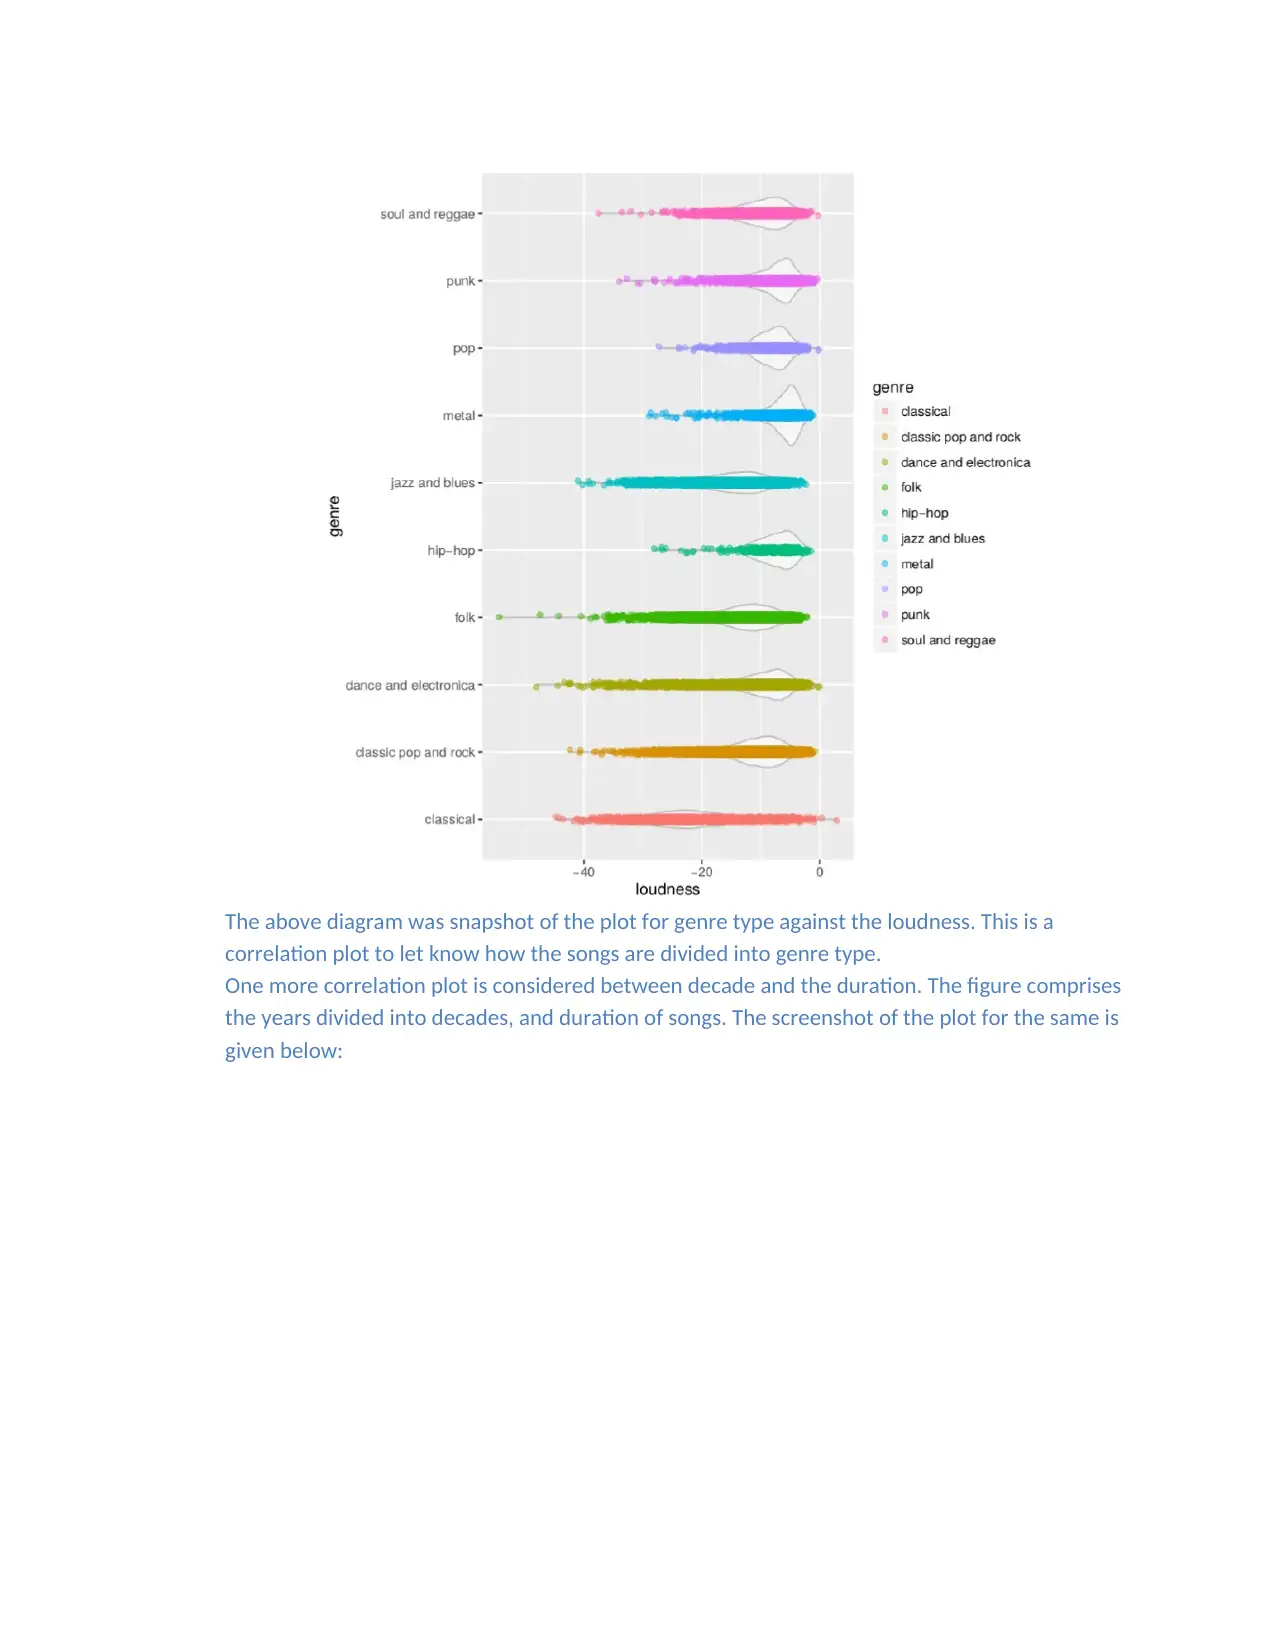
The above diagram was snapshot of the plot for genre type against the loudness. This is a
correlation plot to let know how the songs are divided into genre type.
One more correlation plot is considered between decade and the duration. The figure comprises
the years divided into decades, and duration of songs. The screenshot of the plot for the same is
given below:
correlation plot to let know how the songs are divided into genre type.
One more correlation plot is considered between decade and the duration. The figure comprises
the years divided into decades, and duration of songs. The screenshot of the plot for the same is
given below:
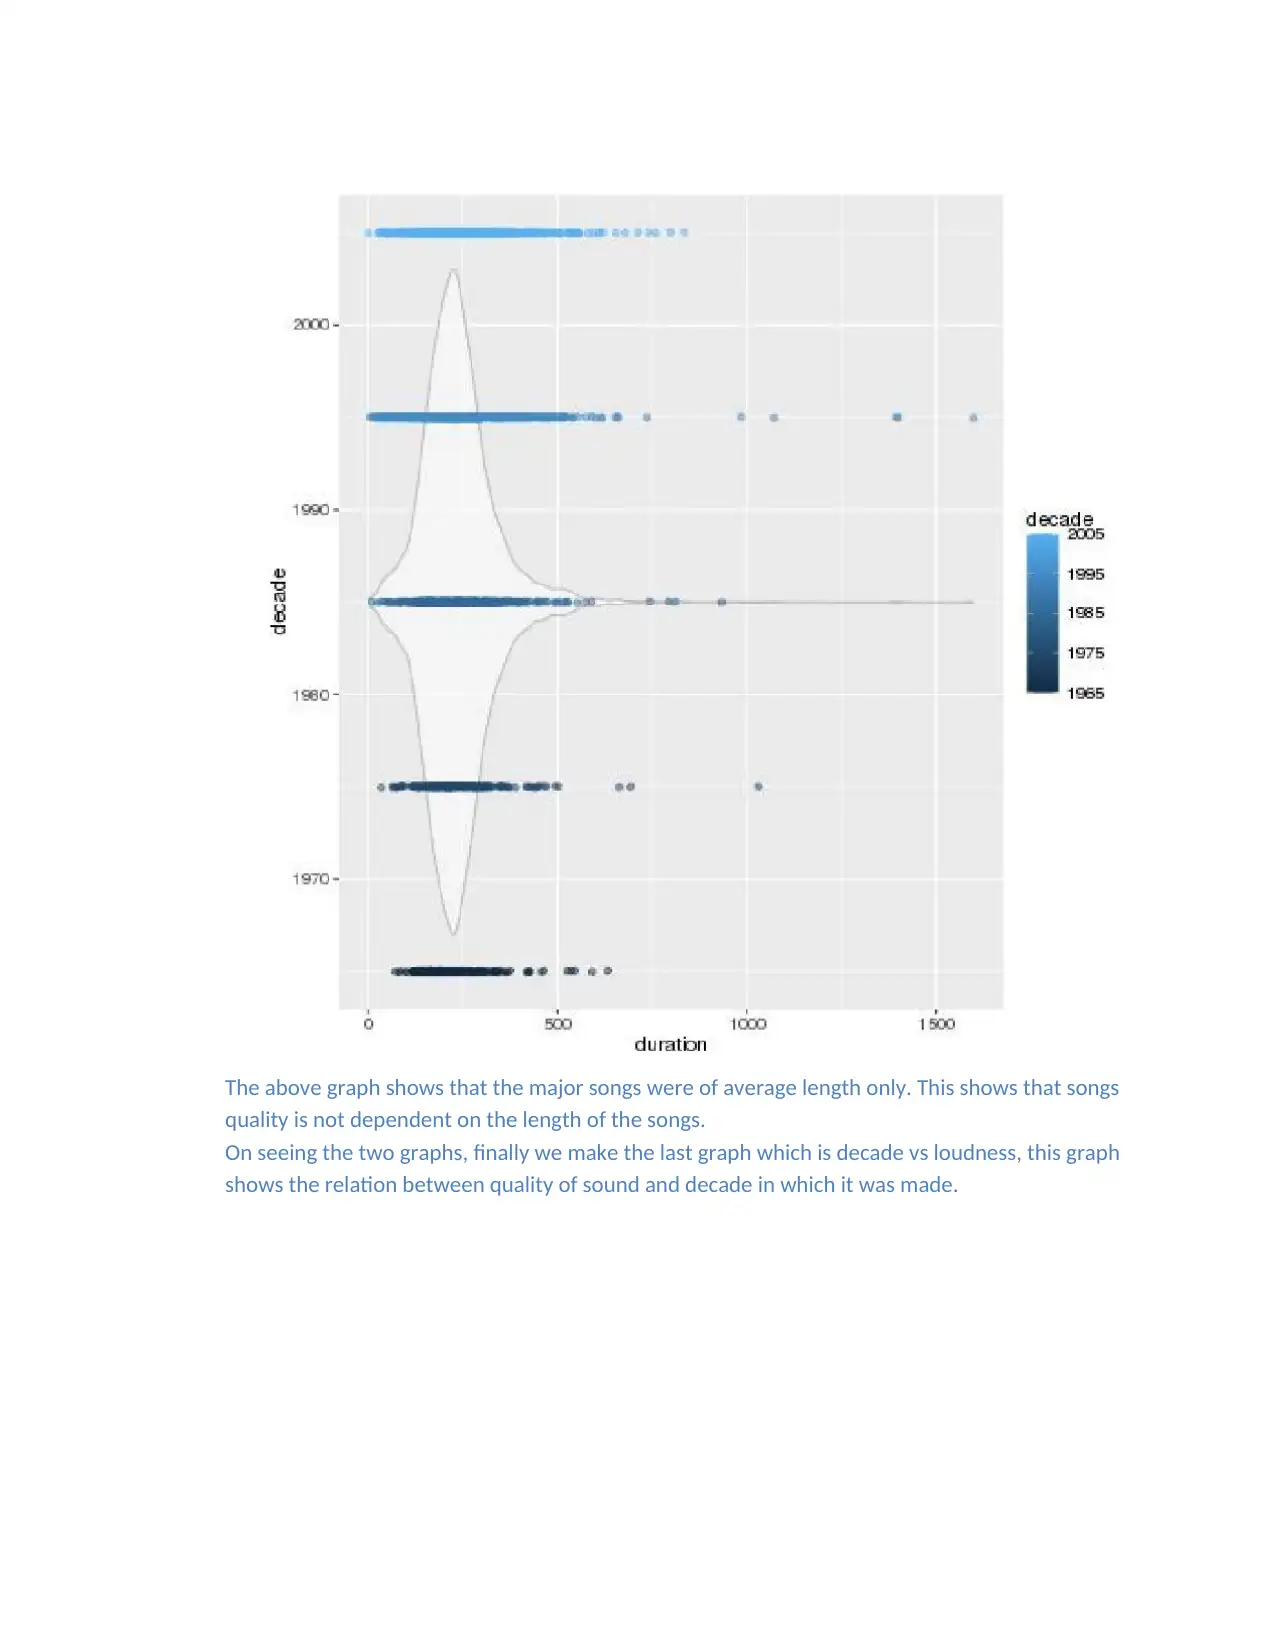
The above graph shows that the major songs were of average length only. This shows that songs
quality is not dependent on the length of the songs.
On seeing the two graphs, finally we make the last graph which is decade vs loudness, this graph
shows the relation between quality of sound and decade in which it was made.
quality is not dependent on the length of the songs.
On seeing the two graphs, finally we make the last graph which is decade vs loudness, this graph
shows the relation between quality of sound and decade in which it was made.
⊘ This is a preview!⊘
Do you want full access?
Subscribe today to unlock all pages.
Trusted by 1+ million students worldwide
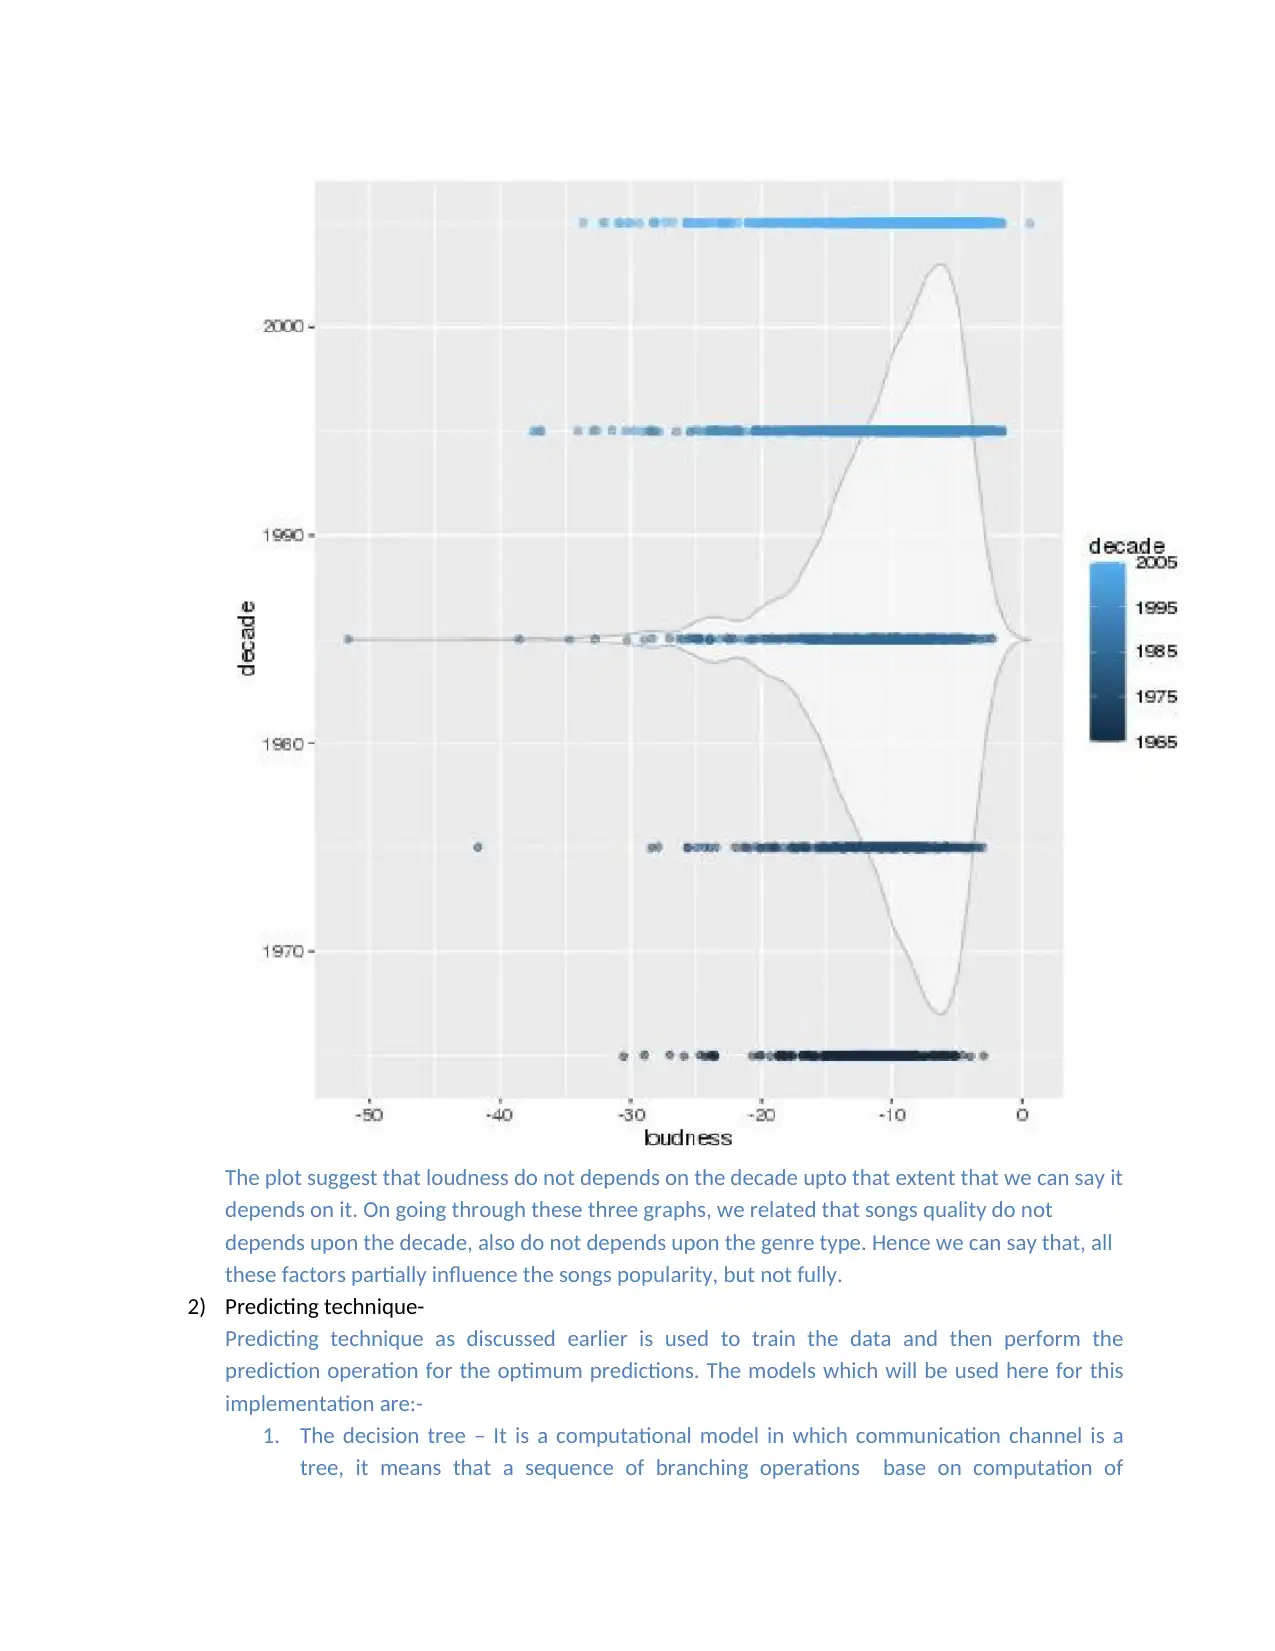
The plot suggest that loudness do not depends on the decade upto that extent that we can say it
depends on it. On going through these three graphs, we related that songs quality do not
depends upon the decade, also do not depends upon the genre type. Hence we can say that, all
these factors partially influence the songs popularity, but not fully.
2) Predicting technique-
Predicting technique as discussed earlier is used to train the data and then perform the
prediction operation for the optimum predictions. The models which will be used here for this
implementation are:-
1. The decision tree – It is a computational model in which communication channel is a
tree, it means that a sequence of branching operations base on computation of
Paraphrase This Document
Need a fresh take? Get an instant paraphrase of this document with our AI Paraphraser
quantities. This model can be converted to if-else model easily. This model is easy to
understand. This model can be generally used in segmentation, stratification, prediction,
Data reduction and variable screening, interaction identification, category merging and
banding continuous variables.
2. Random Forest – It is a popular ensemble method, that is used for building predictive
models, for classification as well as regression problems. Ensemlbe method use multiple
learning models to for better predictive results. It is much more efficient then decision
tree model.
3. Support Vector Machine – The motive of this model is to find the plane on N-dimension
which will distinctly classifies the data points to observe. This plane is called hyper
plane. Hyper planes are the decision boundaries that will classify the data points.
We have used these three models because of the simplicity of decision tree, and modification in
decision tree. As we develop decision tree model, we would also like to see the variation of it,
which we see in random forest model, and then further we have used SVM, to learn a complex
model
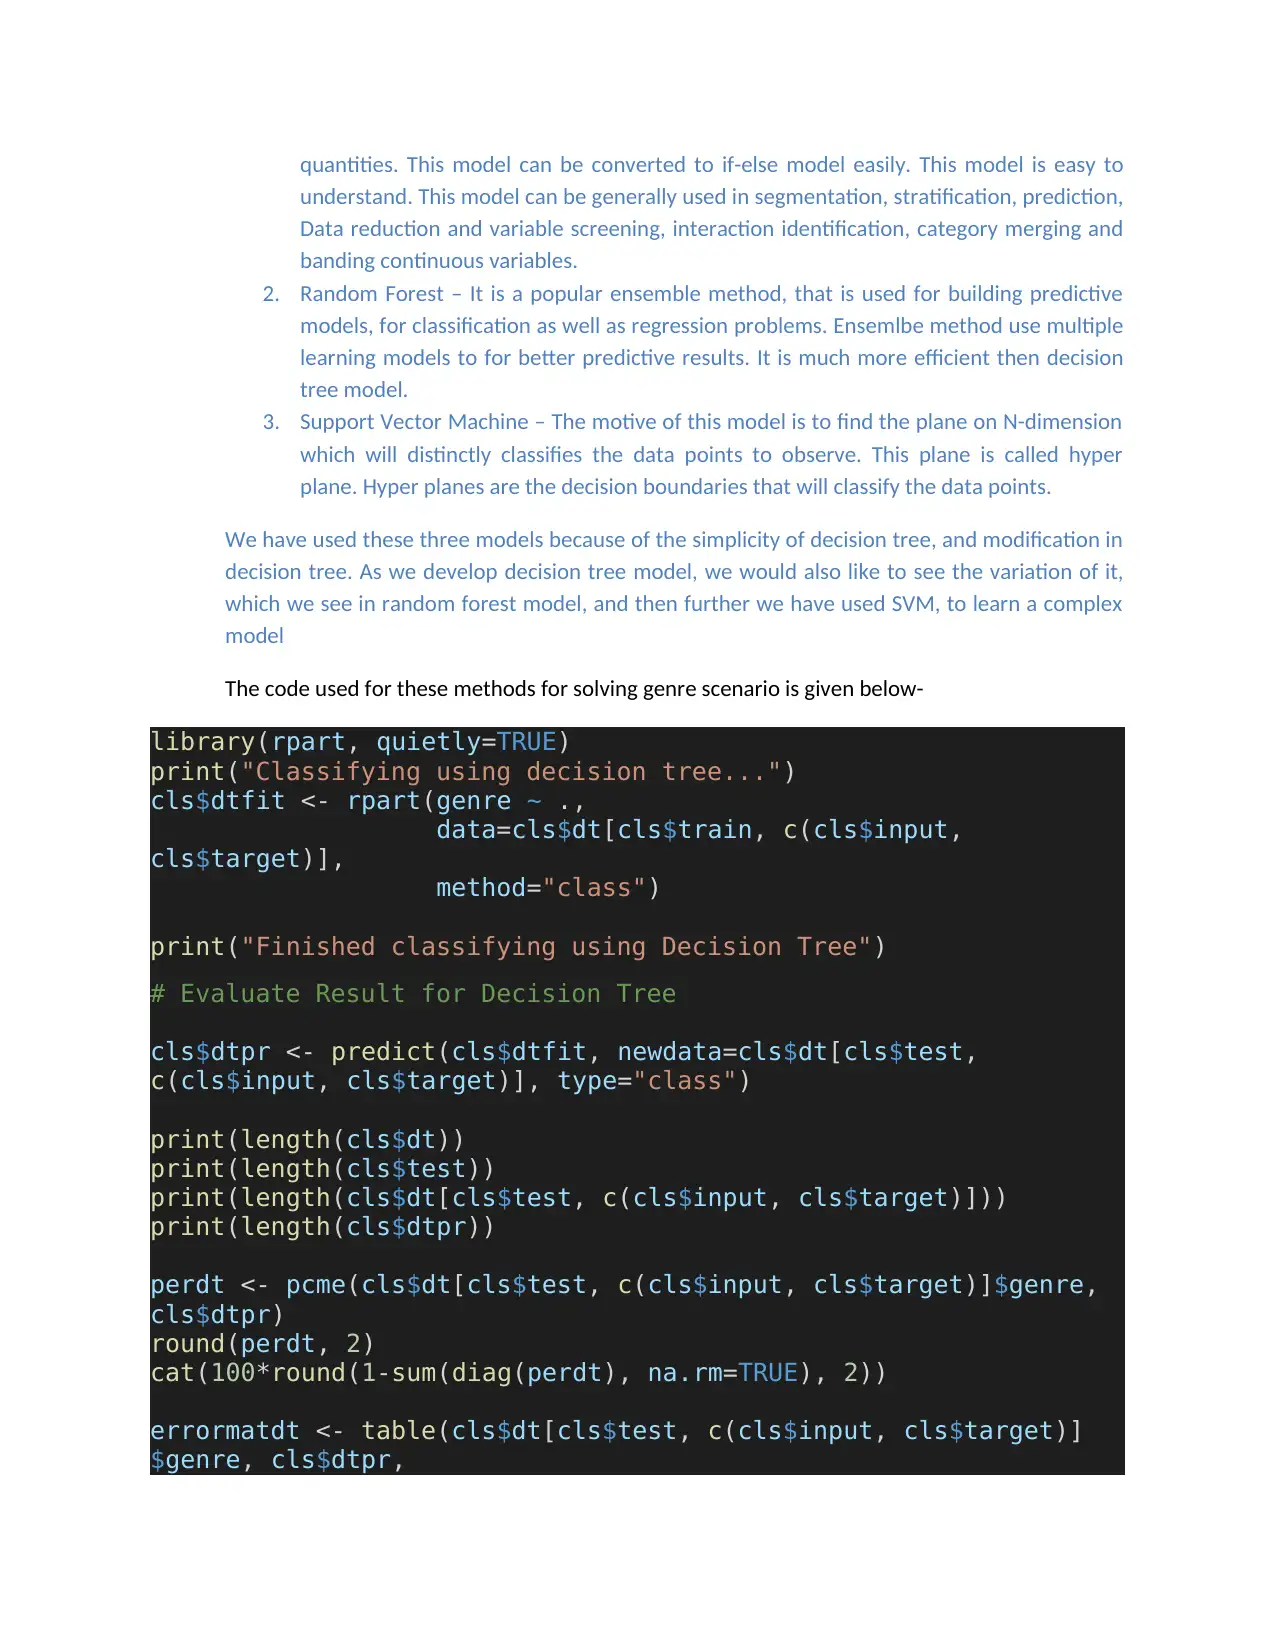
The code used for these methods for solving genre scenario is given below-
library(rpart, quietly=TRUE)
print("Classifying using decision tree...")
cls$dtfit <- rpart(genre ~ .,
data=cls$dt[cls$train, c(cls$input,
cls$target)],
method="class")
print("Finished classifying using Decision Tree")
# Evaluate Result for Decision Tree
cls$dtpr <- predict(cls$dtfit, newdata=cls$dt[cls$test,
c(cls$input, cls$target)], type="class")
print(length(cls$dt))
print(length(cls$test))
print(length(cls$dt[cls$test, c(cls$input, cls$target)]))
print(length(cls$dtpr))
perdt <- pcme(cls$dt[cls$test, c(cls$input, cls$target)]$genre,
cls$dtpr)
round(perdt, 2)
cat(100*round(1-sum(diag(perdt), na.rm=TRUE), 2))
errormatdt <- table(cls$dt[cls$test, c(cls$input, cls$target)]
$genre, cls$dtpr,
understand. This model can be generally used in segmentation, stratification, prediction,
Data reduction and variable screening, interaction identification, category merging and
banding continuous variables.
2. Random Forest – It is a popular ensemble method, that is used for building predictive
models, for classification as well as regression problems. Ensemlbe method use multiple
learning models to for better predictive results. It is much more efficient then decision
tree model.
3. Support Vector Machine – The motive of this model is to find the plane on N-dimension
which will distinctly classifies the data points to observe. This plane is called hyper
plane. Hyper planes are the decision boundaries that will classify the data points.
We have used these three models because of the simplicity of decision tree, and modification in
decision tree. As we develop decision tree model, we would also like to see the variation of it,
which we see in random forest model, and then further we have used SVM, to learn a complex
model
The code used for these methods for solving genre scenario is given below-
library(rpart, quietly=TRUE)
print("Classifying using decision tree...")
cls$dtfit <- rpart(genre ~ .,
data=cls$dt[cls$train, c(cls$input,
cls$target)],
method="class")
print("Finished classifying using Decision Tree")
# Evaluate Result for Decision Tree
cls$dtpr <- predict(cls$dtfit, newdata=cls$dt[cls$test,
c(cls$input, cls$target)], type="class")
print(length(cls$dt))
print(length(cls$test))
print(length(cls$dt[cls$test, c(cls$input, cls$target)]))
print(length(cls$dtpr))
perdt <- pcme(cls$dt[cls$test, c(cls$input, cls$target)]$genre,
cls$dtpr)
round(perdt, 2)
cat(100*round(1-sum(diag(perdt), na.rm=TRUE), 2))
errormatdt <- table(cls$dt[cls$test, c(cls$input, cls$target)]
$genre, cls$dtpr,
useNA="ifany",
dnn=c("Actual", "Predicted"))
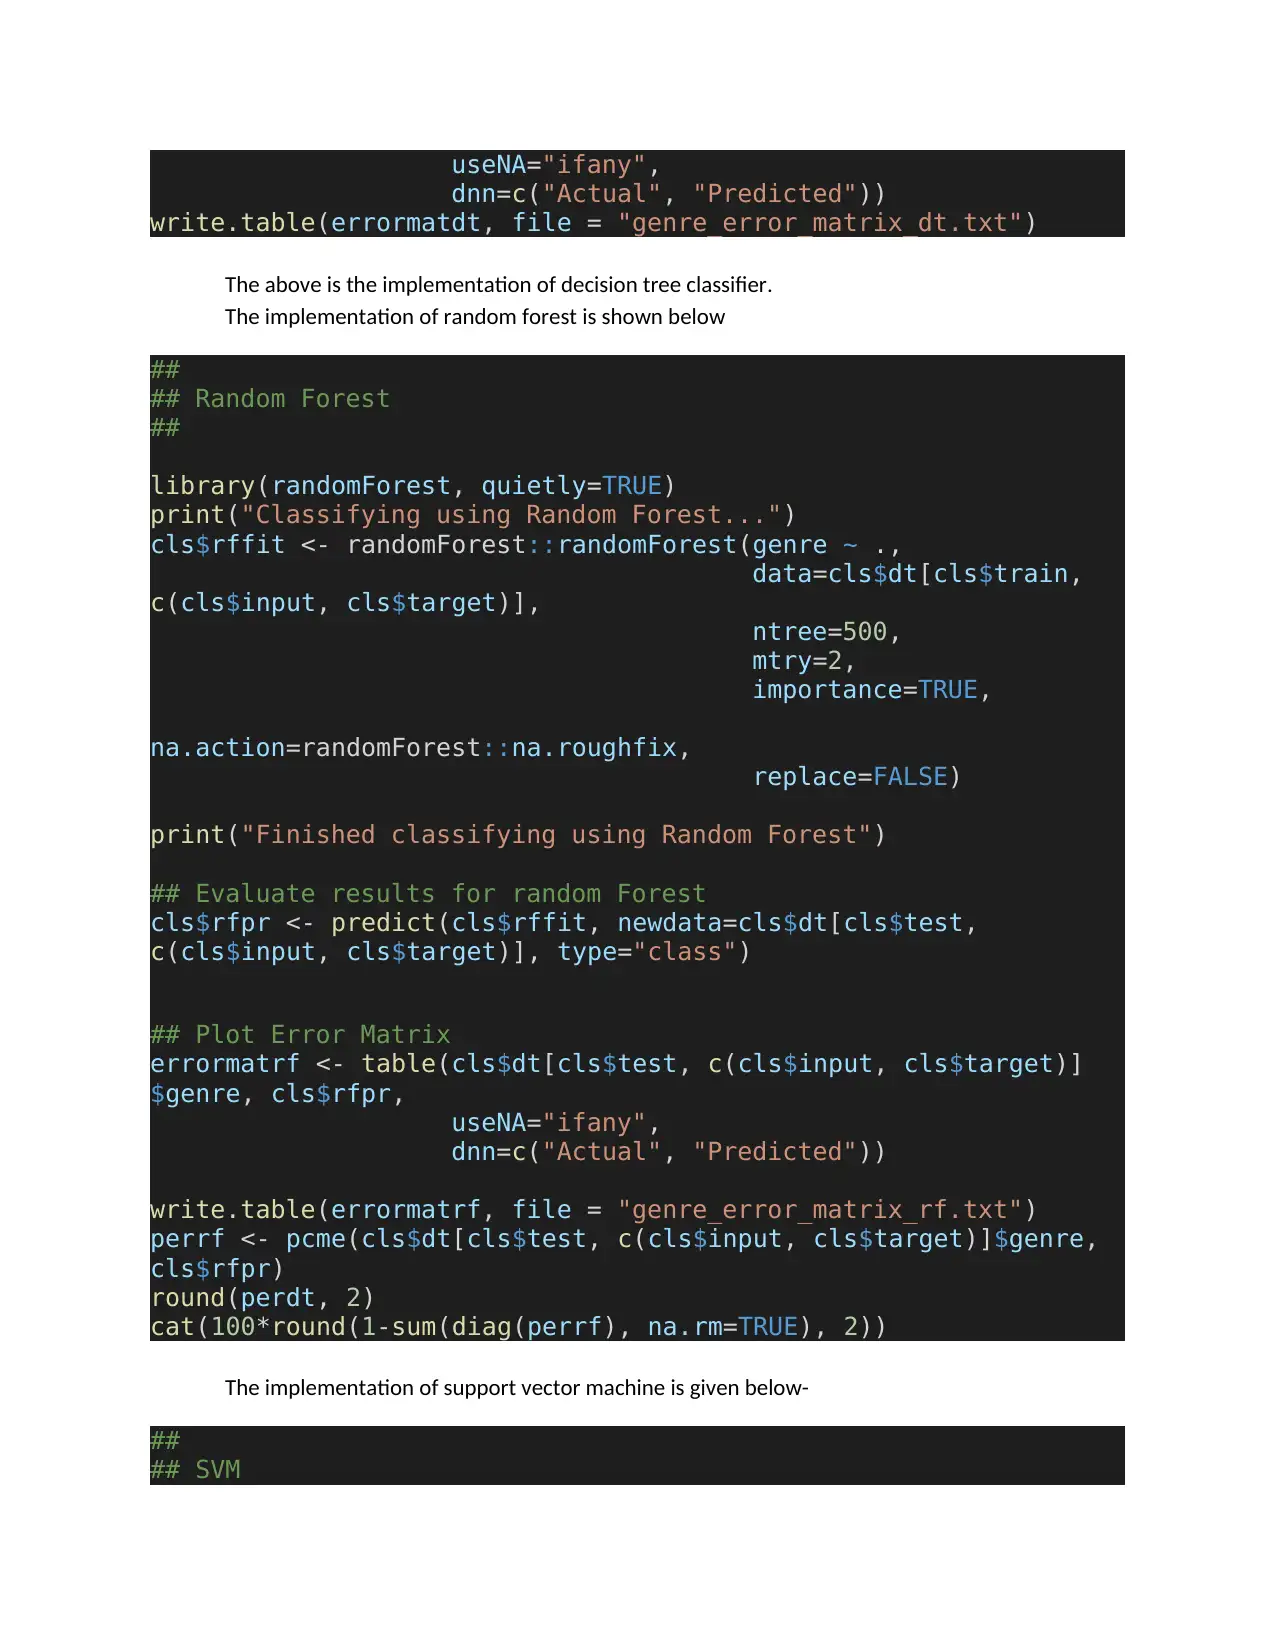
write.table(errormatdt, file = "genre_error_matrix_dt.txt")
The above is the implementation of decision tree classifier.
The implementation of random forest is shown below
##
## Random Forest
##
library(randomForest, quietly=TRUE)
print("Classifying using Random Forest...")
cls$rffit <- randomForest::randomForest(genre ~ .,
data=cls$dt[cls$train,
c(cls$input, cls$target)],
ntree=500,
mtry=2,
importance=TRUE,
na.action=randomForest::na.roughfix,
replace=FALSE)
print("Finished classifying using Random Forest")
## Evaluate results for random Forest
cls$rfpr <- predict(cls$rffit, newdata=cls$dt[cls$test,
c(cls$input, cls$target)], type="class")
## Plot Error Matrix
errormatrf <- table(cls$dt[cls$test, c(cls$input, cls$target)]
$genre, cls$rfpr,
useNA="ifany",
dnn=c("Actual", "Predicted"))
write.table(errormatrf, file = "genre_error_matrix_rf.txt")
perrf <- pcme(cls$dt[cls$test, c(cls$input, cls$target)]$genre,
cls$rfpr)
round(perdt, 2)
cat(100*round(1-sum(diag(perrf), na.rm=TRUE), 2))
The implementation of support vector machine is given below-
##
## SVM
dnn=c("Actual", "Predicted"))
write.table(errormatdt, file = "genre_error_matrix_dt.txt")
The above is the implementation of decision tree classifier.
The implementation of random forest is shown below
##
## Random Forest
##
library(randomForest, quietly=TRUE)
print("Classifying using Random Forest...")
cls$rffit <- randomForest::randomForest(genre ~ .,
data=cls$dt[cls$train,
c(cls$input, cls$target)],
ntree=500,
mtry=2,
importance=TRUE,
na.action=randomForest::na.roughfix,
replace=FALSE)
print("Finished classifying using Random Forest")
## Evaluate results for random Forest
cls$rfpr <- predict(cls$rffit, newdata=cls$dt[cls$test,
c(cls$input, cls$target)], type="class")
## Plot Error Matrix
errormatrf <- table(cls$dt[cls$test, c(cls$input, cls$target)]
$genre, cls$rfpr,
useNA="ifany",
dnn=c("Actual", "Predicted"))
write.table(errormatrf, file = "genre_error_matrix_rf.txt")
perrf <- pcme(cls$dt[cls$test, c(cls$input, cls$target)]$genre,
cls$rfpr)
round(perdt, 2)
cat(100*round(1-sum(diag(perrf), na.rm=TRUE), 2))
The implementation of support vector machine is given below-
##
## SVM
⊘ This is a preview!⊘
Do you want full access?
Subscribe today to unlock all pages.
Trusted by 1+ million students worldwide
1 out of 17
Related Documents


Your All-in-One AI-Powered Toolkit for Academic Success.
+13062052269
info@desklib.com
Available 24*7 on WhatsApp / Email
![[object Object]](/_next/static/media/star-bottom.7253800d.svg)
Unlock your academic potential
Copyright © 2020–2026 A2Z Services. All Rights Reserved. Developed and managed by ZUCOL.