Data Mining and Visualization Assignment: XL Miner Analysis

Verified

Added on  2020/03/28

|9
|1040
|50
Homework Assignment
AI Summary
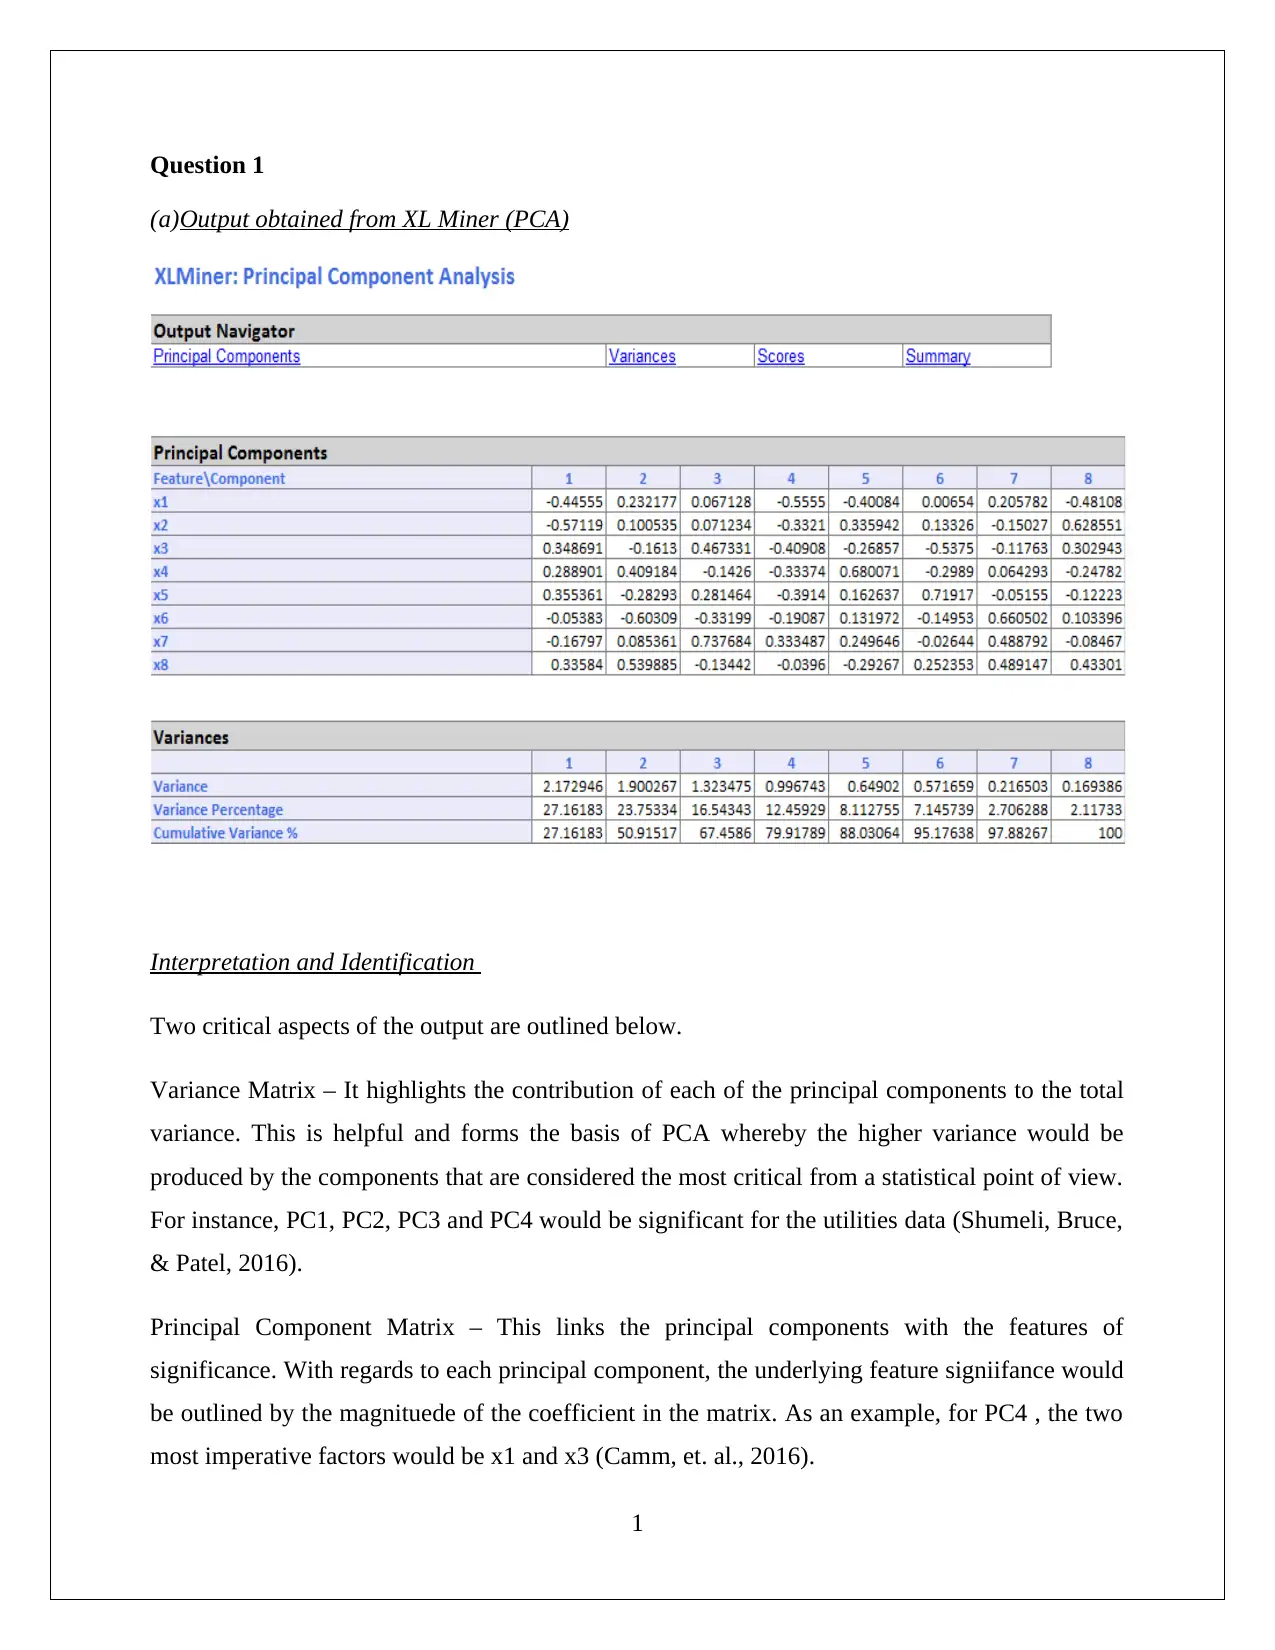
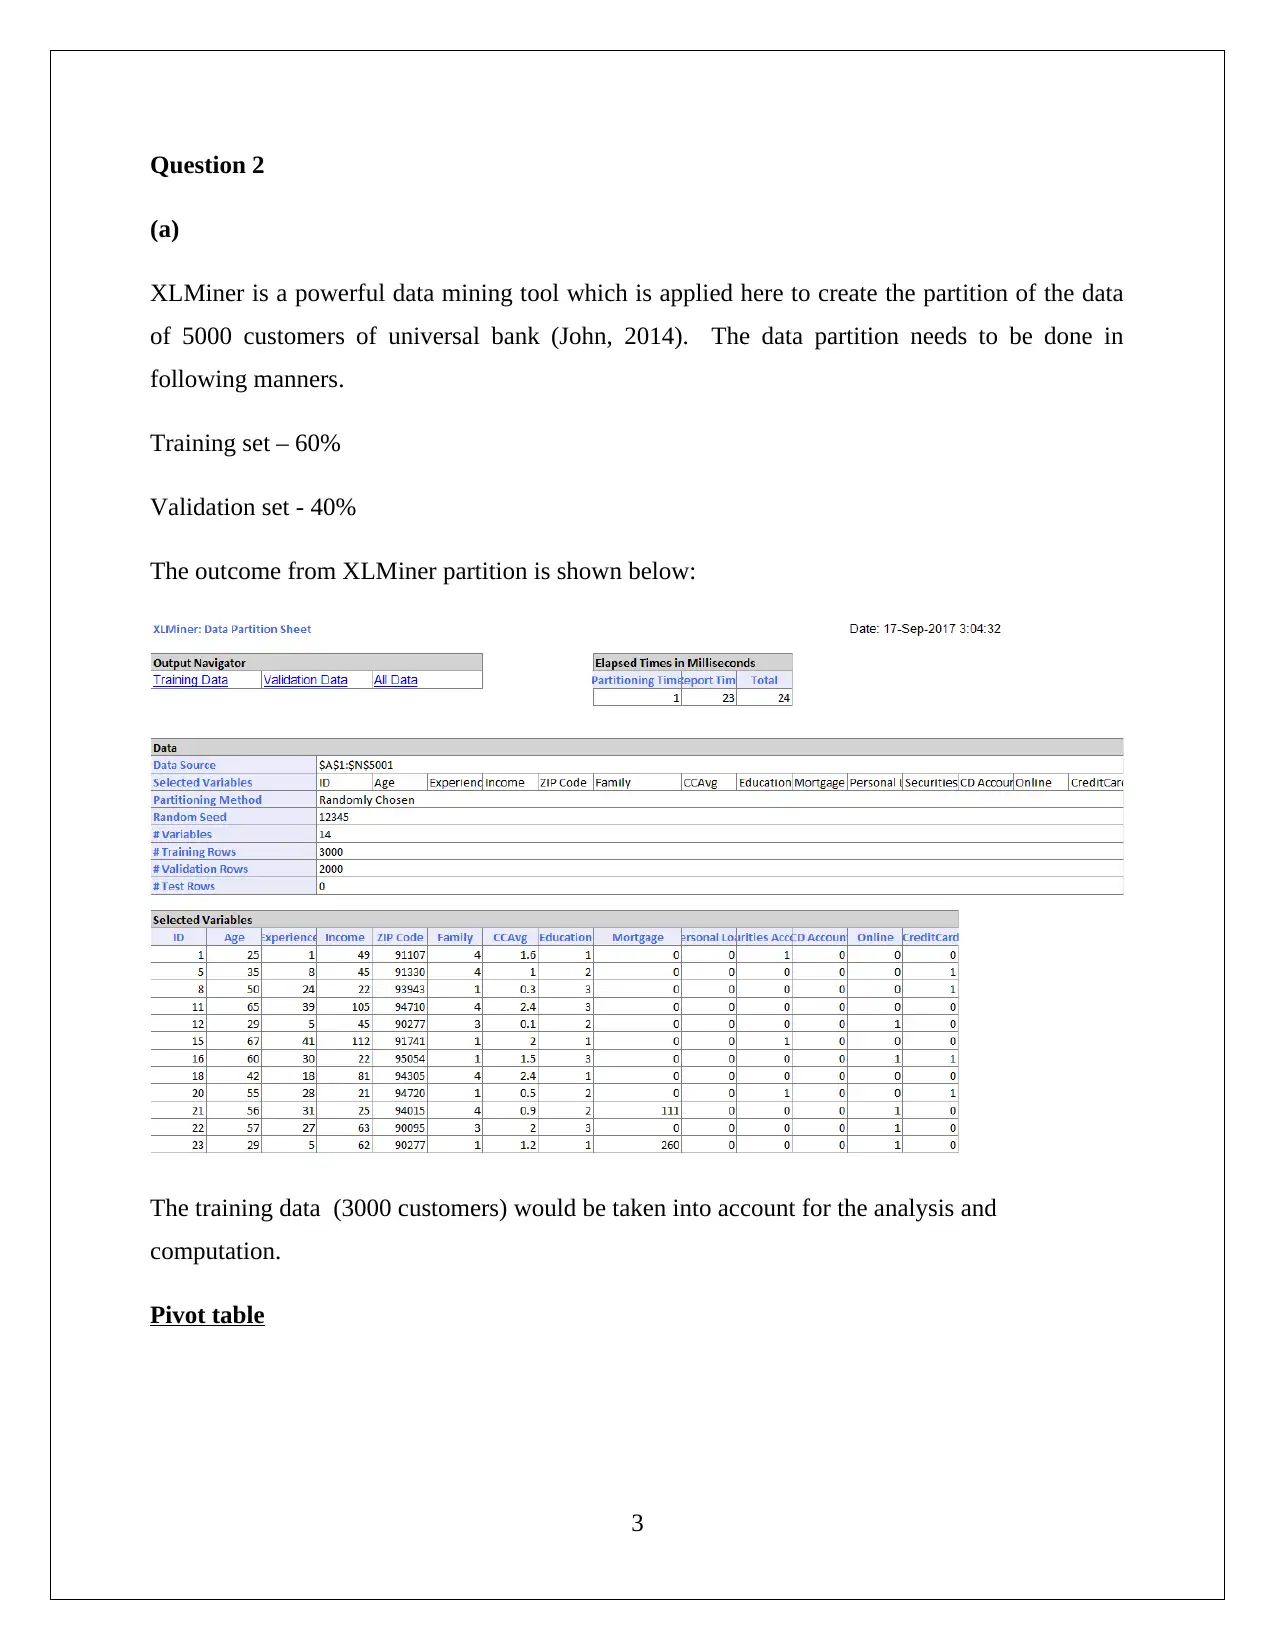
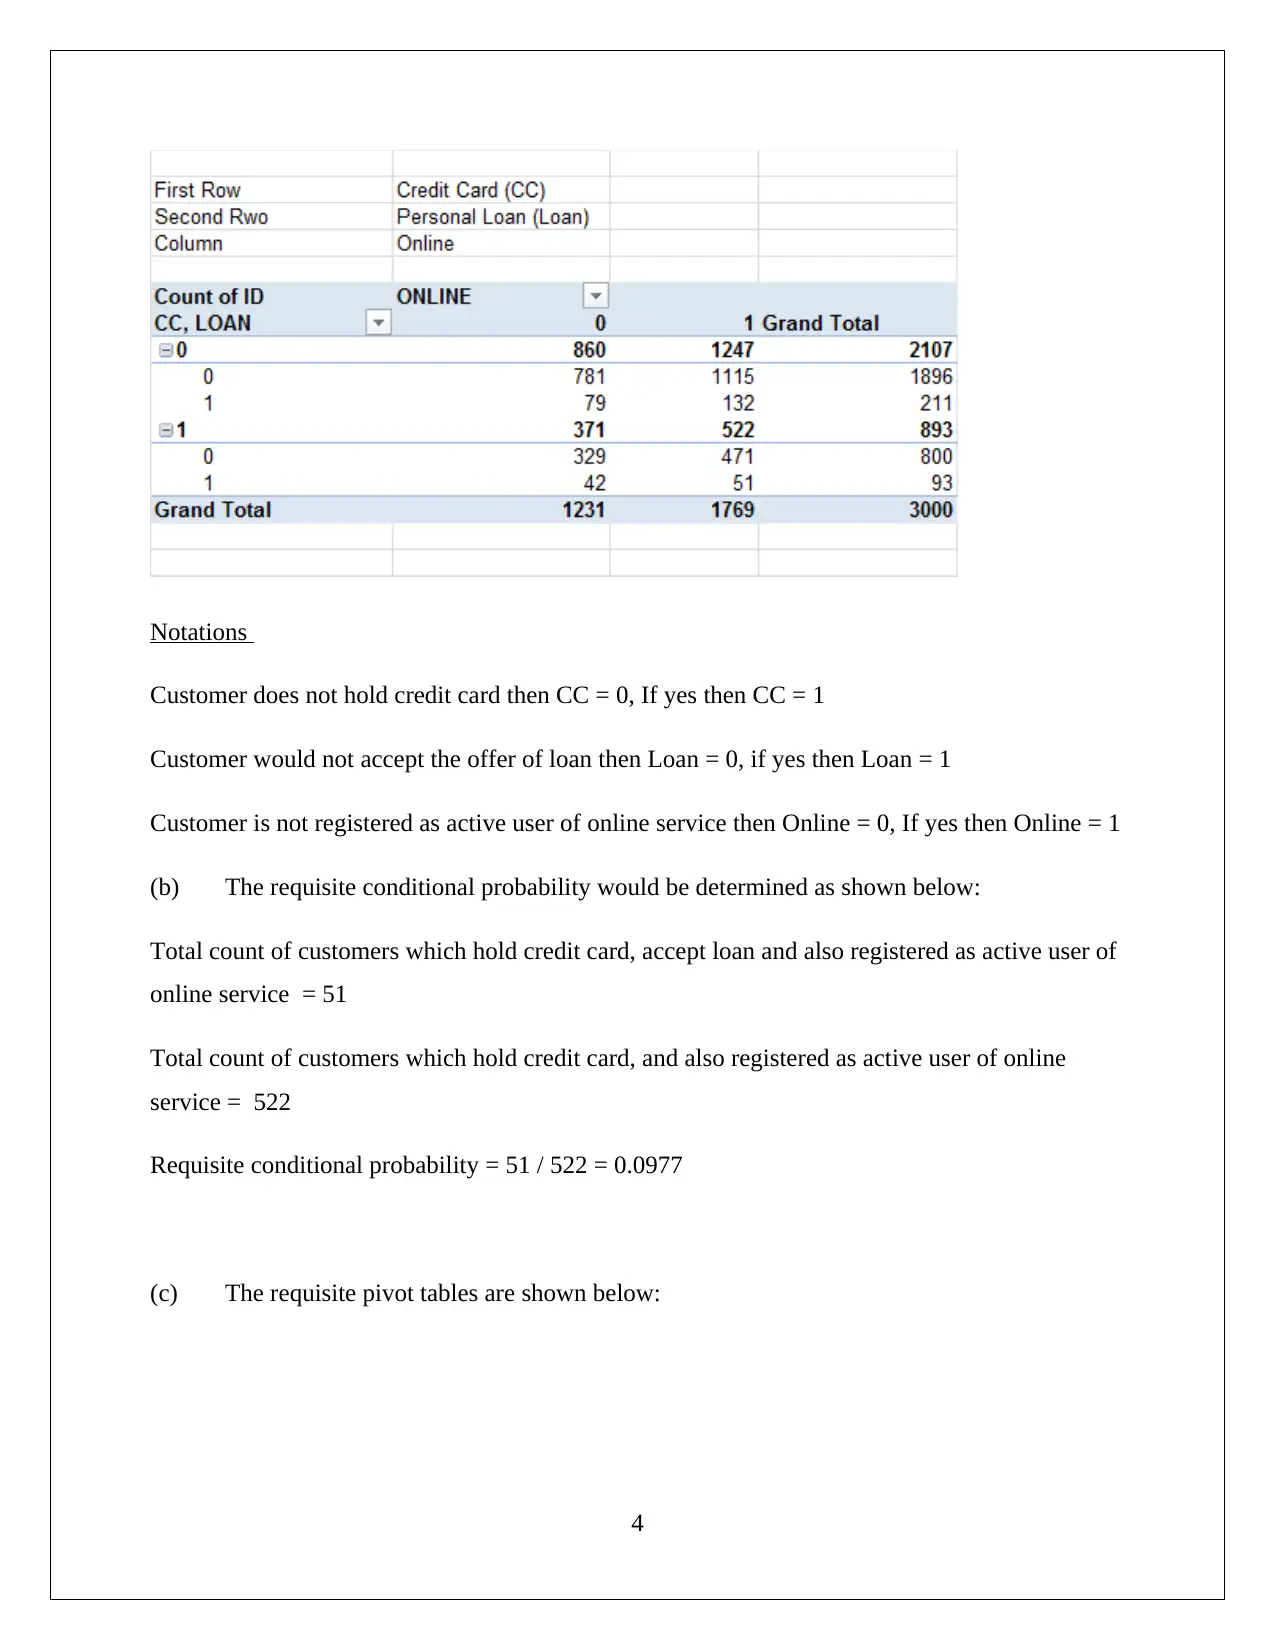
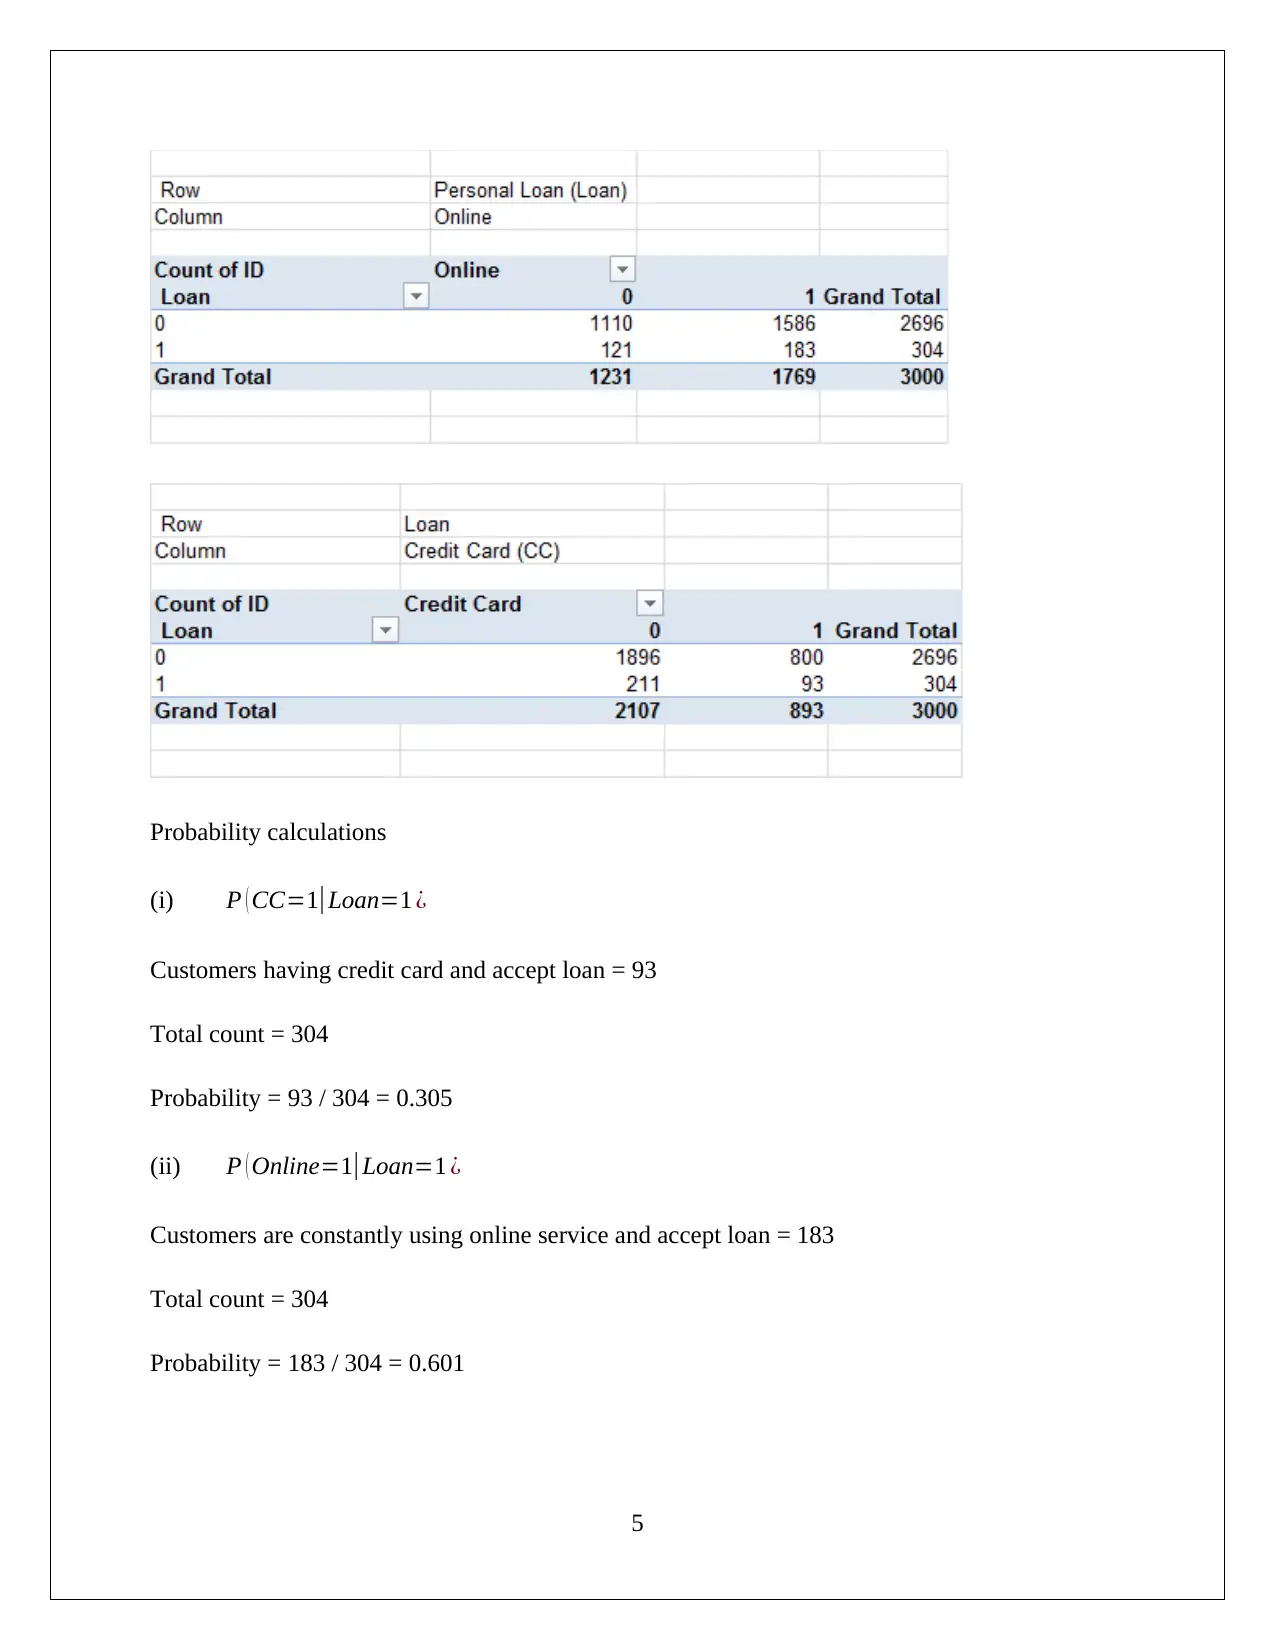
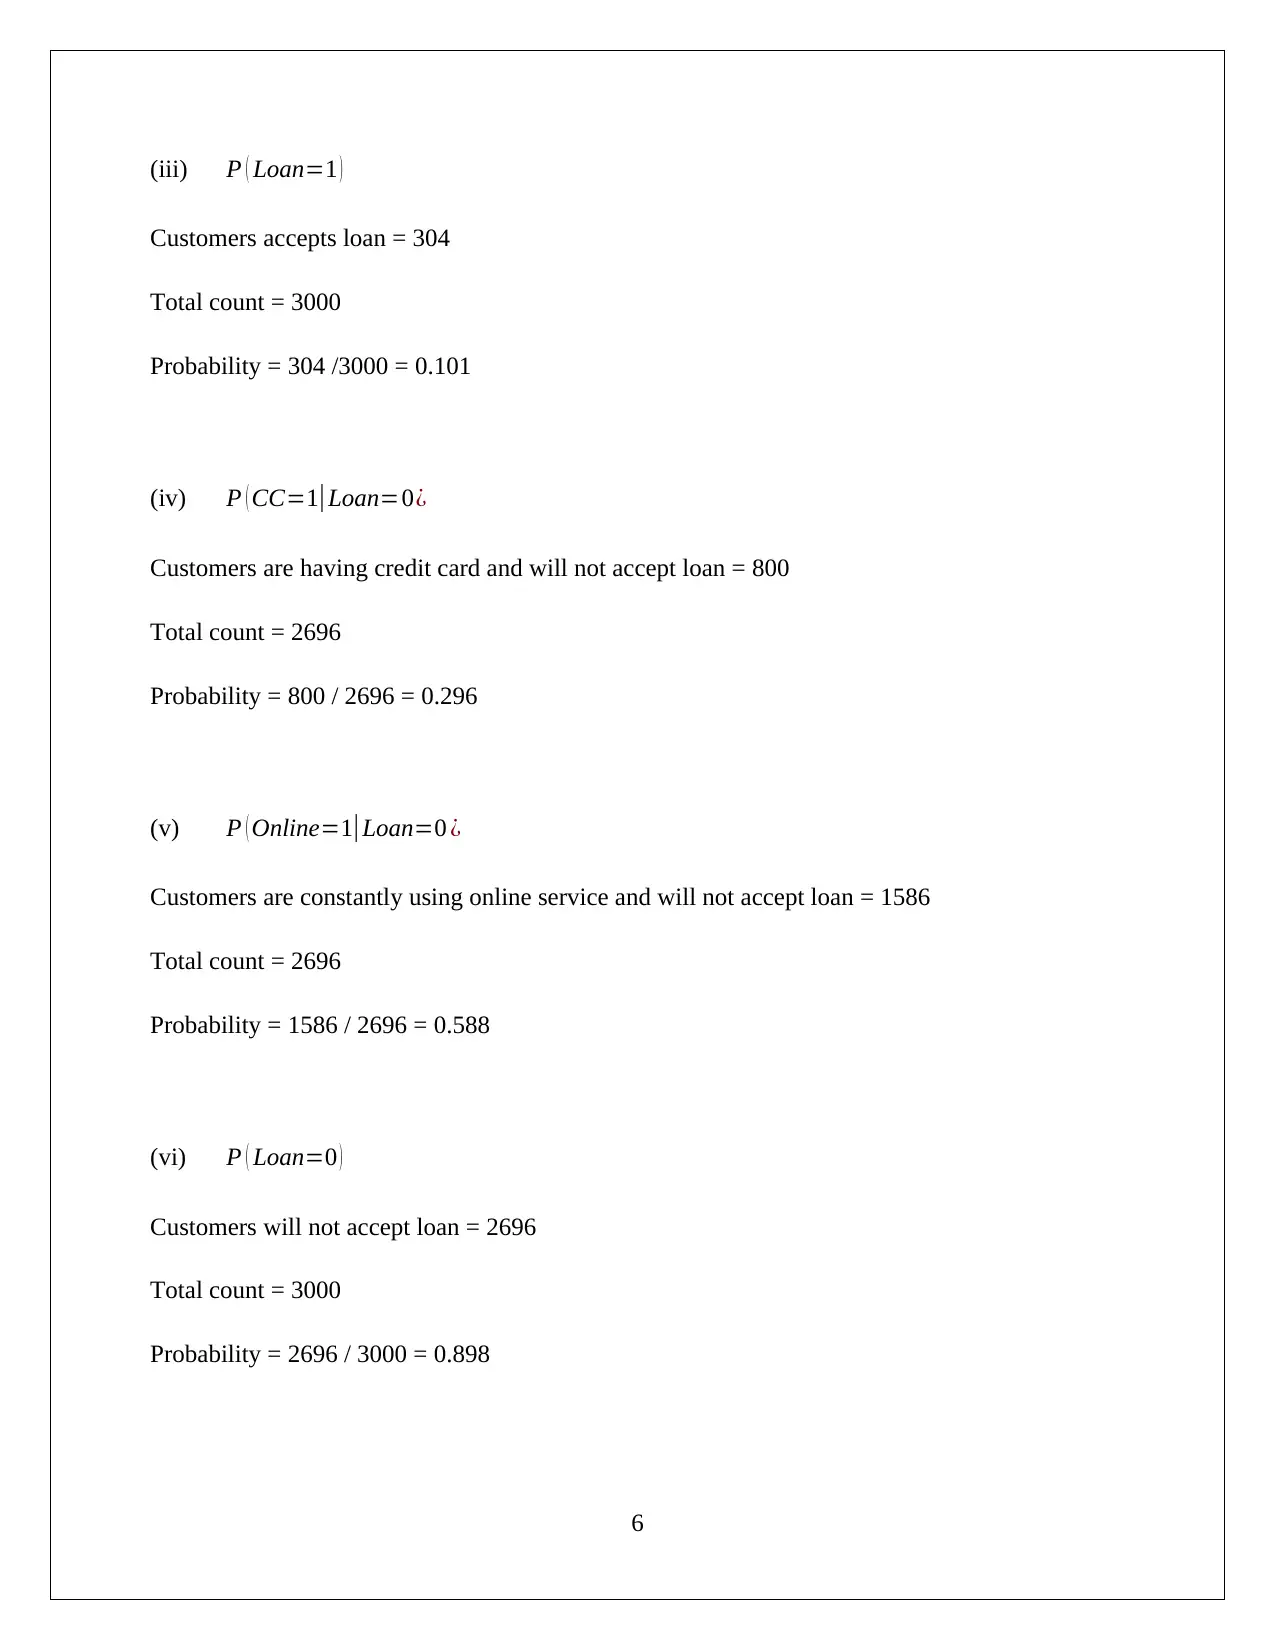
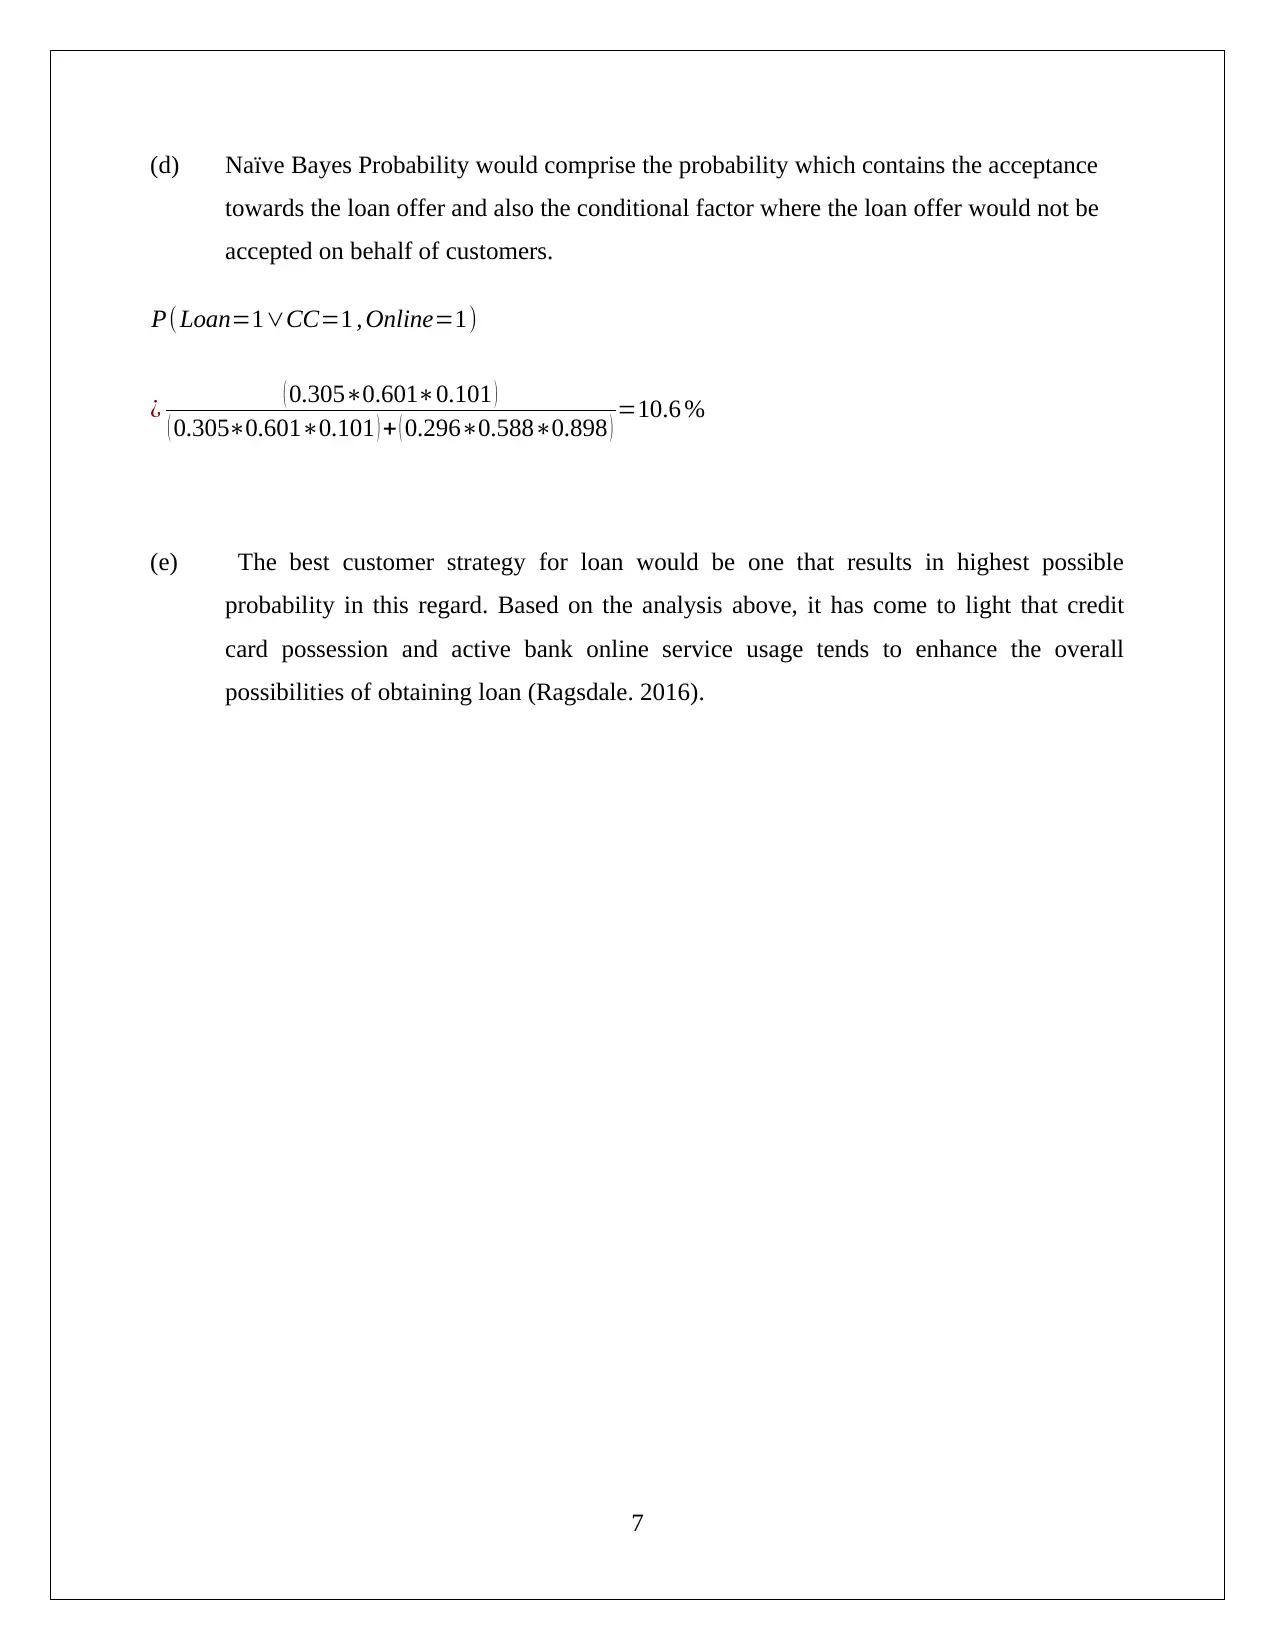
This assignment solution delves into data mining and visualization techniques, focusing on XLMiner for analysis. It begins with an interpretation of PCA output, including variance and principal component matrices, and discusses data normalization. The solution then explores the advantages and disadvantages of PCA. The second part of the assignment involves data partitioning using XLMiner on a dataset of 5000 customers, dividing it into training and validation sets. Pivot tables are used to calculate conditional probabilities related to customer behavior, such as credit card ownership, online service usage, and loan acceptance. Finally, the solution applies Naive Bayes probability to determine the best customer strategy for loan offers, concluding that credit card possession and active online banking usage increase loan acceptance probability. The solution is well-supported with references to relevant academic literature.
tabler-icon-diamond-filled.svg

Contribute Materials

Your contribution can guide someone’s learning journey. Share your documents today.
Document Page
Data Mining
Data Mining and Visualization
Assignment
Student id and Name
[Pick the date]
tabler-icon-diamond-filled.svg

Secure Best Marks with AI Grader

Need help grading? Try our AI Grader for instant feedback on your assignments.
Document Page
Question 1
(a)Output obtained from XL Miner (PCA)
Interpretation and Identification
Two critical aspects of the output are outlined below.
Variance Matrix – It highlights the contribution of each of the principal components to the total
variance. This is helpful and forms the basis of PCA whereby the higher variance would be
produced by the components that are considered the most critical from a statistical point of view.
For instance, PC1, PC2, PC3 and PC4 would be significant for the utilities data (Shumeli, Bruce,
& Patel, 2016).
Principal Component Matrix – This links the principal components with the features of
significance. With regards to each principal component, the underlying feature signiifance would
be outlined by the magnituede of the coefficient in the matrix. As an example, for PC4 , the two
most imperative factors would be x1 and x3 (Camm, et. al., 2016).
1
Document Page
Normalisation of Data
Usually data normalisation is required to prepare the data for PCA as the scales of representation
of the data tend to be different which leads to a unfair advantage to those variables which have a
high variance owing to the greater magnitude of the values. Scaling tends to nullify this
advantage. This is not required here as the variance contribution of any one princiapl component
does not exceed 28%. Further, output from normalised data in PCA also does not bring in
improvement which reflect non-requirement of data normalisation (John, 2014).
(b) Advantages of PCA
Effective data Sturcture determination technique
Dimensional reduction method: Reduce n-number data variables into fewer dimensional data
Max variance method: Maximize the variance of variables by removing the noise variable
(variable with low variance
Outcome is in orthogonal covariance matrix form and hence, suitable for understanding and
determination of magnitude (Ragsdale. 2016)
Disadvantages of PCA
Not suitable method to examine the real direction of principal component matrix because the
variables are positioned into the cloud space as a dot product and therefore, difficult to
examine.
Not appropriate method where the data also comprises categorical data
This method fails in demension redcution where the distribution of data is not supported
with mean and variance values.
The graphical result may get complex because all the principal components exhibit their
personal axis.
Not suitable when the variables with non- linear relationship will be taken into account
(Han, Pei & Kamber, 2011).
2
Document Page
Question 2
(a)
XLMiner is a powerful data mining tool which is applied here to create the partition of the data
of 5000 customers of universal bank (John, 2014). The data partition needs to be done in
following manners.
Training set – 60%
Validation set - 40%
The outcome from XLMiner partition is shown below:
The training data (3000 customers) would be taken into account for the analysis and
computation.
Pivot table
3
tabler-icon-diamond-filled.svg

Secure Best Marks with AI Grader

Need help grading? Try our AI Grader for instant feedback on your assignments.
Document Page
Notations
Customer does not hold credit card then CC = 0, If yes then CC = 1
Customer would not accept the offer of loan then Loan = 0, if yes then Loan = 1
Customer is not registered as active user of online service then Online = 0, If yes then Online = 1
(b) The requisite conditional probability would be determined as shown below:
Total count of customers which hold credit card, accept loan and also registered as active user of
online service = 51
Total count of customers which hold credit card, and also registered as active user of online
service = 522
Requisite conditional probability = 51 / 522 = 0.0977
(c) The requisite pivot tables are shown below:
4
Document Page
Probability calculations
(i) P ( CC=1|Loan=1 ¿
Customers having credit card and accept loan = 93
Total count = 304
Probability = 93 / 304 = 0.305
(ii) P ( Online=1|Loan=1 ¿
Customers are constantly using online service and accept loan = 183
Total count = 304
Probability = 183 / 304 = 0.601
5
Document Page
(iii) P ( Loan=1 )
Customers accepts loan = 304
Total count = 3000
Probability = 304 /3000 = 0.101
(iv) P ( CC=1|Loan=0¿
Customers are having credit card and will not accept loan = 800
Total count = 2696
Probability = 800 / 2696 = 0.296
(v) P ( Online=1|Loan=0 ¿
Customers are constantly using online service and will not accept loan = 1586
Total count = 2696
Probability = 1586 / 2696 = 0.588
(vi) P ( Loan=0 )
Customers will not accept loan = 2696
Total count = 3000
Probability = 2696 / 3000 = 0.898
6
tabler-icon-diamond-filled.svg

Paraphrase This Document

Need a fresh take? Get an instant paraphrase of this document with our AI Paraphraser
Document Page
(d) Naïve Bayes Probability would comprise the probability which contains the acceptance
towards the loan offer and also the conditional factor where the loan offer would not be
accepted on behalf of customers.
P(Loan=1CC=1 , Online=1)
¿ ( 0.3050.6010.101 )
( 0.3050.6010.101 ) + ( 0.2960.5880.898 ) =10.6 %
(e) The best customer strategy for loan would be one that results in highest possible
probability in this regard. Based on the analysis above, it has come to light that credit
card possession and active bank online service usage tends to enhance the overall
possibilities of obtaining loan (Ragsdale. 2016).
7
Document Page
Reference
Camm, D. J., Cochran, J. J., Fry, J.M., Ohlmann, W.J., Anderson, R.D. (2016) Essentials of
Business Analytics. (5th ed.). Sydney: Cengage Learning.
Han, J., Pei, J. & Kamber, M. (2011) Data Mining: Concepts and Technique (5th ed.). London:
Elsevier.
John, W. (2014) Encyclopaedia of Business Analytics and Optimization (2nd ed.). London: IGI
Global.
Ragsdale, C. (2016) Spread sheet Modelling & Decision Analysis: A Practical Introduction to
Business Analytics (3rd ed.). Sydney: Cengage Learning.
Shumeli, G., Bruce, C. P. & Patel, R. N. (2016) Data Mining for Business Analytics: Concepts
Techniques and Application with XLMiner (4th ed.). New York: John Wiley & Sons.
8
chevron_up_icon
1 out of 9
circle_padding
hide_on_mobile
zoom_out_icon
logo.png

Your All-in-One AI-Powered Toolkit for Academic Success.

Available 24*7 on WhatsApp / Email

[object Object]