Data Mining and Visualization Report - Data Analysis and PCA

Verified

Added on  2019/10/31

|10
|1167
|177
Report
AI Summary
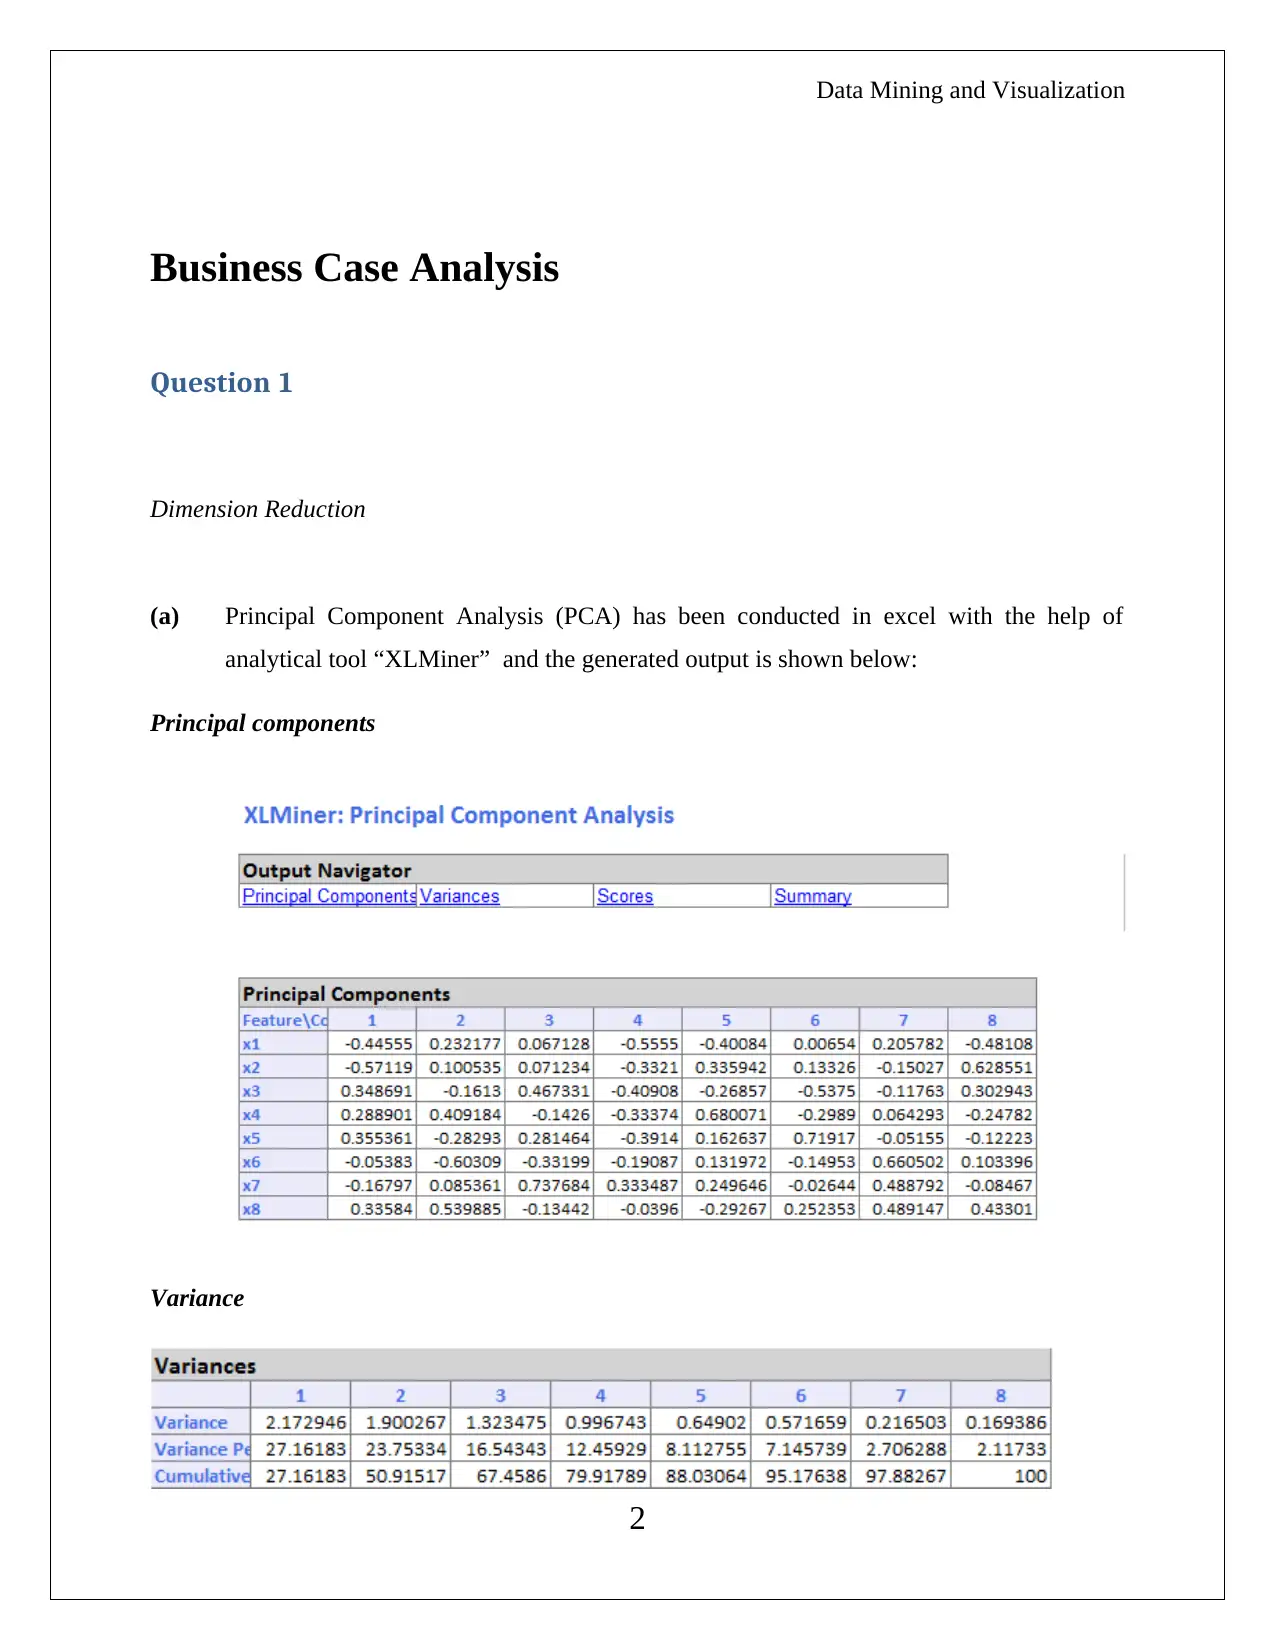
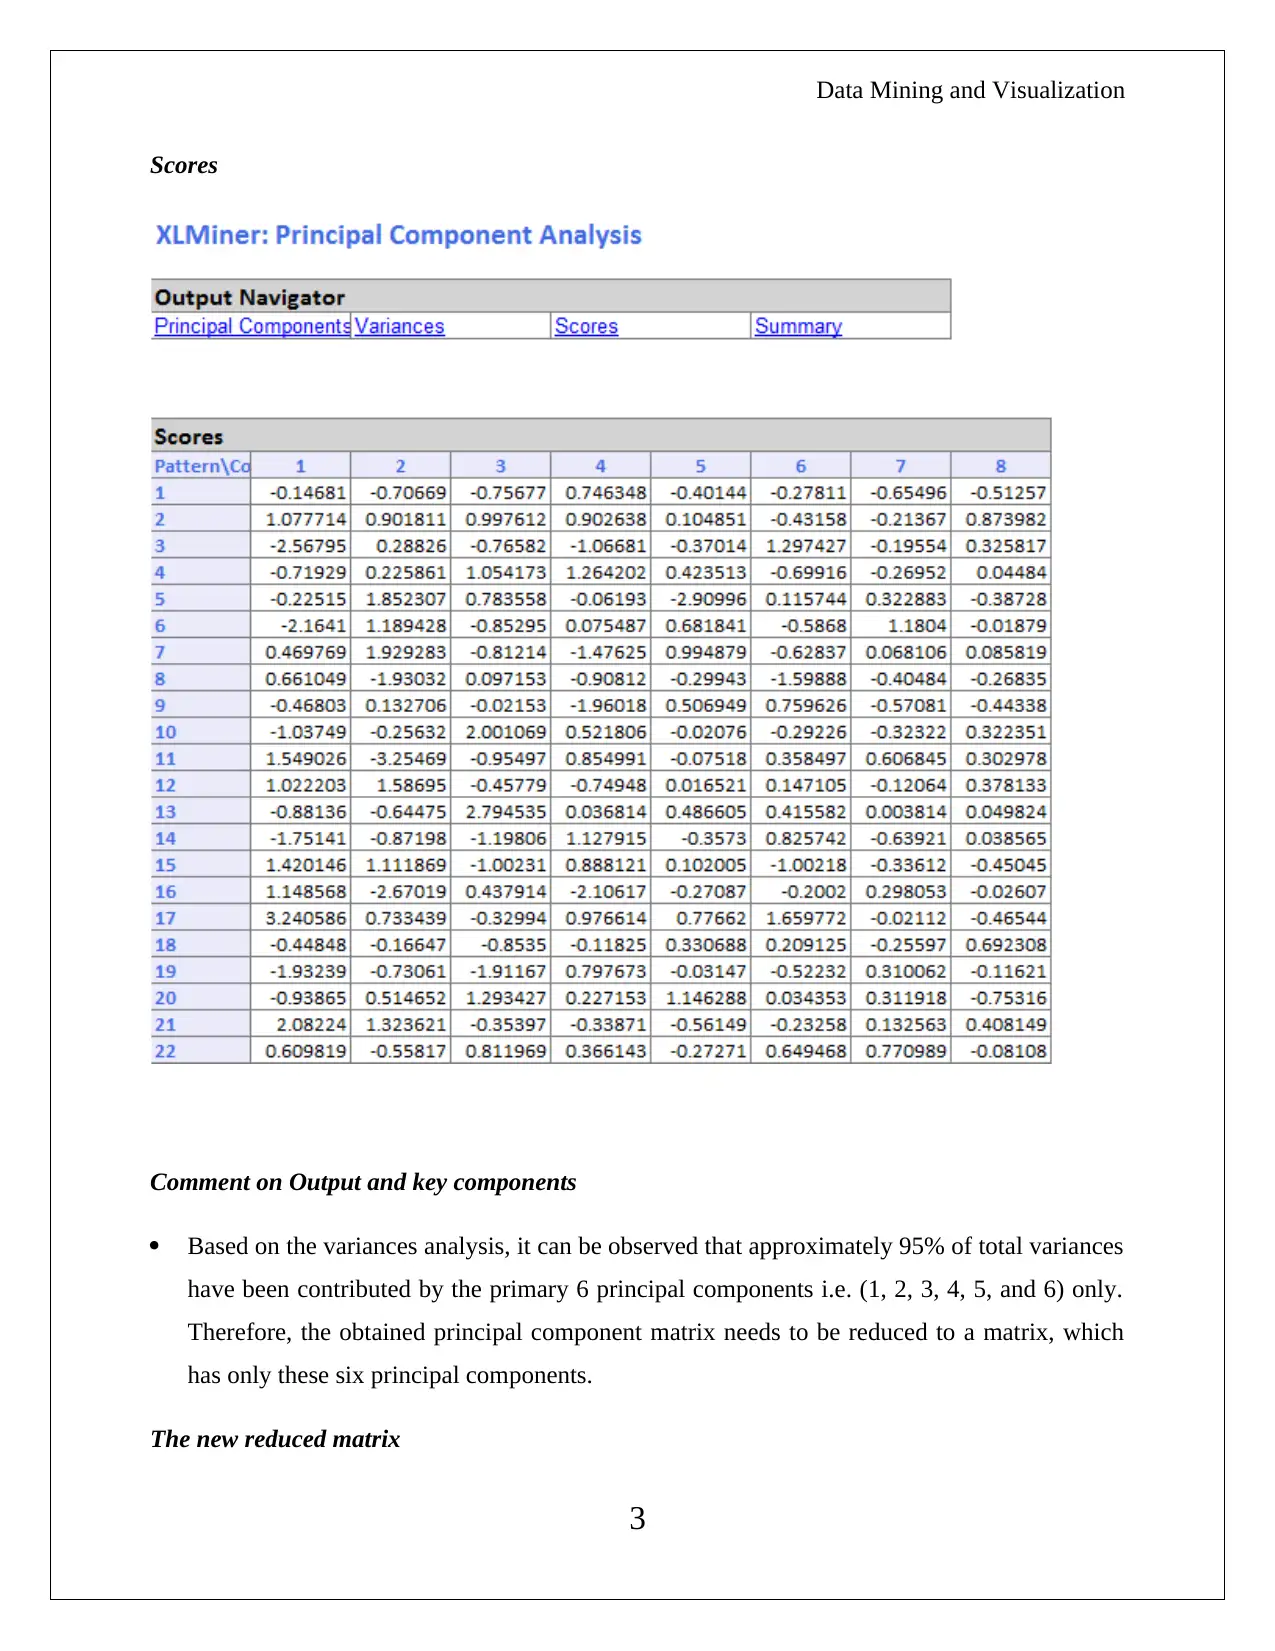
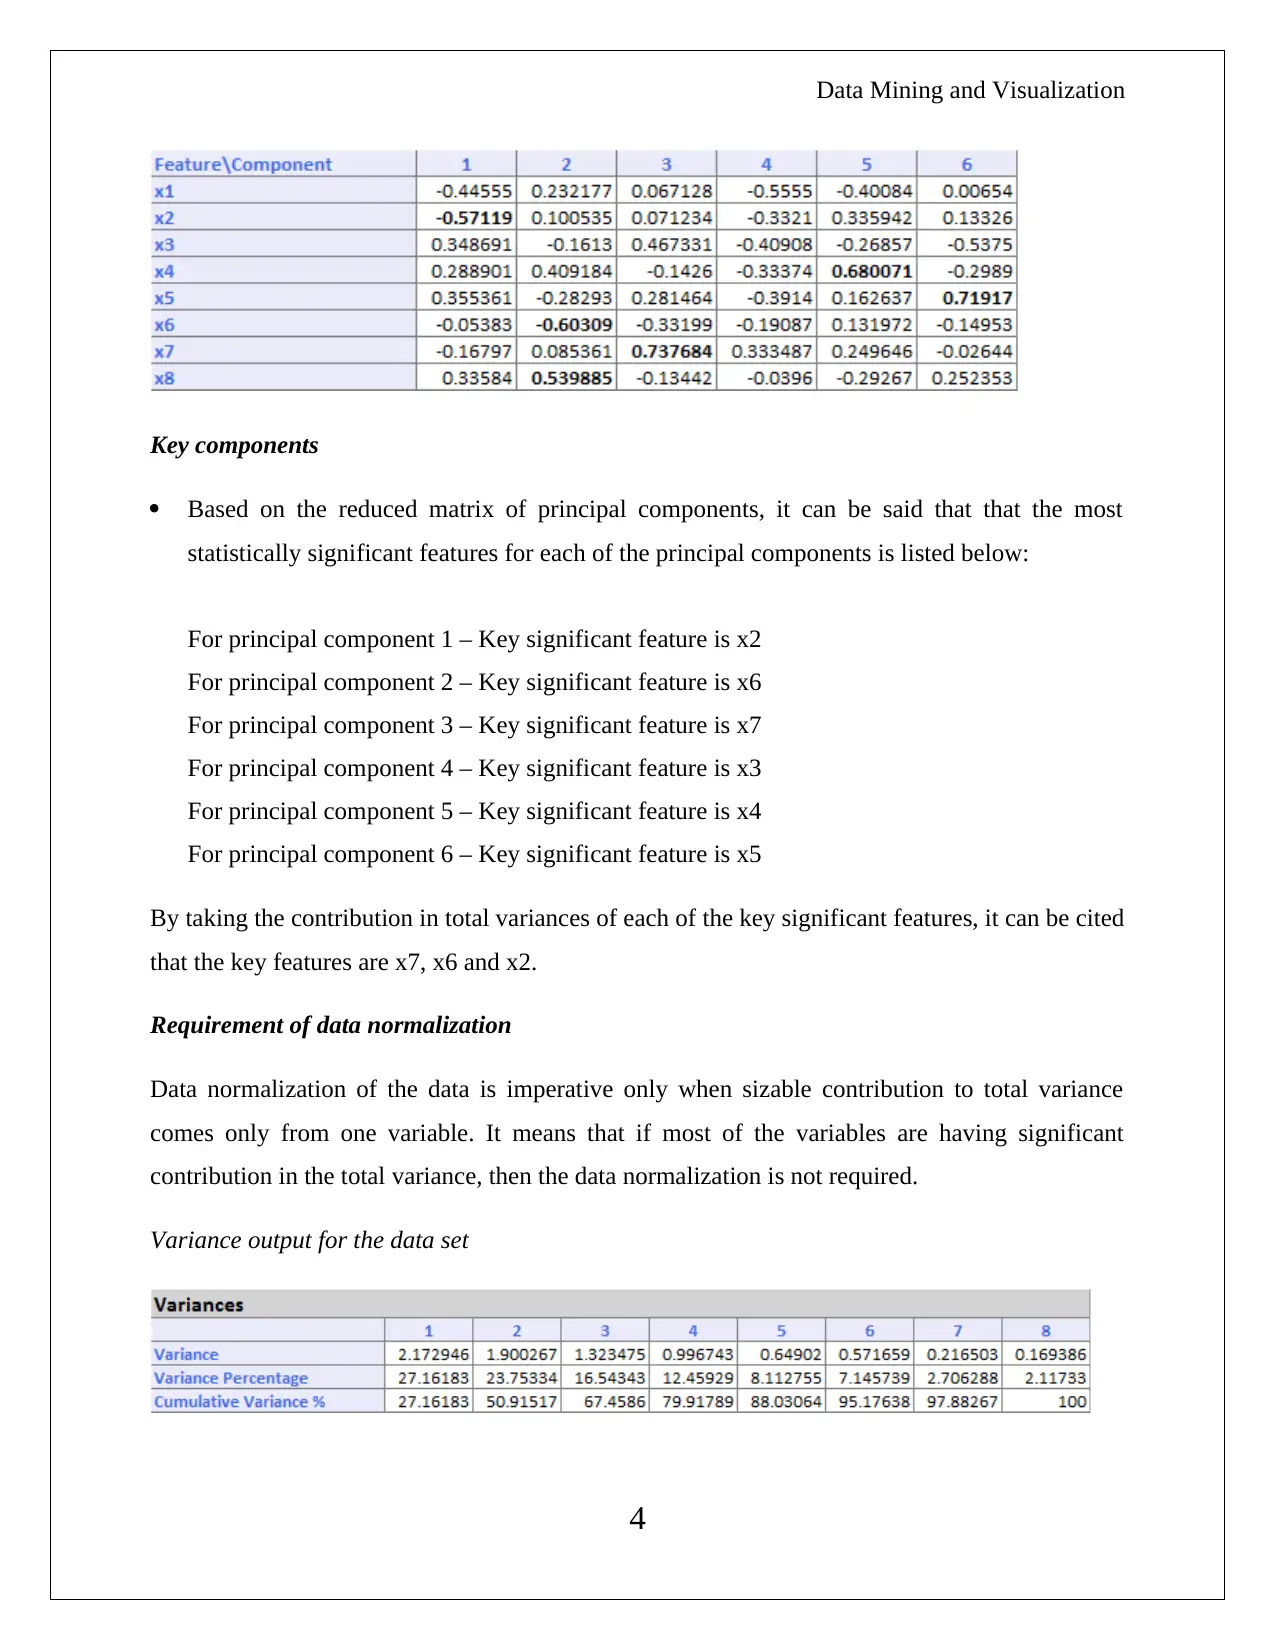
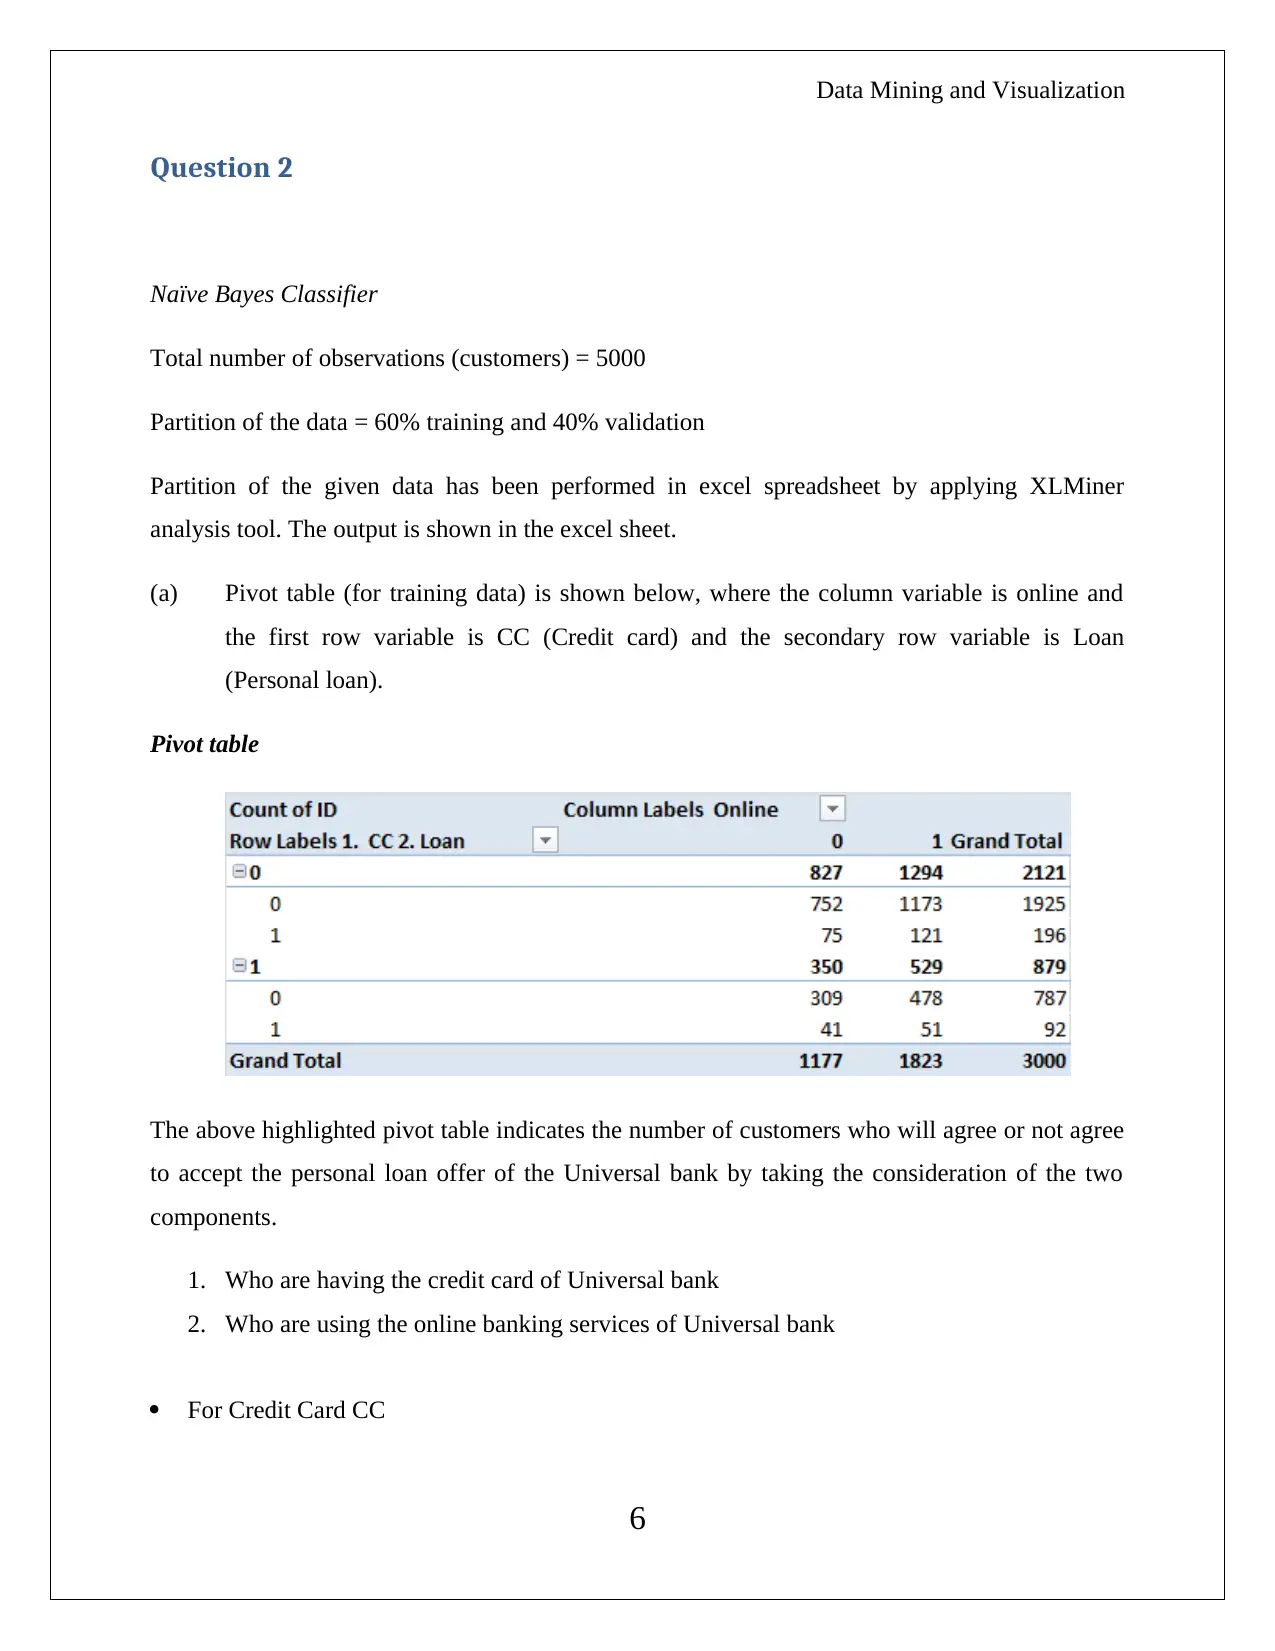
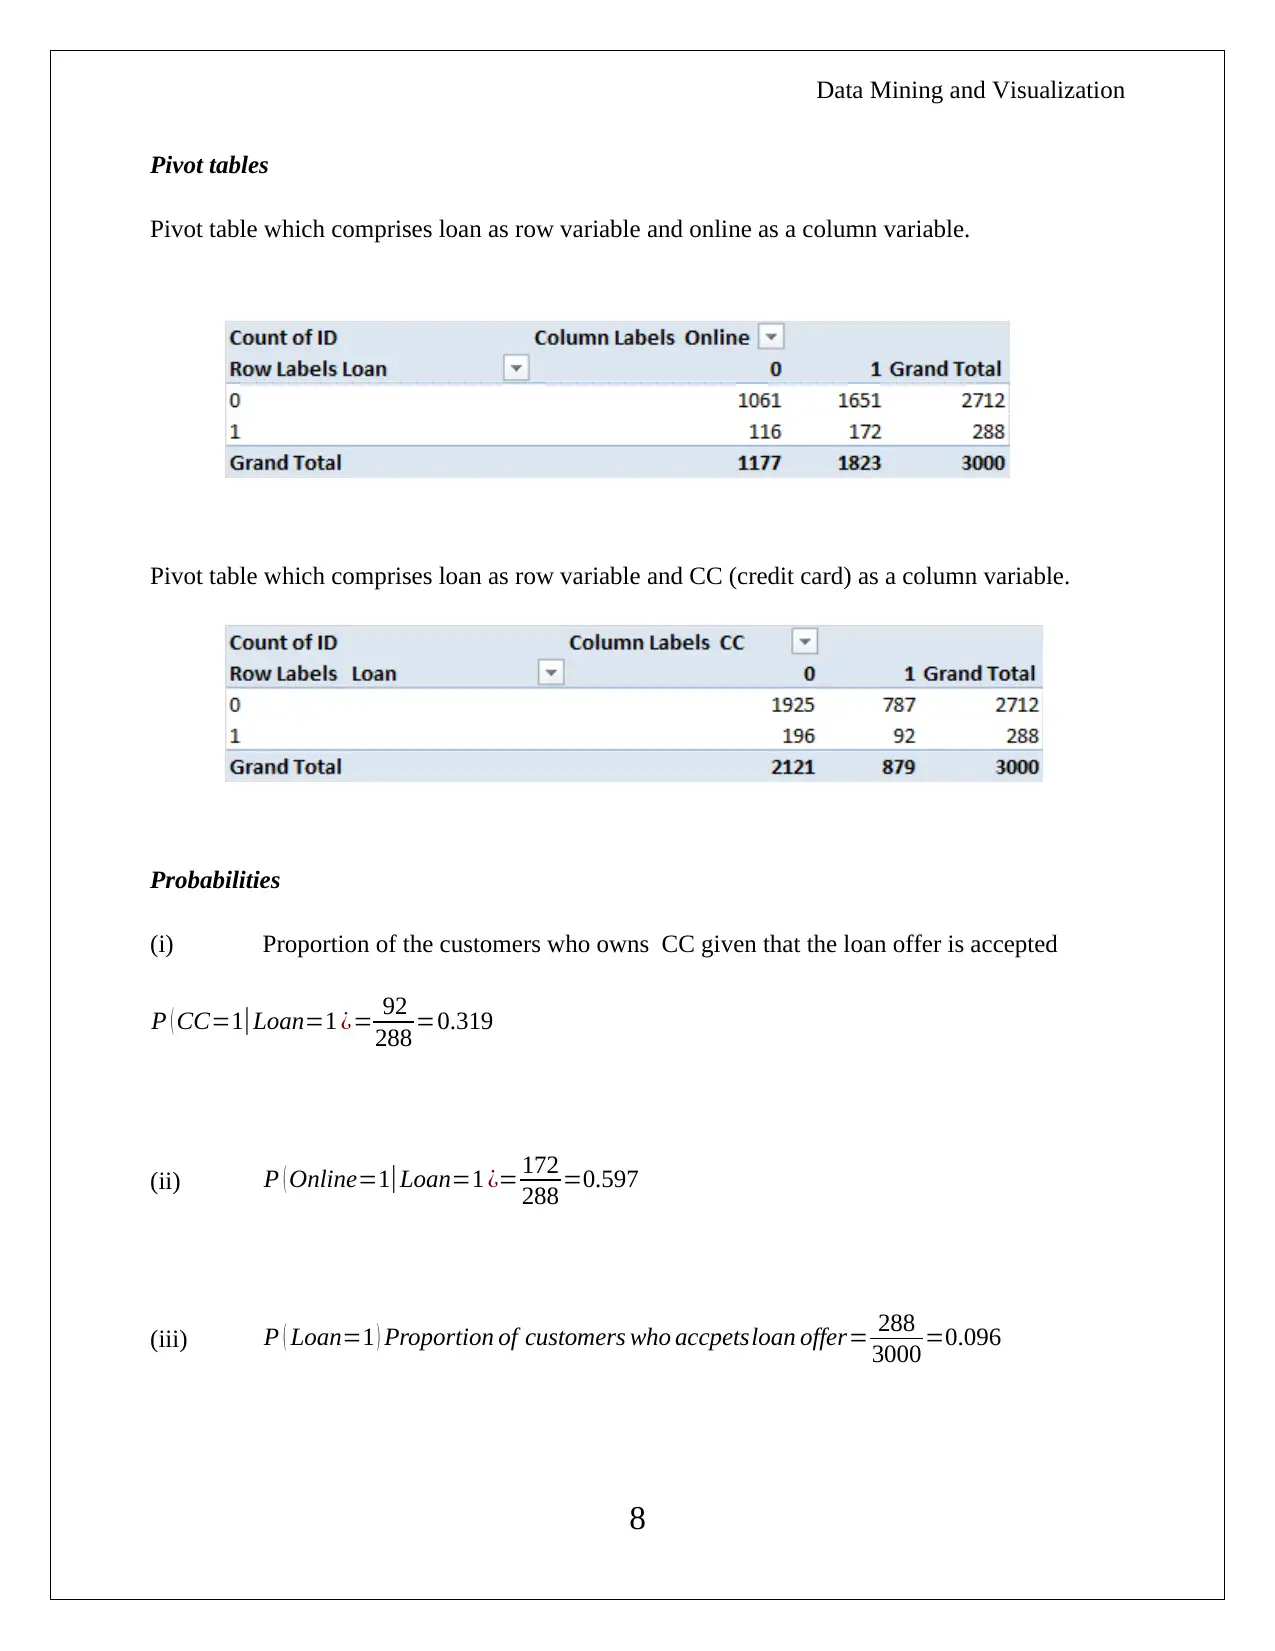
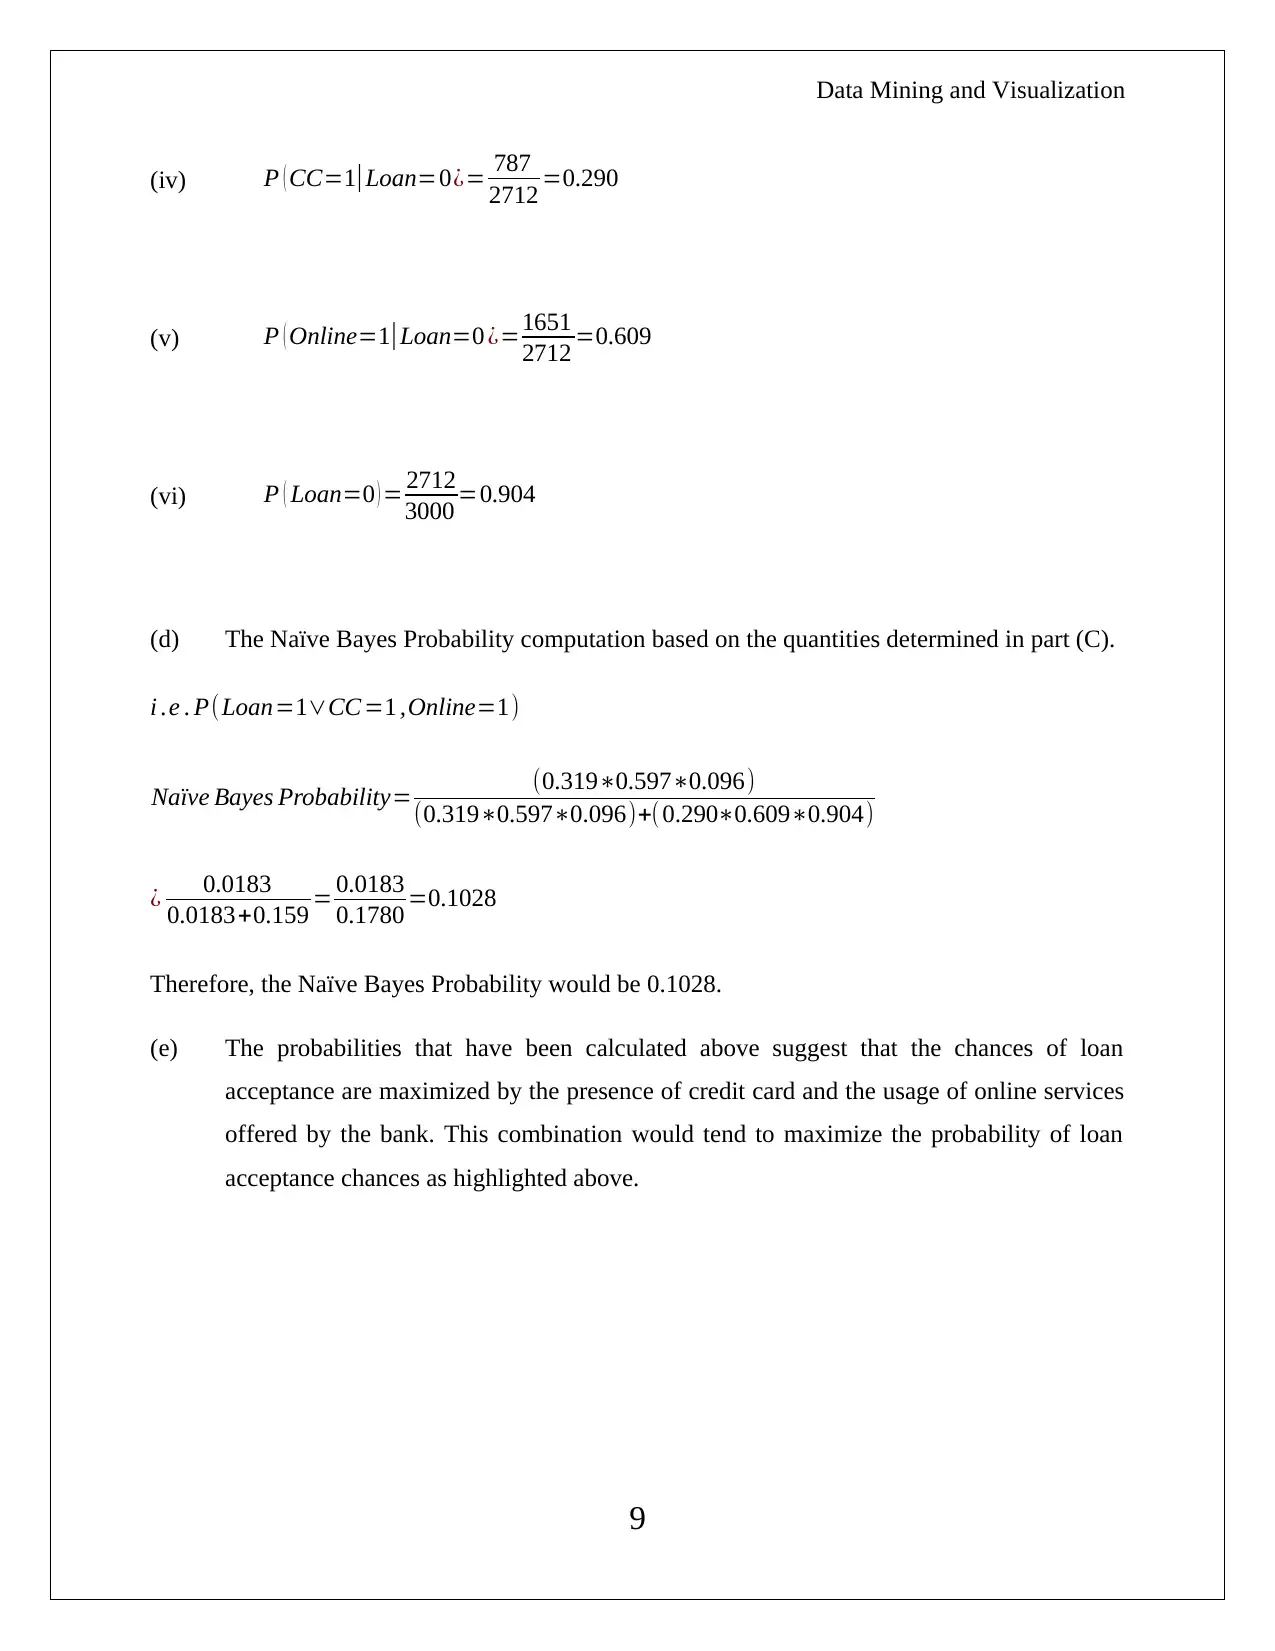
This report presents an analysis of data mining and visualization techniques, focusing on Principal Component Analysis (PCA) and Naive Bayes classification. The PCA section details variance analysis, identification of key components, and the necessity of data normalization. It discusses the advantages and disadvantages of PCA compared to other methods. The Naive Bayes section explores a business case involving customer data from a bank, including pivot tables, probability calculations, and analysis of customer behavior related to credit cards, online banking services, and loan acceptance. The report uses Excel and the XLMiner tool for data processing and analysis, providing insights into the probabilities of loan acceptance based on customer attributes. The analysis concludes with key findings on factors influencing loan acceptance.
Document Page
Data Mining and Visualization
Assessment Item – 2
STUDENT ID
[Pick the date]
tabler-icon-diamond-filled.svg

Paraphrase This Document

Need a fresh take? Get an instant paraphrase of this document with our AI Paraphraser
Document Page
Data Mining and Visualization
Table of Contents
Question 1.................................................................................................2
Question 2.................................................................................................6
1
Document Page
Data Mining and Visualization
Business Case Analysis
Question 1
Dimension Reduction
(a) Principal Component Analysis (PCA) has been conducted in excel with the help of
analytical tool “XLMiner” and the generated output is shown below:
Principal components
Variance
2
Document Page
Data Mining and Visualization
Scores
Comment on Output and key components
Based on the variances analysis, it can be observed that approximately 95% of total variances
have been contributed by the primary 6 principal components i.e. (1, 2, 3, 4, 5, and 6) only.
Therefore, the obtained principal component matrix needs to be reduced to a matrix, which
has only these six principal components.
The new reduced matrix
3
tabler-icon-diamond-filled.svg

Paraphrase This Document

Need a fresh take? Get an instant paraphrase of this document with our AI Paraphraser
Document Page
Data Mining and Visualization
Key components
Based on the reduced matrix of principal components, it can be said that that the most
statistically significant features for each of the principal components is listed below:
For principal component 1 – Key significant feature is x2
For principal component 2 – Key significant feature is x6
For principal component 3 – Key significant feature is x7
For principal component 4 – Key significant feature is x3
For principal component 5 – Key significant feature is x4
For principal component 6 – Key significant feature is x5
By taking the contribution in total variances of each of the key significant features, it can be cited
that the key features are x7, x6 and x2.
Requirement of data normalization
Data normalization of the data is imperative only when sizable contribution to total variance
comes only from one variable. It means that if most of the variables are having significant
contribution in the total variance, then the data normalization is not required.
Variance output for the data set
4
Document Page
Data Mining and Visualization
After analyzing the above variance table, it can be observed that maximum variances percentage
is shown by principal component 1 which is 27.16%. Also, it can be seen that the 27.16%
contribution in the total variance does not amount to sizable variance. This indicates that the
other variables are also having significant contribution in total variances. Therefore, the
condition of data normalization fails for the current utilities data and thus “data normalization is
not required.”
(b) Advantages and disadvantages of using PCA method over the other available methods.
Advantages
In PCA analysis, the provided data which is having numeric attributes can easily be
visualized as a “cloud of point in m- dimensional space” It can help to reduce large sized data into coordinate system with minimal dimensions The data set can be transformed into coordinate system Cloud points also have some variances in each of the possible direction and thus, the degree
of spread of the mean value would be determined in the same direction System is in orthogonal form and thus, it is easy to interpret because each axis would be at
the right angle to the other axis.
Disadvantages
Its algorithm provides the variance for all the variables but sometimes it is hard to find the
direction or say axis of the highest variance principal component.
The application of this technique is limited to Gaussian distributions and thus, cannot
employed for other distributions especially which typically are not captured by variance and
mean.
This is only suitable for the variables which shows linear combination with orthogonal
projections
It does not much useful for the data when it is applied for a blind source data set due to the
underlying algorithm and dependence on maximizing variance.
5
Document Page
Data Mining and Visualization
Question 2
Naïve Bayes Classifier
Total number of observations (customers) = 5000
Partition of the data = 60% training and 40% validation
Partition of the given data has been performed in excel spreadsheet by applying XLMiner
analysis tool. The output is shown in the excel sheet.
(a) Pivot table (for training data) is shown below, where the column variable is online and
the first row variable is CC (Credit card) and the secondary row variable is Loan
(Personal loan).
Pivot table
The above highlighted pivot table indicates the number of customers who will agree or not agree
to accept the personal loan offer of the Universal bank by taking the consideration of the two
components.
1. Who are having the credit card of Universal bank
2. Who are using the online banking services of Universal bank
For Credit Card CC
6
tabler-icon-diamond-filled.svg

Paraphrase This Document

Need a fresh take? Get an instant paraphrase of this document with our AI Paraphraser
Document Page
Data Mining and Visualization
The symbol 0 (zero) indicates that the customer does not own the credit card of the bank and 1
(one) indicates that the customer owns the Universal Bank’s credit card.
For Personal Loan (Loan)
The symbol 0 (zero) indicates that the customer does not own the credit card of the bank and 1
(one) indicates that the customer owns the Universal Bank’s credit card.
For Online:
The symbol 0 (zero) indicates that the customer is not using the online banking services of the
bank and 1 (one) indicates that the customer is using the online net banking service of Universal
Bank.
Further, the various associations among these three variables are described in the pivot table. For
example: the probability or portion of customers who owns credit card but does not use online
service would ready to accept the personal loan offer or not would be determined from pivot
table.
(b) The probability that this customer who has using the online bank service of universal
bank and has also owned the credit card of bank would also accept the loan offer is
computed below:
From the pivot table show above, the favorable vent and total possible event would be
determined.
Total events (CC = 1 | Online = 1) = 529
Favorable event (CC=1 | Online =1 | Loan = 1) = 51
Probability ¿ Favorable event
Total event = 51
529 =0.0964
(c) Pivot tables and probabilities
7
Document Page
Data Mining and Visualization
Pivot tables
Pivot table which comprises loan as row variable and online as a column variable.
Pivot table which comprises loan as row variable and CC (credit card) as a column variable.
Probabilities
(i) Proportion of the customers who owns CC given that the loan offer is accepted
P ( CC=1|Loan=1 ¿= 92
288 =0.319
(ii) P ( Online=1|Loan=1 ¿= 172
288 =0.597
(iii) P ( Loan=1 ) Proportion of customers who accpetsloan offer= 288
3000 =0.096
8
Document Page
Data Mining and Visualization
(iv) P ( CC=1|Loan=0¿= 787
2712 =0.290
(v) P ( Online=1| Loan=0 ¿=1651
2712 =0.609
(vi) P ( Loan=0 ) = 2712
3000 =0.904
(d) The Naïve Bayes Probability computation based on the quantities determined in part (C).
i .e . P(Loan=1CC =1 ,Online=1)
Naïve Bayes Probability= (0.3190.5970.096)
(0.3190.5970.096)+( 0.2900.6090.904)
¿ 0.0183
0.0183+0.159 = 0.0183
0.1780 =0.1028
Therefore, the Naïve Bayes Probability would be 0.1028.
(e) The probabilities that have been calculated above suggest that the chances of loan
acceptance are maximized by the presence of credit card and the usage of online services
offered by the bank. This combination would tend to maximize the probability of loan
acceptance chances as highlighted above.
9
chevron_up_icon
1 out of 10
circle_padding
hide_on_mobile
zoom_out_icon
[object Object]