Data Mining and Visualization for Business Intelligence Project
VerifiedAdded on 2019/11/26
|10
|836
|72
Project
AI Summary
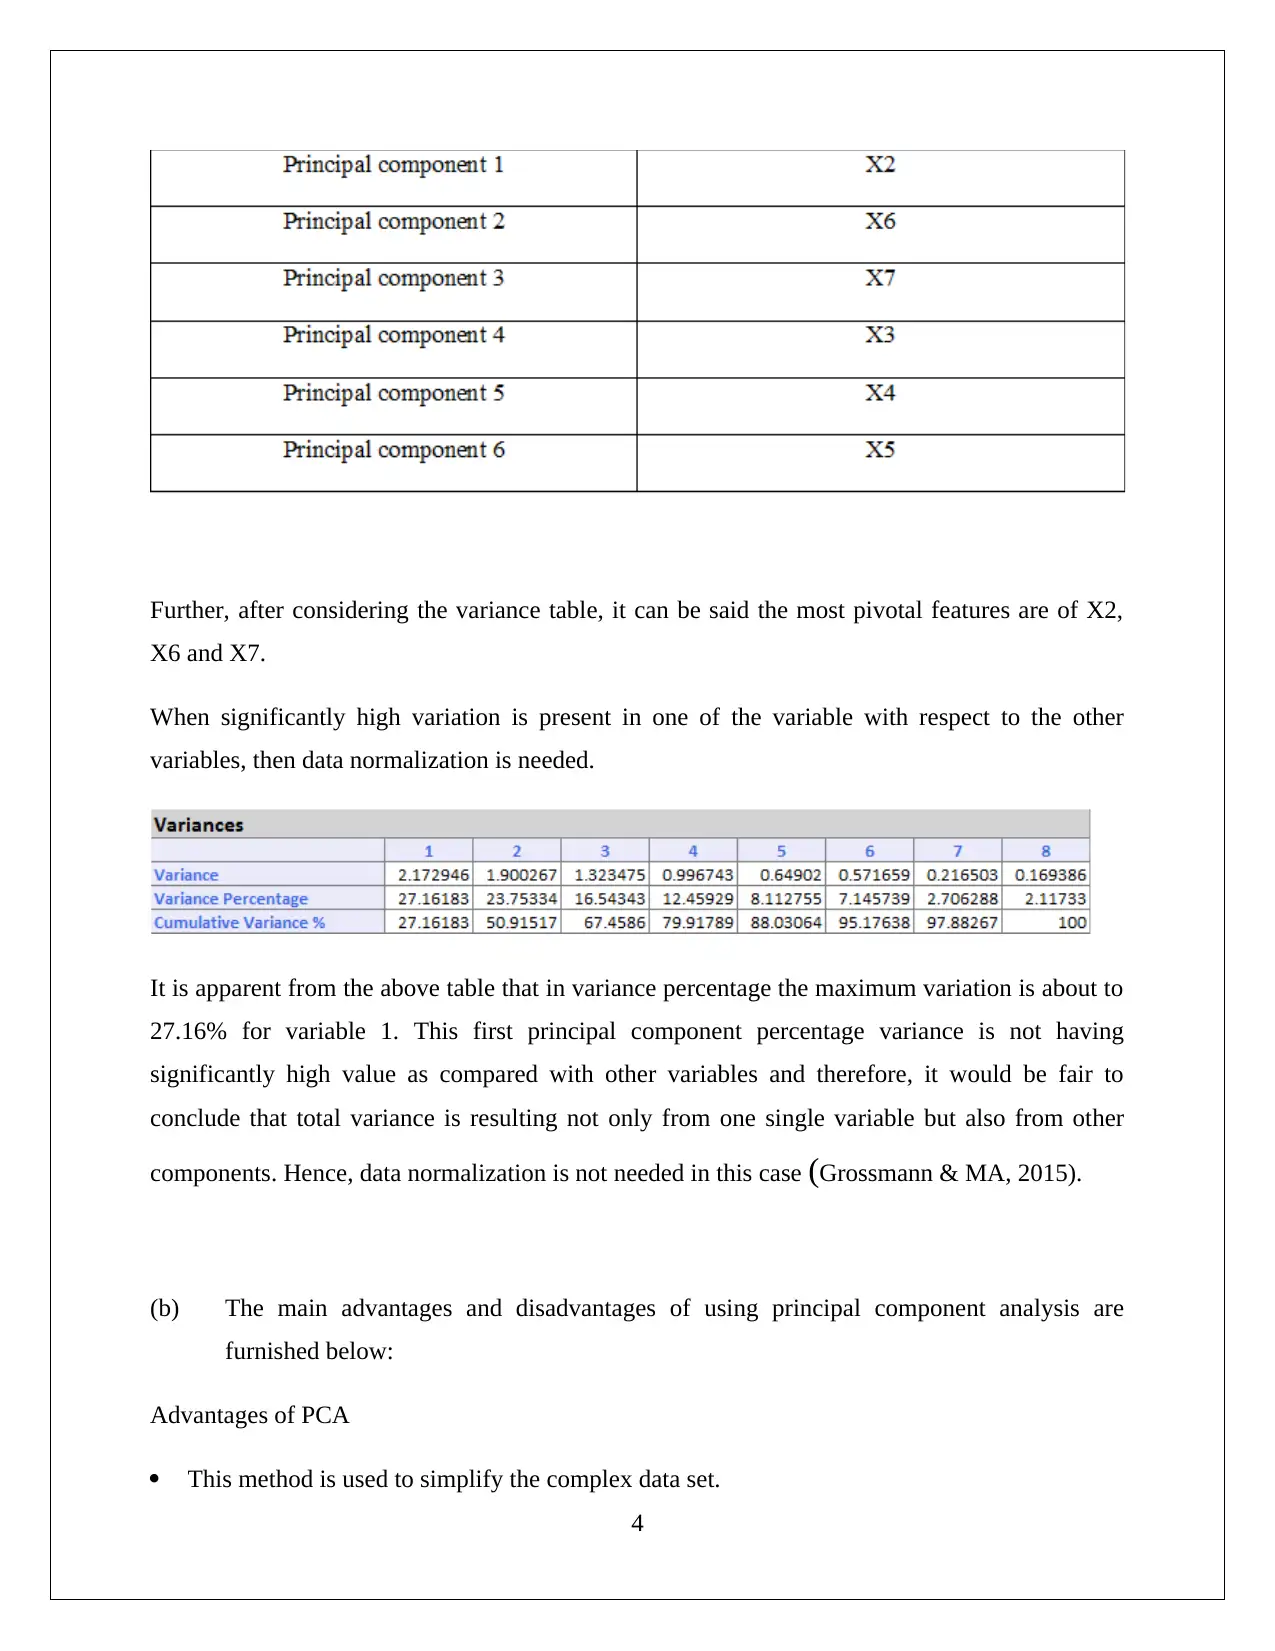
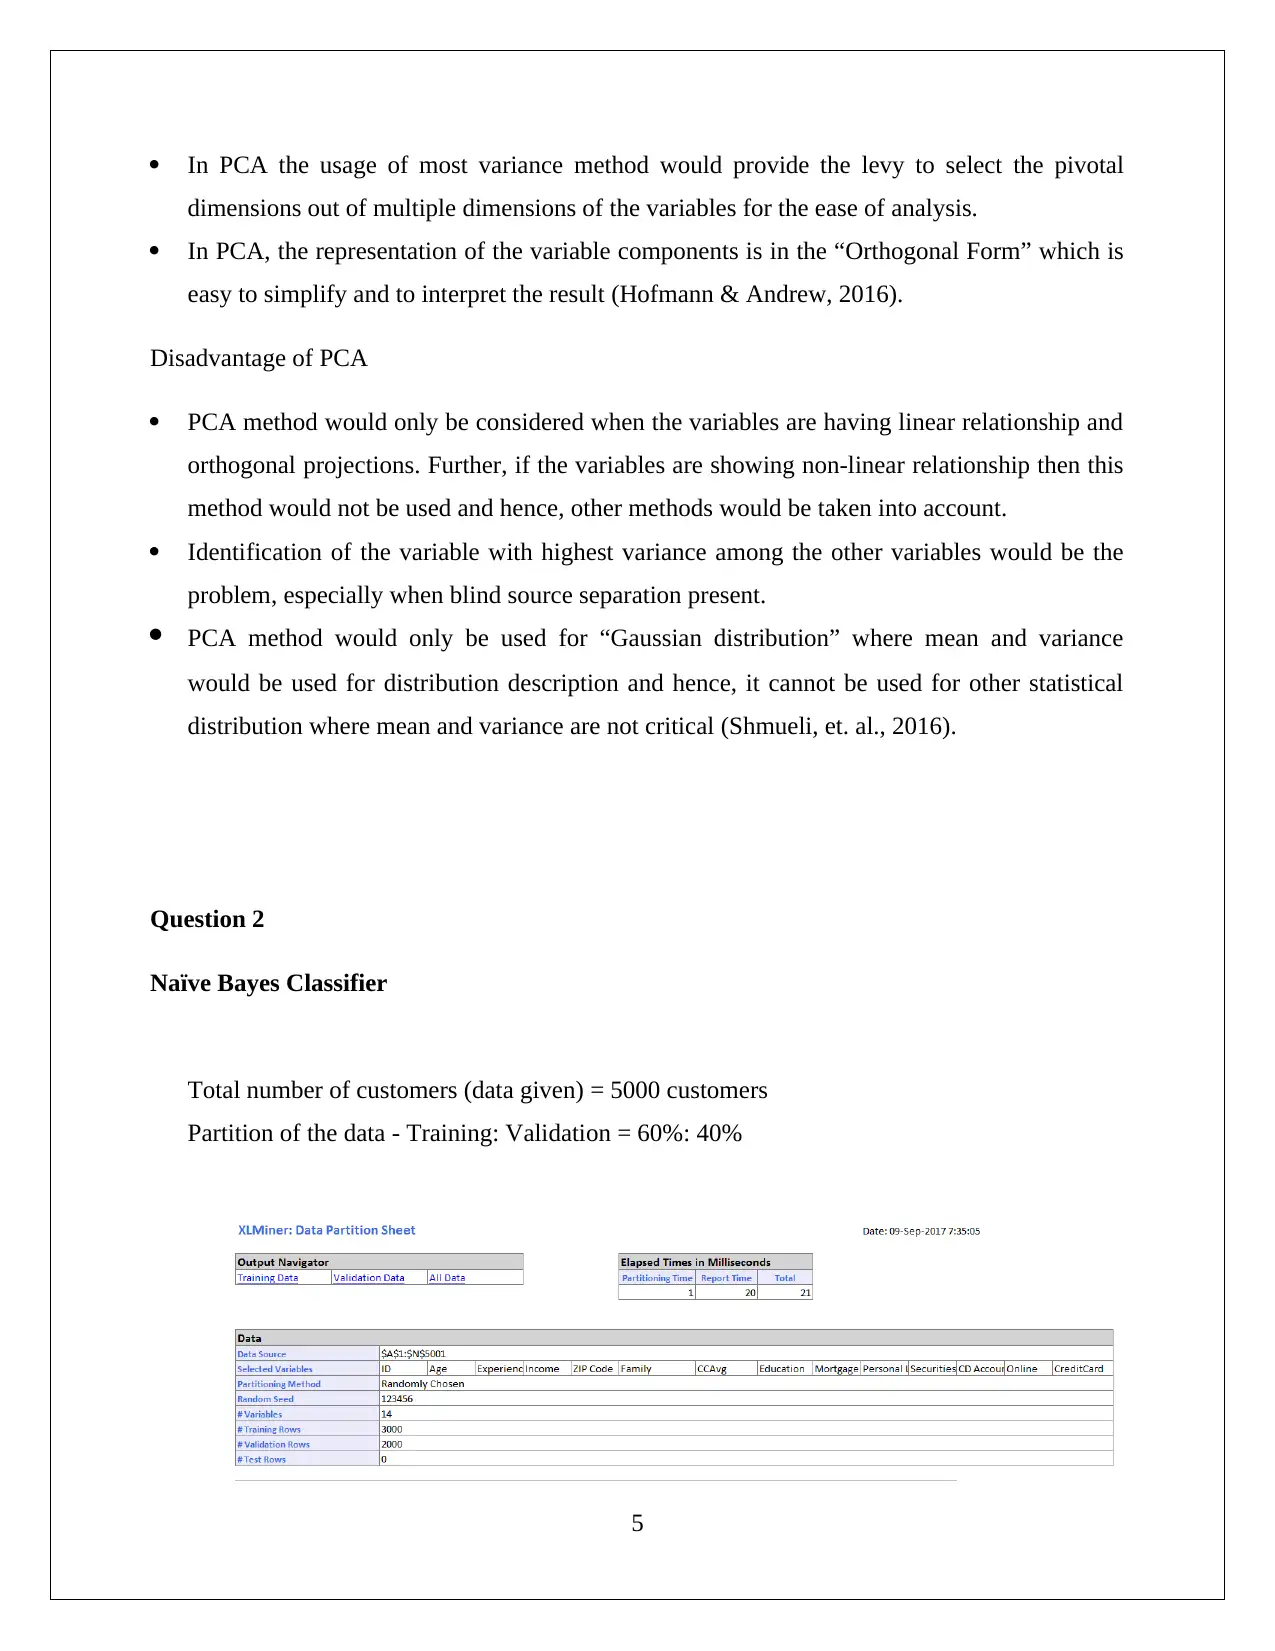
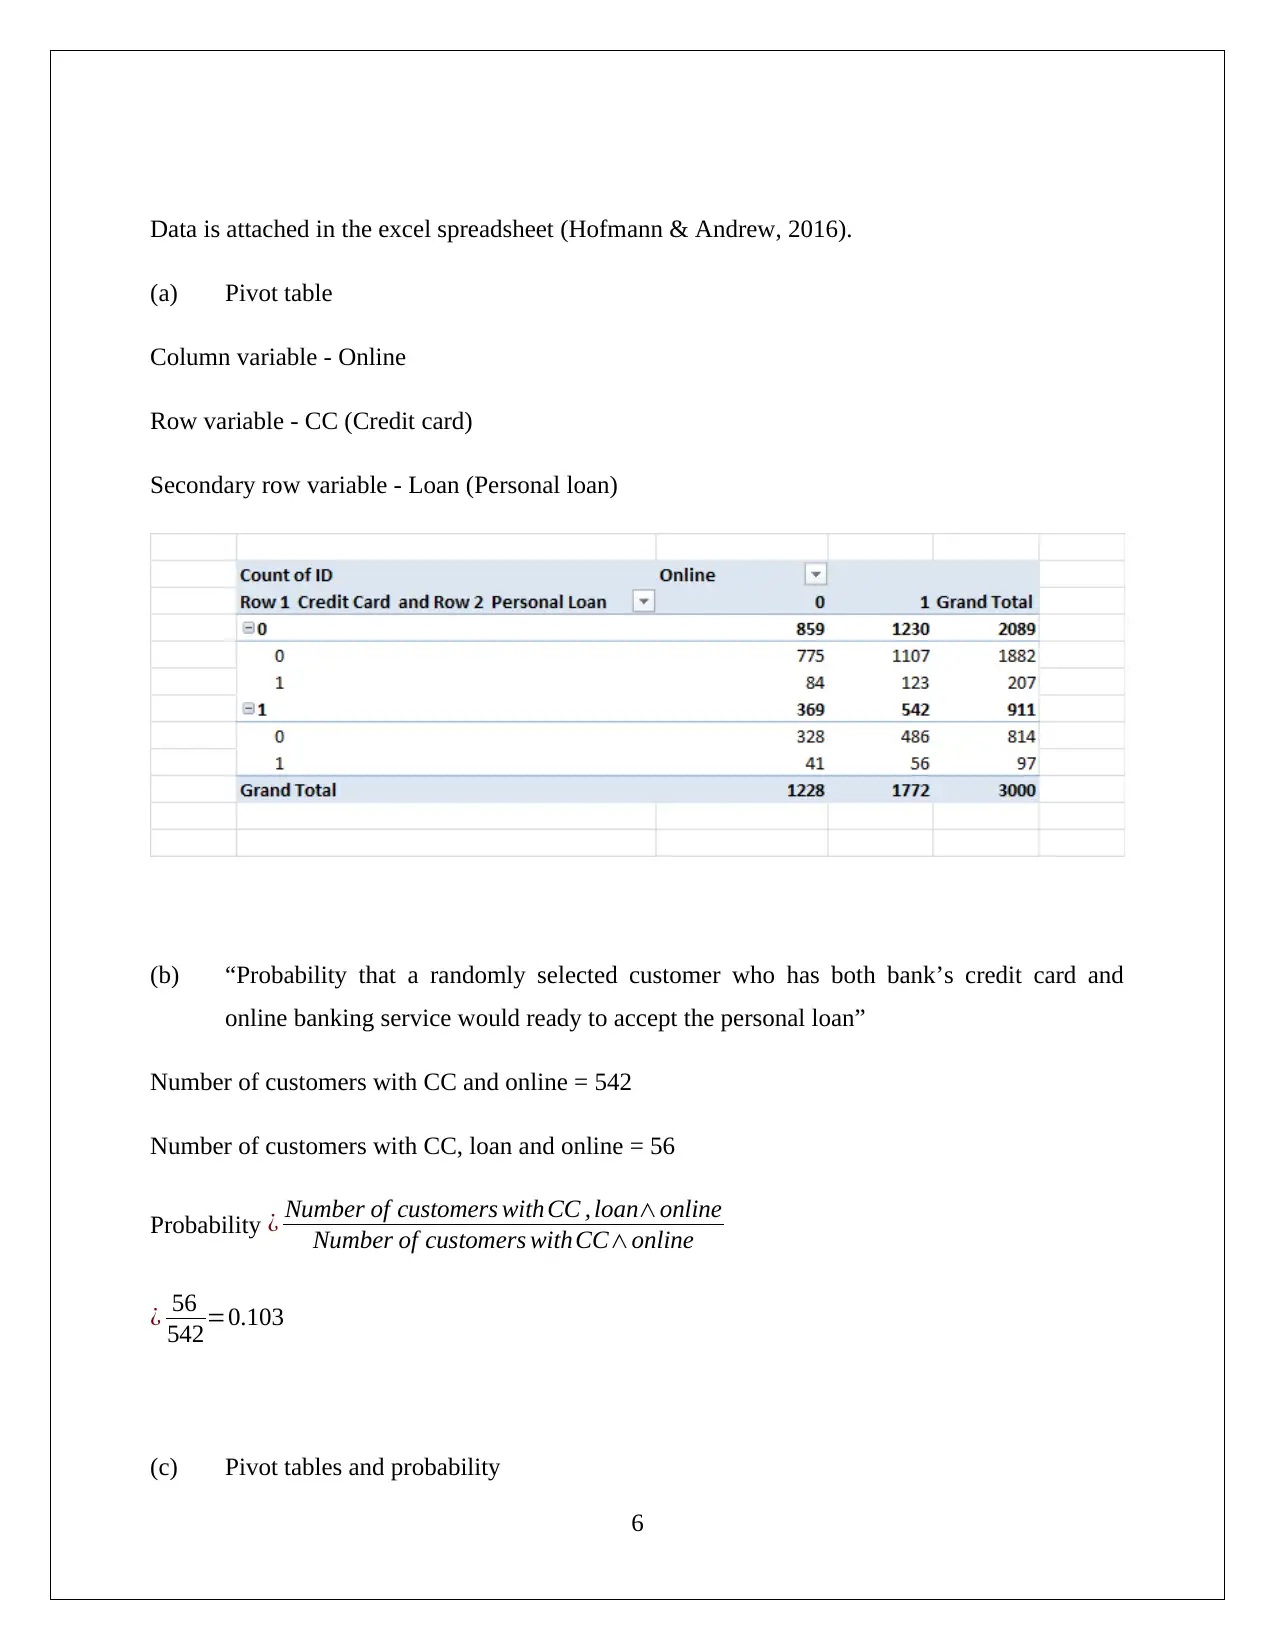
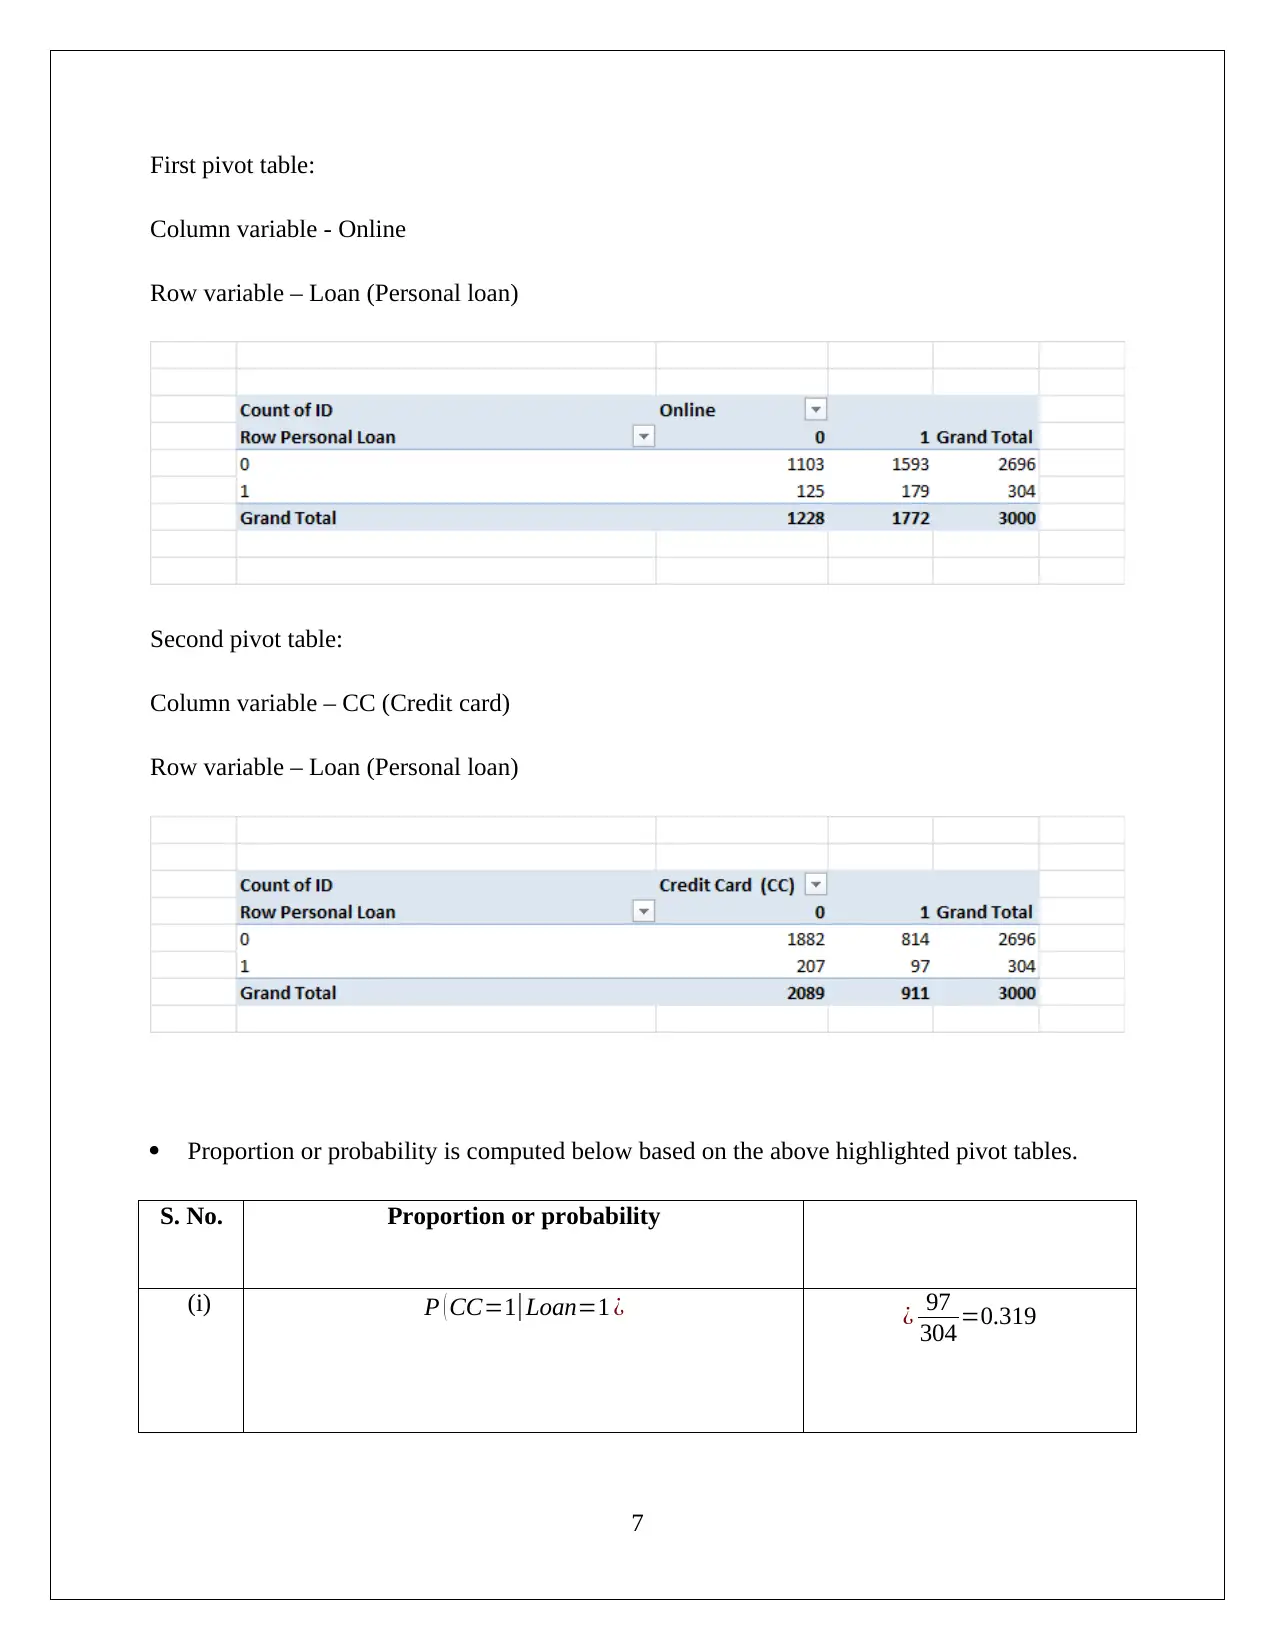
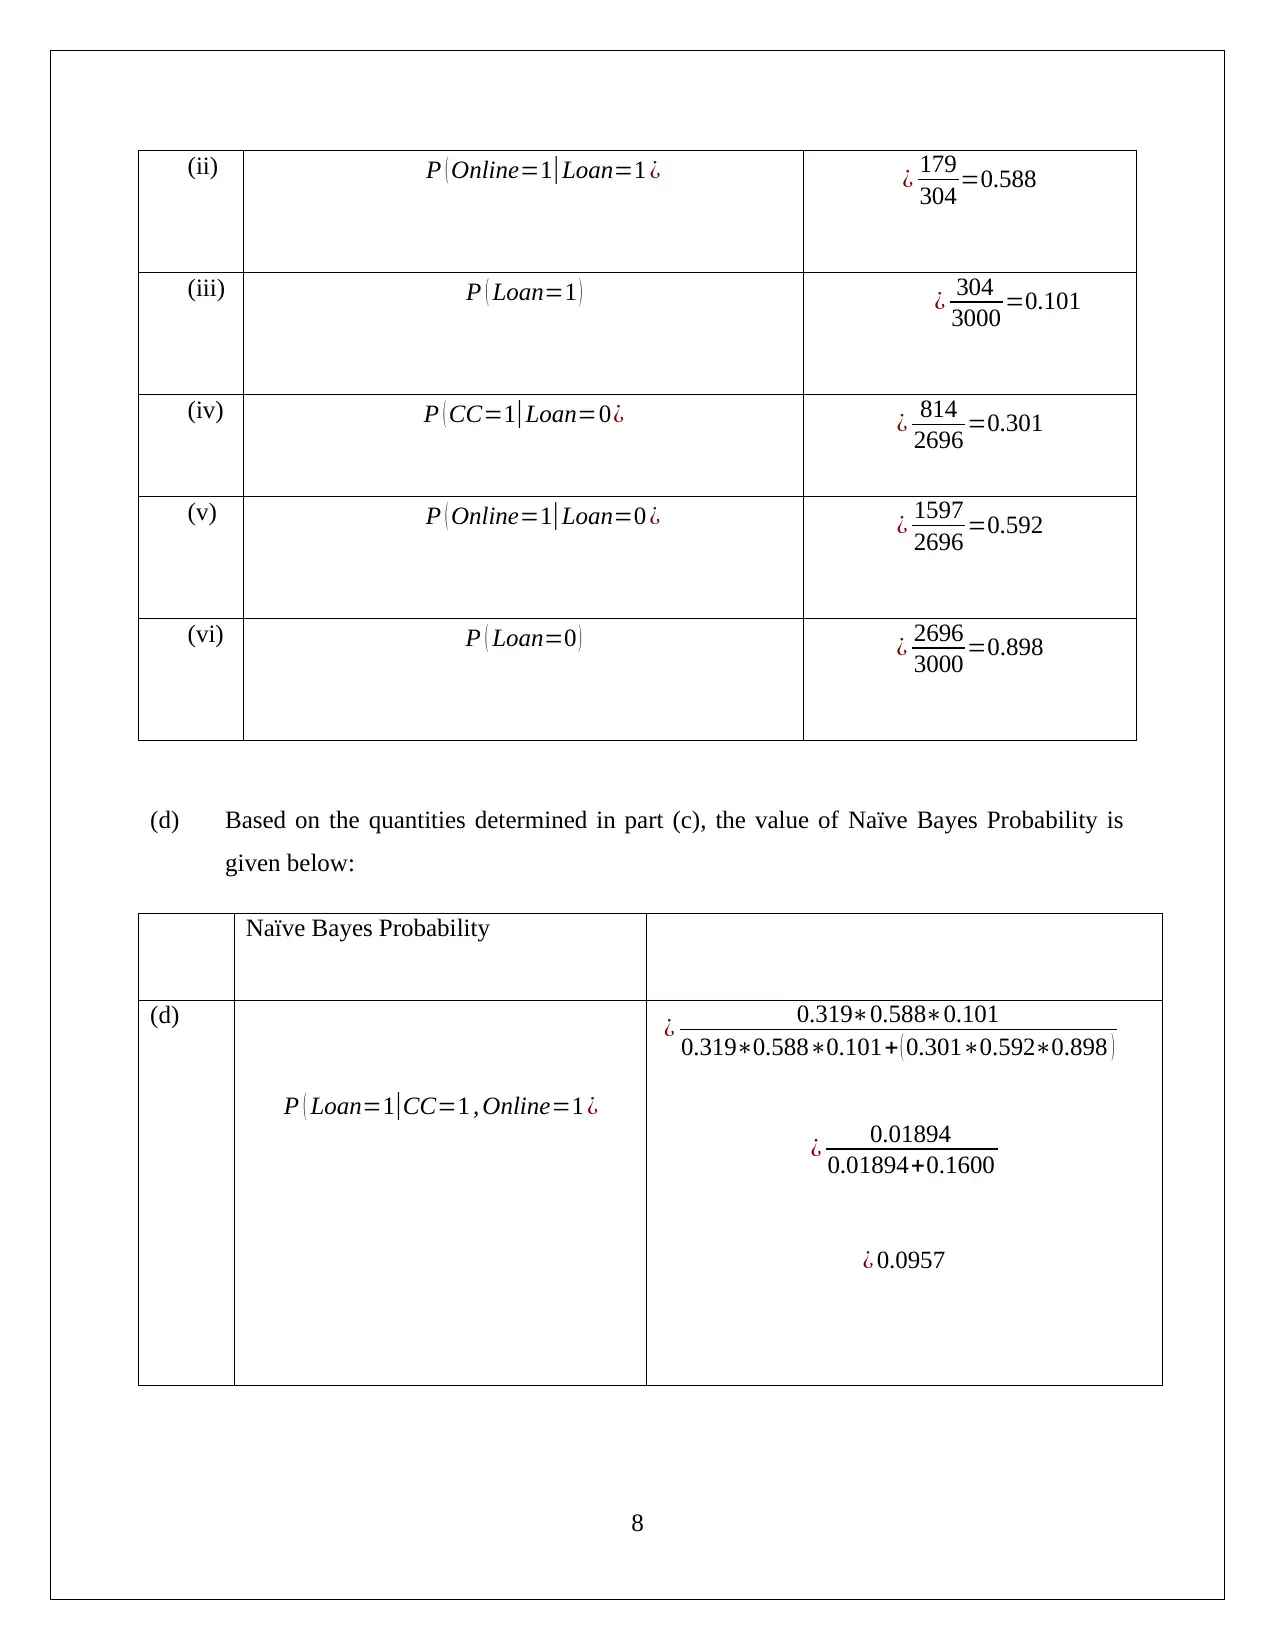
This data mining project analyzes a dataset using Principal Component Analysis (PCA) for dimension reduction and a Naive Bayes Classifier. The PCA section utilizes Excel and XLMiner to identify key variables, determine the need for data normalization, and discusses the advantages and disadvantages of the method. The Naive Bayes Classifier section focuses on a customer dataset, partitioning it for training and validation, and calculating probabilities using pivot tables to determine the best strategy for a bank customer to obtain a personal loan based on credit card usage and online banking services. The project includes references to relevant literature on business intelligence and data mining techniques.
1 out of 10
Related Documents

![Data Mining and Visualization Business Case Analysis Solution - [Date]](/_next/image/?url=https%3A%2F%2Fdesklib.com%2Fmedia%2Fimages%2Fa4c62573bfd04fc8a6d2208b43ae0344.jpg&w=256&q=75)


Your All-in-One AI-Powered Toolkit for Academic Success.
+13062052269
info@desklib.com
Available 24*7 on WhatsApp / Email
![[object Object]](/_next/static/media/star-bottom.7253800d.svg)
Copyright © 2020–2026 A2Z Services. All Rights Reserved. Developed and managed by ZUCOL.