Data Mining and Visualization for Business Intelligence Assignment 2

Verified

Added on  2020/04/07

|10
|1048
|94
Homework Assignment
AI Summary
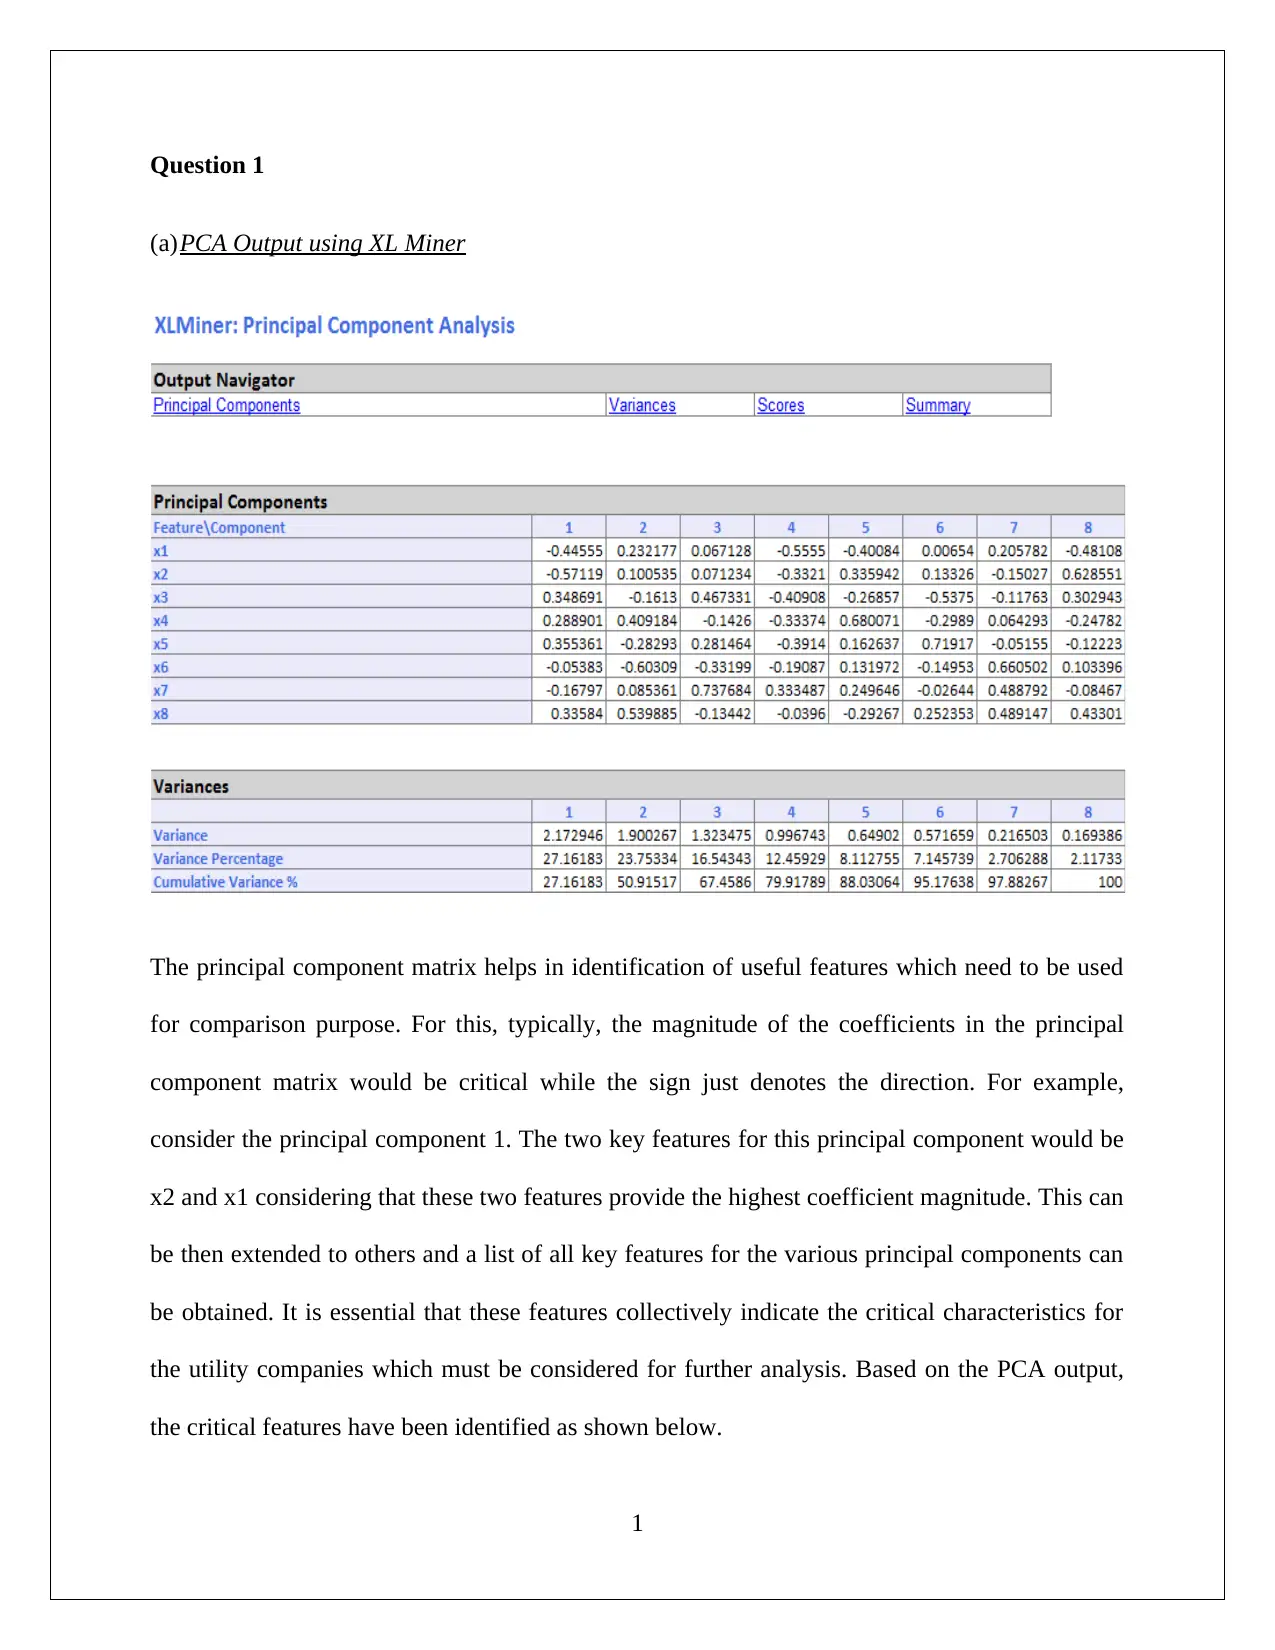
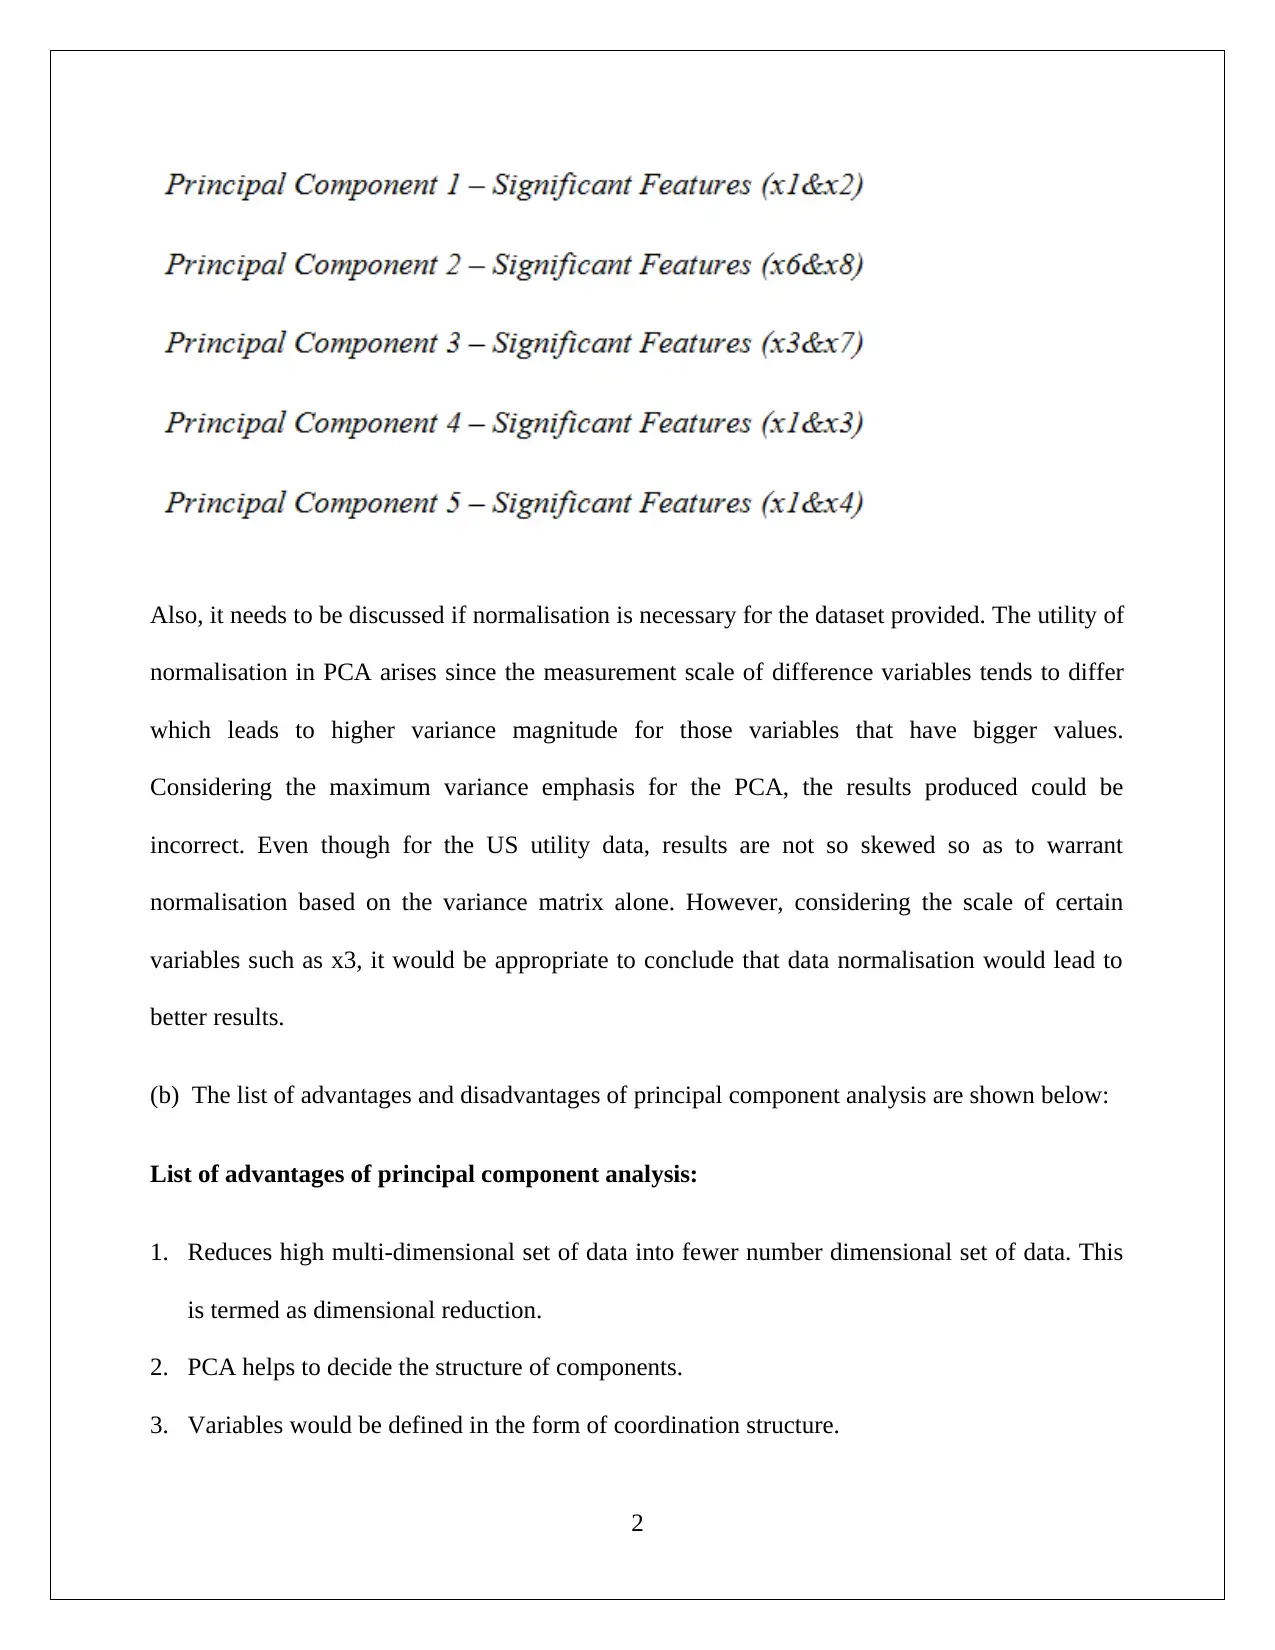
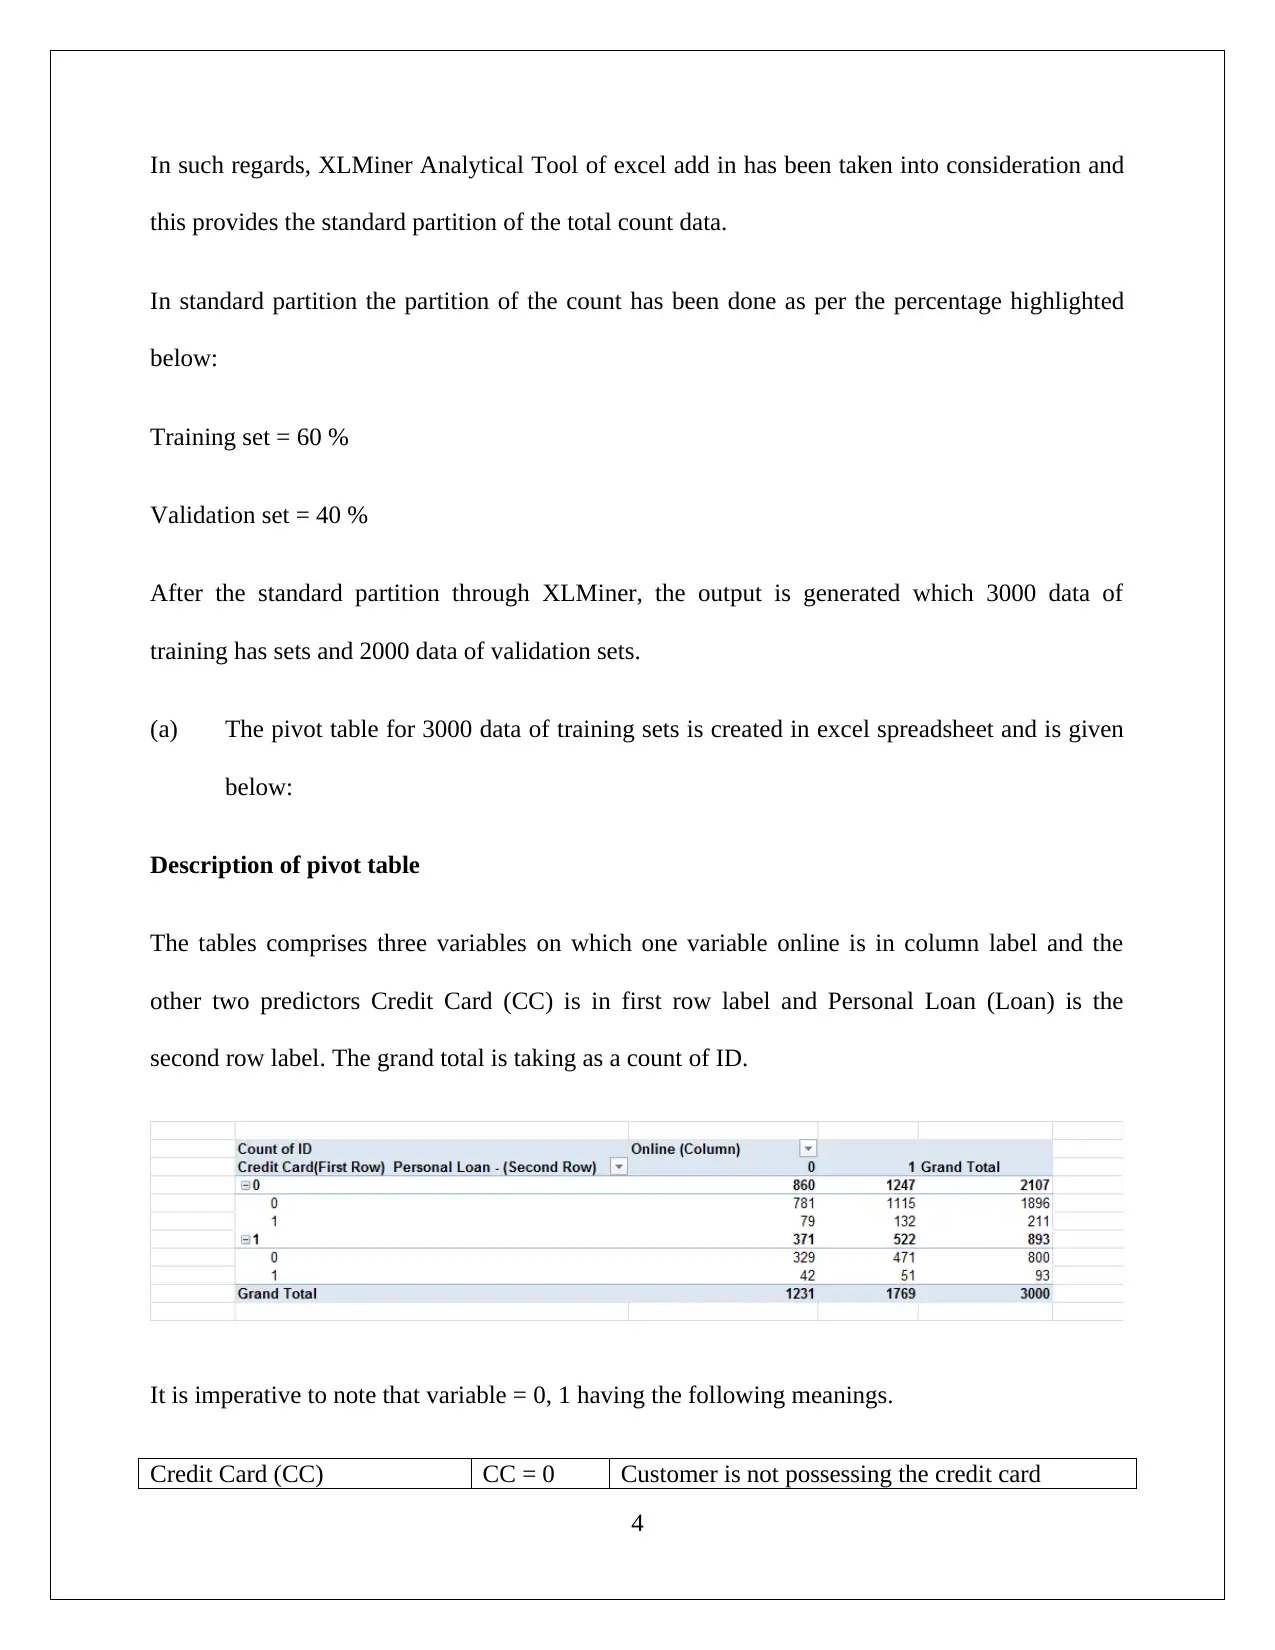
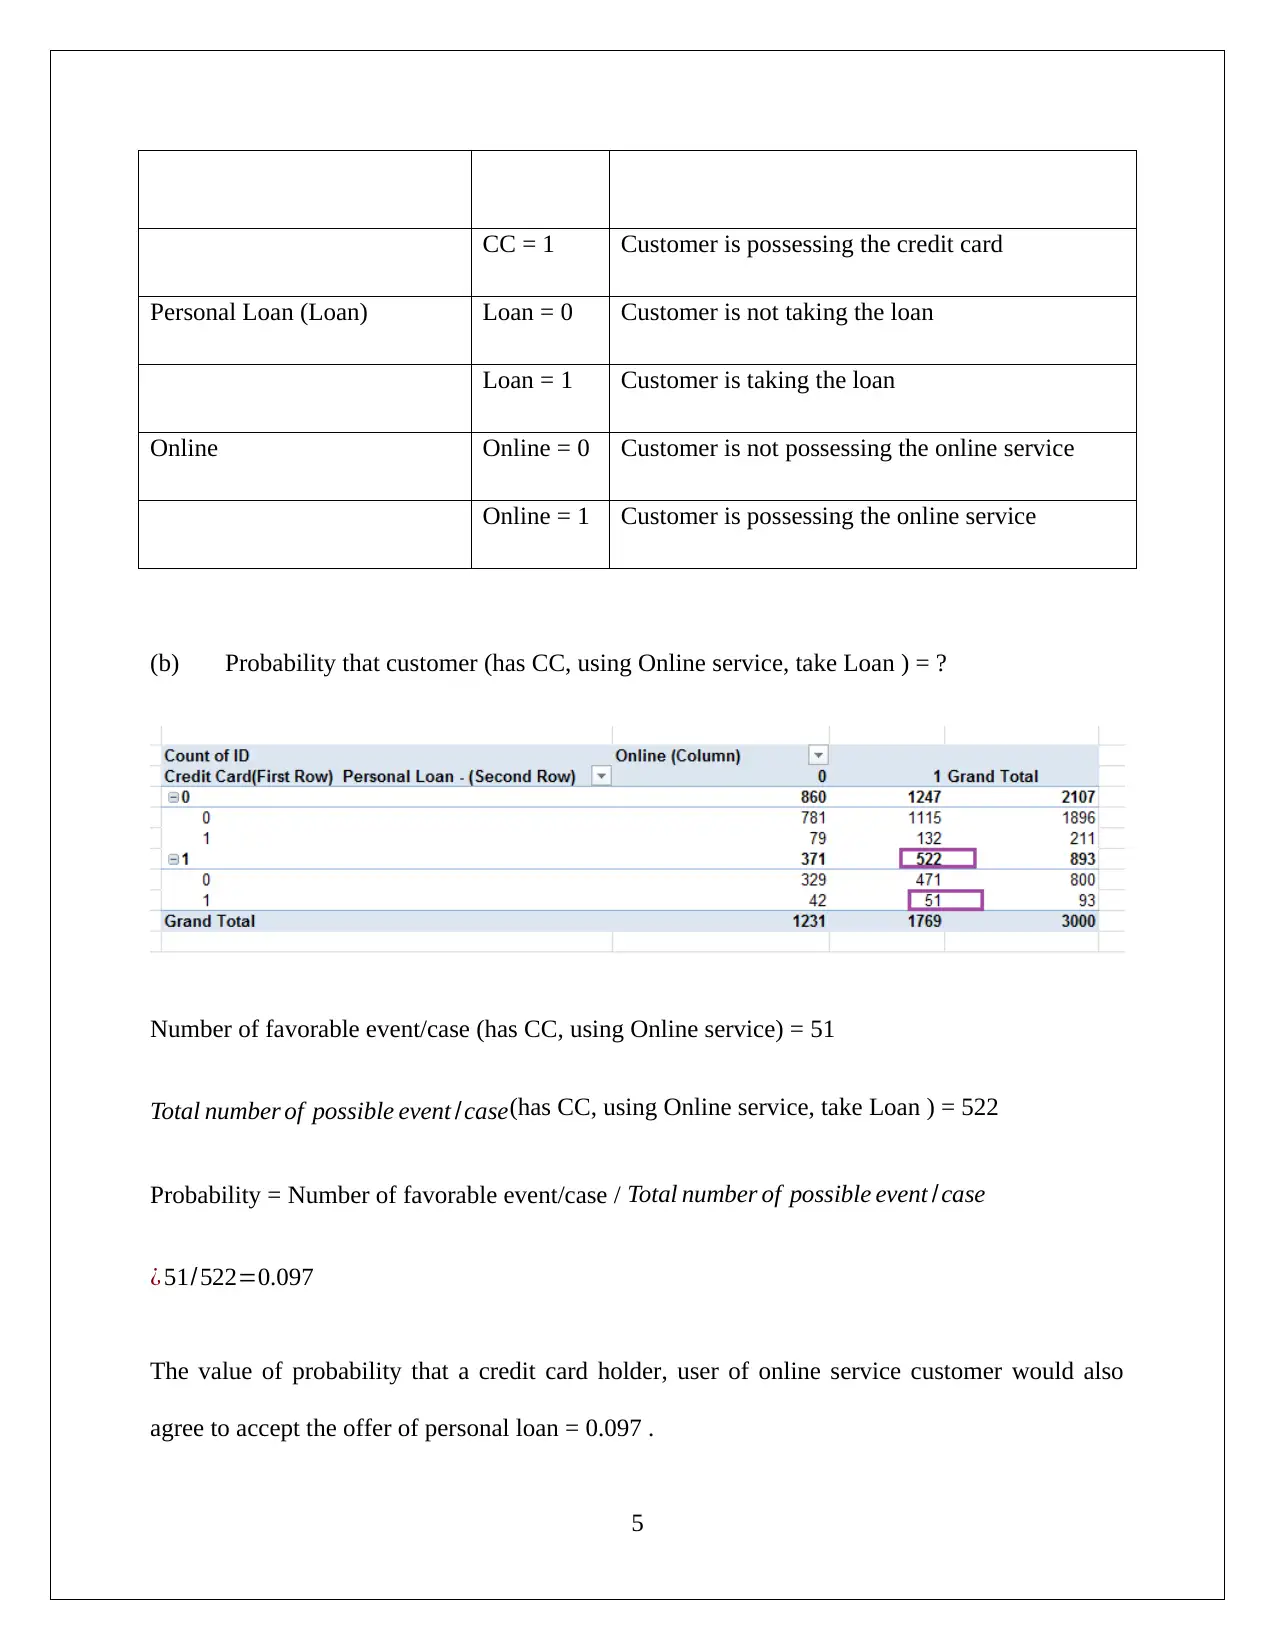
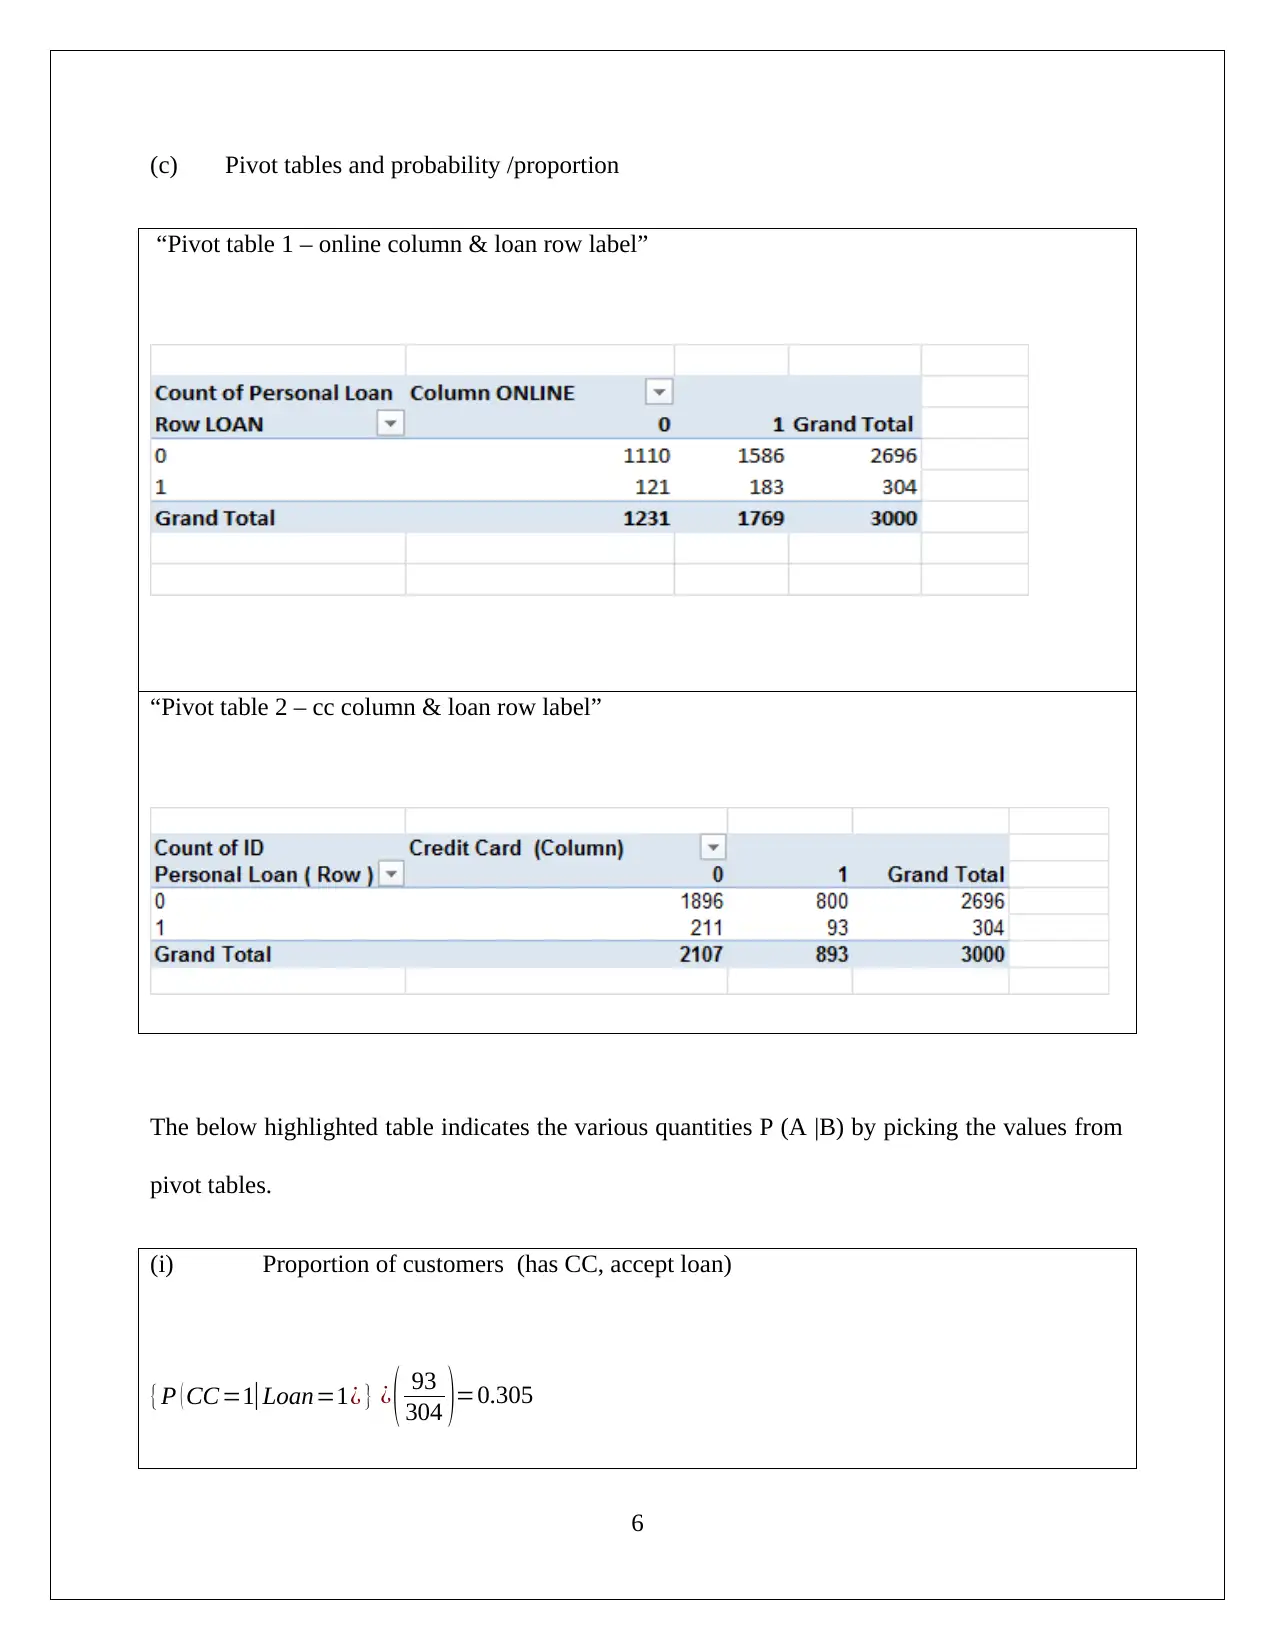
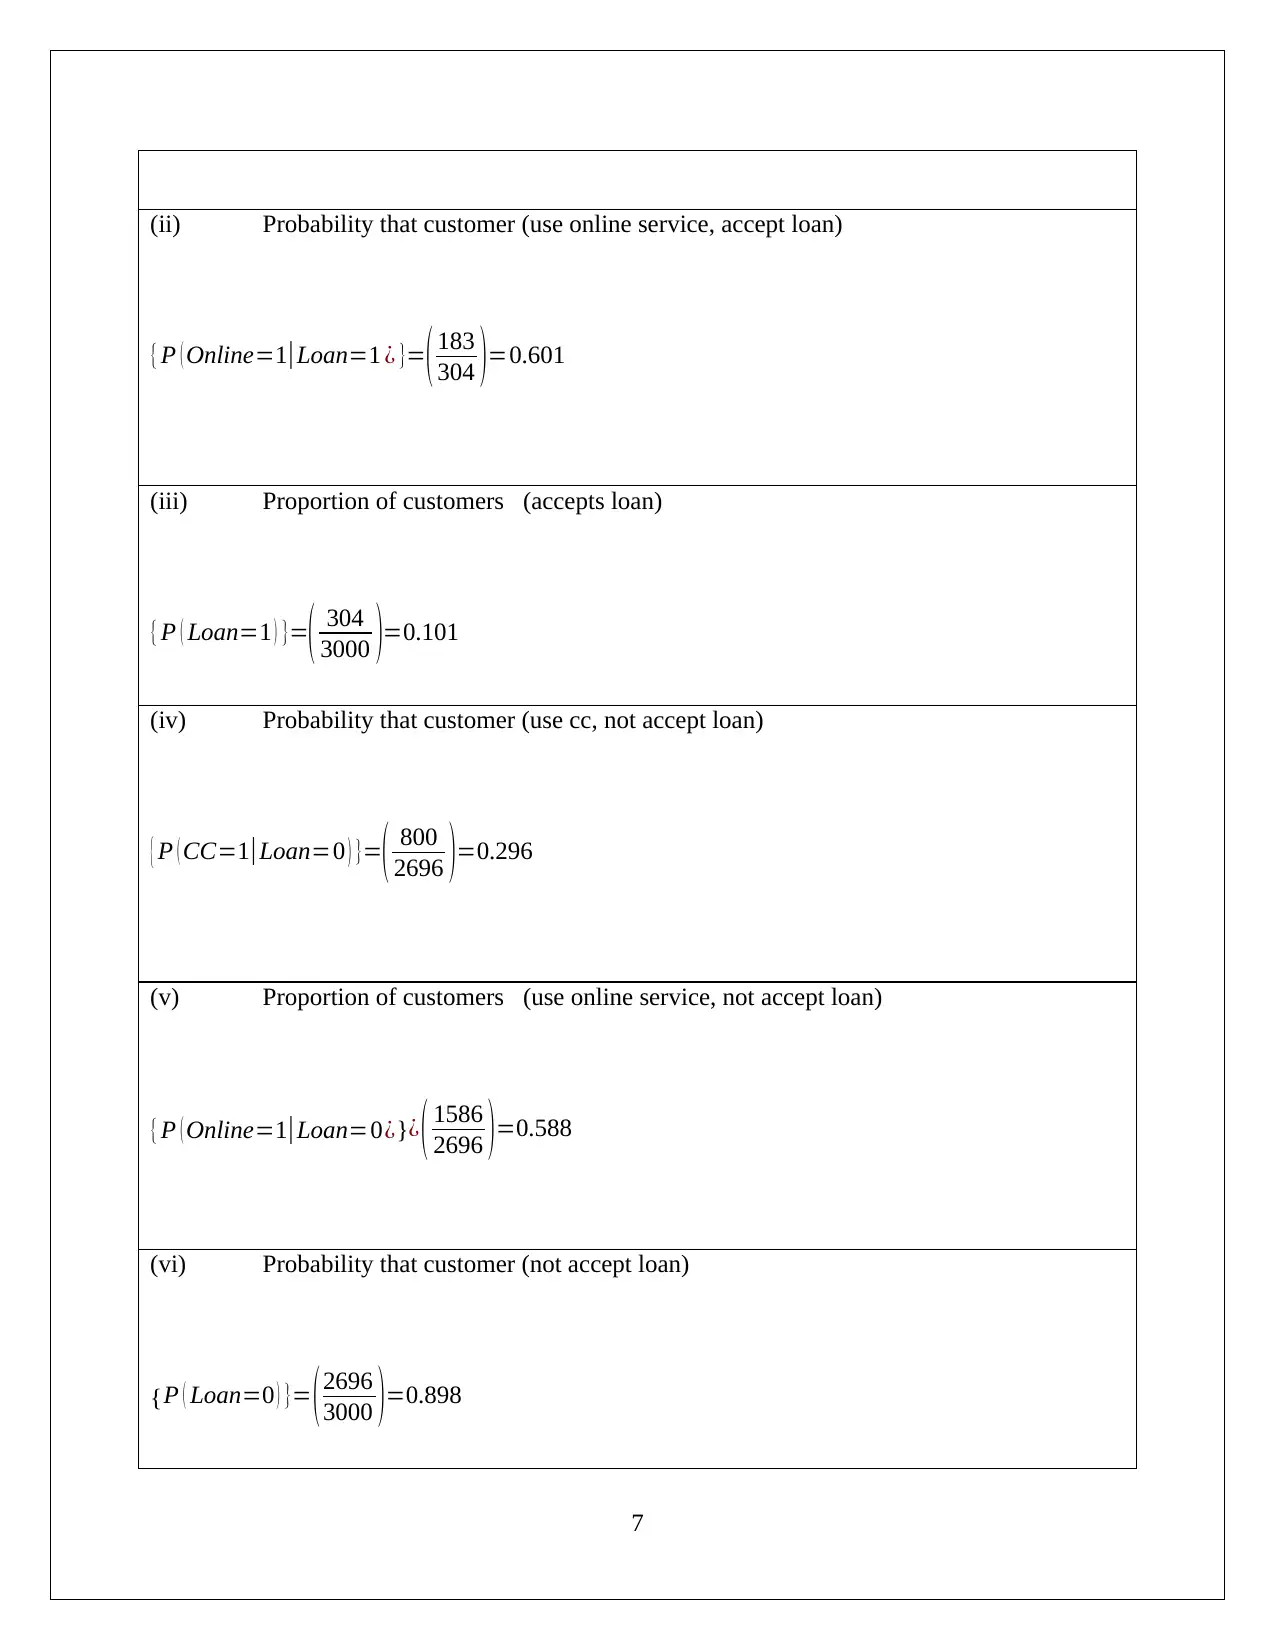
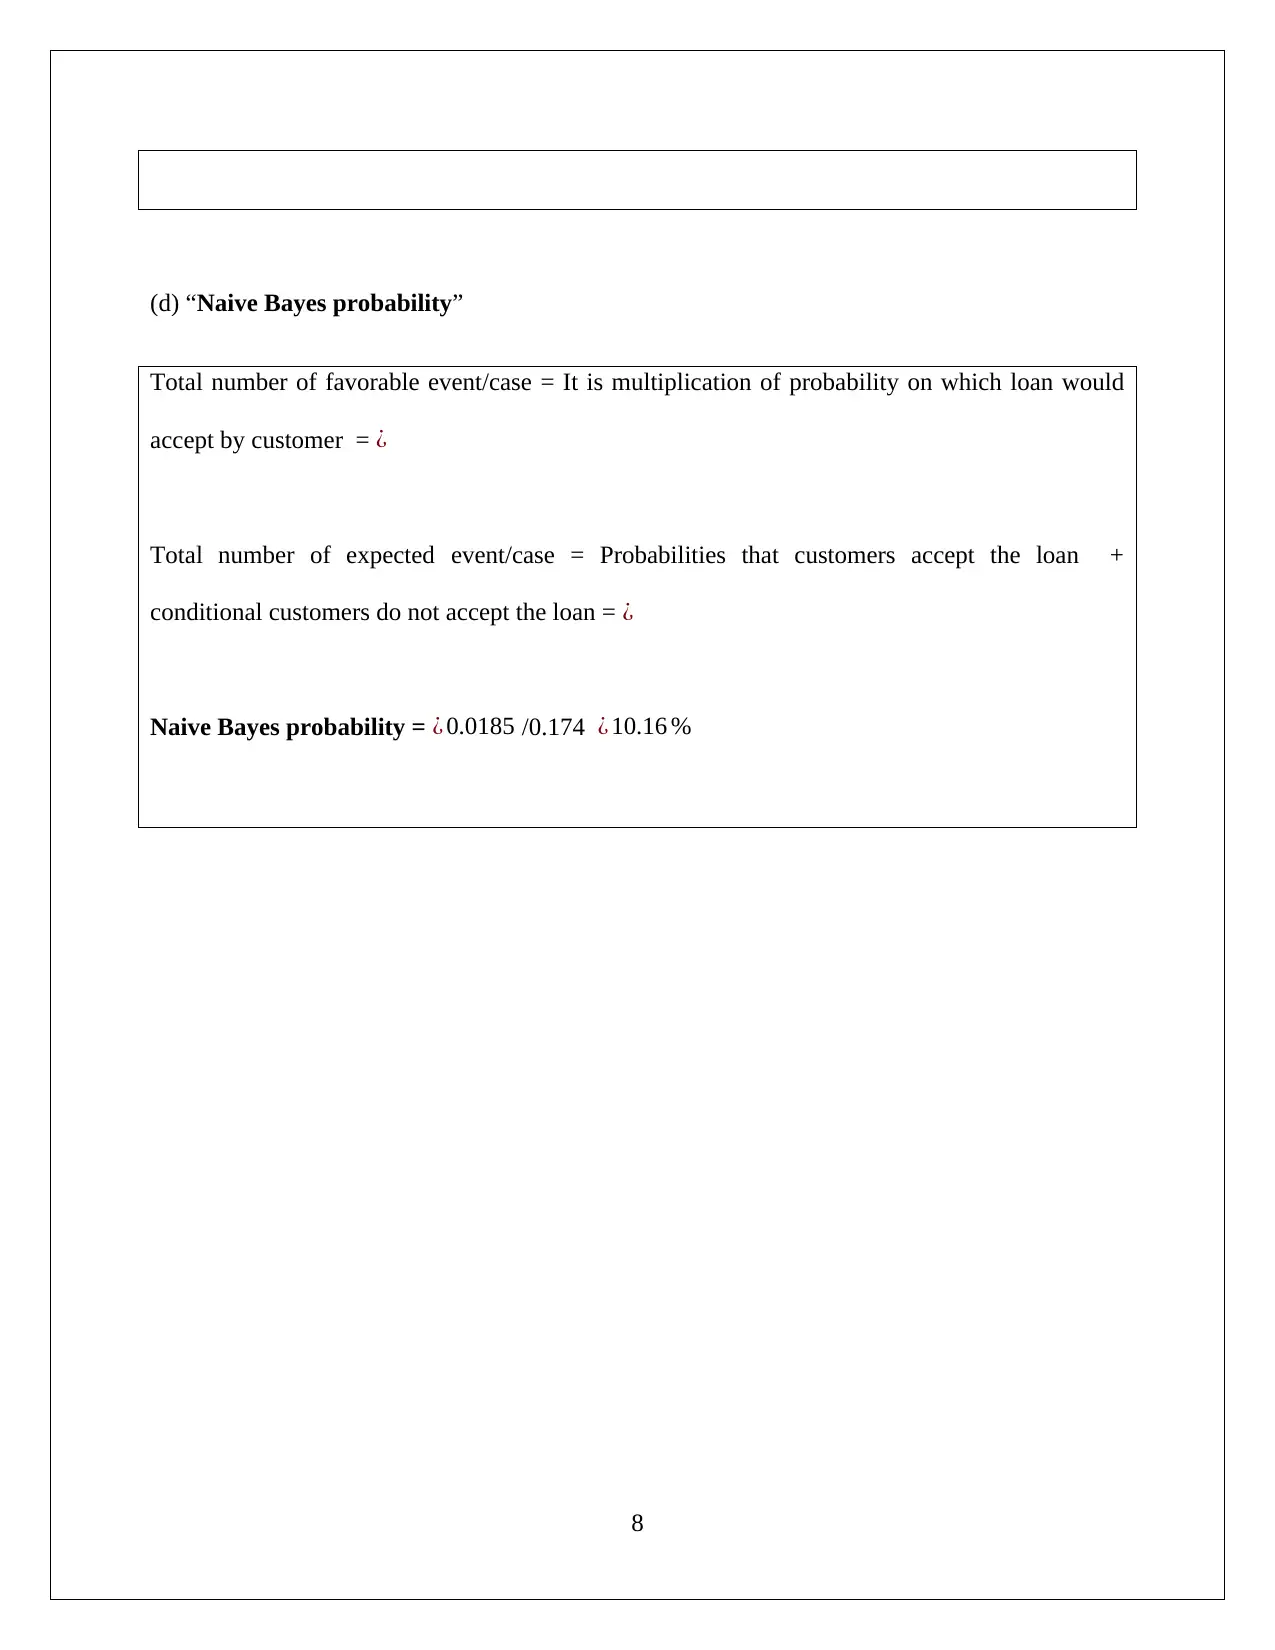
This assignment solution focuses on data mining and visualization techniques for business intelligence. It addresses Principal Component Analysis (PCA) using XL Miner to identify key features and discusses the necessity of data normalization. The solution also explores the advantages and disadvantages of PCA. Furthermore, the assignment delves into analyzing a dataset of 5000 customers from Universal Bank to determine loan acceptors, utilizing pivot tables and calculating probabilities. The solution includes the application of Naive Bayes probability to predict loan acceptance based on customer attributes such as credit card ownership and online service usage. The final part of the assignment recommends the best strategy to increase the chances of the bank making a loan offer.
Document Page
Data Mining and Visualization for Business Intelligence
Assignment – 2
[Pick the date]
STUDENT ID
tabler-icon-diamond-filled.svg

Secure Best Marks with AI Grader

Need help grading? Try our AI Grader for instant feedback on your assignments.
Document Page
Question 1
(a)PCA Output using XL Miner
The principal component matrix helps in identification of useful features which need to be used
for comparison purpose. For this, typically, the magnitude of the coefficients in the principal
component matrix would be critical while the sign just denotes the direction. For example,
consider the principal component 1. The two key features for this principal component would be
x2 and x1 considering that these two features provide the highest coefficient magnitude. This can
be then extended to others and a list of all key features for the various principal components can
be obtained. It is essential that these features collectively indicate the critical characteristics for
the utility companies which must be considered for further analysis. Based on the PCA output,
the critical features have been identified as shown below.
1
Document Page
Also, it needs to be discussed if normalisation is necessary for the dataset provided. The utility of
normalisation in PCA arises since the measurement scale of difference variables tends to differ
which leads to higher variance magnitude for those variables that have bigger values.
Considering the maximum variance emphasis for the PCA, the results produced could be
incorrect. Even though for the US utility data, results are not so skewed so as to warrant
normalisation based on the variance matrix alone. However, considering the scale of certain
variables such as x3, it would be appropriate to conclude that data normalisation would lead to
better results.
(b) The list of advantages and disadvantages of principal component analysis are shown below:
List of advantages of principal component analysis:
1. Reduces high multi-dimensional set of data into fewer number dimensional set of data. This
is termed as dimensional reduction.
2. PCA helps to decide the structure of components.
3. Variables would be defined in the form of coordination structure.
2
Document Page
4. PCA method presents the data in the form of orthogonal projection and covariance matrix
and hence, it is easy to examine the result.
List of disadvantages of principal component analysis:
1. This method is only applicable when the data variables are representing the linear and logical
relations. Hence, its application is limited when the data tend to display non-linear
association.
2. In the process of reducing and eliminating the noise variables, PCA may eliminate the
variables which are critical for the analysis.
3. Further, the cloud points make complex structure in the dimensional space which is highly
confusing, especially when the direction needs to be determined for any particular
compound.
Question 2
Information regarding the tasks is shown below:
Variables count = 14
Total count (Universal Bank customers) = 5000
The task is to find the loan acceptors for the various cases on the “training set.” Hence, the first
objective is to determine the training set from the total count.
3
tabler-icon-diamond-filled.svg

Secure Best Marks with AI Grader

Need help grading? Try our AI Grader for instant feedback on your assignments.
Document Page
In such regards, XLMiner Analytical Tool of excel add in has been taken into consideration and
this provides the standard partition of the total count data.
In standard partition the partition of the count has been done as per the percentage highlighted
below:
Training set = 60 %
Validation set = 40 %
After the standard partition through XLMiner, the output is generated which 3000 data of
training has sets and 2000 data of validation sets.
(a) The pivot table for 3000 data of training sets is created in excel spreadsheet and is given
below:
Description of pivot table
The tables comprises three variables on which one variable online is in column label and the
other two predictors Credit Card (CC) is in first row label and Personal Loan (Loan) is the
second row label. The grand total is taking as a count of ID.
It is imperative to note that variable = 0, 1 having the following meanings.
Credit Card (CC) CC = 0 Customer is not possessing the credit card
4
Document Page
CC = 1 Customer is possessing the credit card
Personal Loan (Loan) Loan = 0 Customer is not taking the loan
Loan = 1 Customer is taking the loan
Online Online = 0 Customer is not possessing the online service
Online = 1 Customer is possessing the online service
(b) Probability that customer (has CC, using Online service, take Loan ) = ?
Number of favorable event/case (has CC, using Online service) = 51
Total number of possible event /case(has CC, using Online service, take Loan ) = 522
Probability = Number of favorable event/case / Total number of possible event /case
¿ 51/522=0.097
The value of probability that a credit card holder, user of online service customer would also
agree to accept the offer of personal loan = 0.097 .
5
Document Page
(c) Pivot tables and probability /proportion
“Pivot table 1 – online column & loan row label”
“Pivot table 2 – cc column & loan row label”
The below highlighted table indicates the various quantities P (A |B) by picking the values from
pivot tables.
(i) Proportion of customers (has CC, accept loan)
{P ( CC =1| Loan=1¿ } ¿ ( 93
304 )=0.305
6
tabler-icon-diamond-filled.svg

Paraphrase This Document

Need a fresh take? Get an instant paraphrase of this document with our AI Paraphraser
Document Page
(ii) Probability that customer (use online service, accept loan)
{P ( Online=1|Loan=1 ¿ }=( 183
304 )=0.601
(iii) Proportion of customers (accepts loan)
{P ( Loan=1 ) }=( 304
3000 )=0.101
(iv) Probability that customer (use cc, not accept loan)
{ P ( CC=1| Loan=0 ) }=( 800
2696 )=0.296
(v) Proportion of customers (use online service, not accept loan)
{P ( Online=1|Loan=0¿}¿ ( 1586
2696 )=0.588
(vi) Probability that customer (not accept loan)
{P ( Loan=0 ) }= (2696
3000 )=0.898
7
Document Page
(d) “Naive Bayes probability
Total number of favorable event/case = It is multiplication of probability on which loan would
accept by customer = ¿
Total number of expected event/case = Probabilities that customers accept the loan +
conditional customers do not accept the loan = ¿
Naive Bayes probability = ¿ 0.0185 /0.174 ¿ 10.16 %
8
Document Page
(e) Possession of credit card along with customer being a frequent user of services offered in the
form of online banking would be termed as best strategy as these actions would help increase the
chances of the bank making an offer for a loan.
9
chevron_up_icon
1 out of 10
circle_padding
hide_on_mobile
zoom_out_icon
logo.png

Your All-in-One AI-Powered Toolkit for Academic Success.

Available 24*7 on WhatsApp / Email

[object Object]