Data Mining and Visualization for Business Intelligence Homework
VerifiedAdded on 2020/04/07
|11
|1080
|82
Homework Assignment
AI Summary
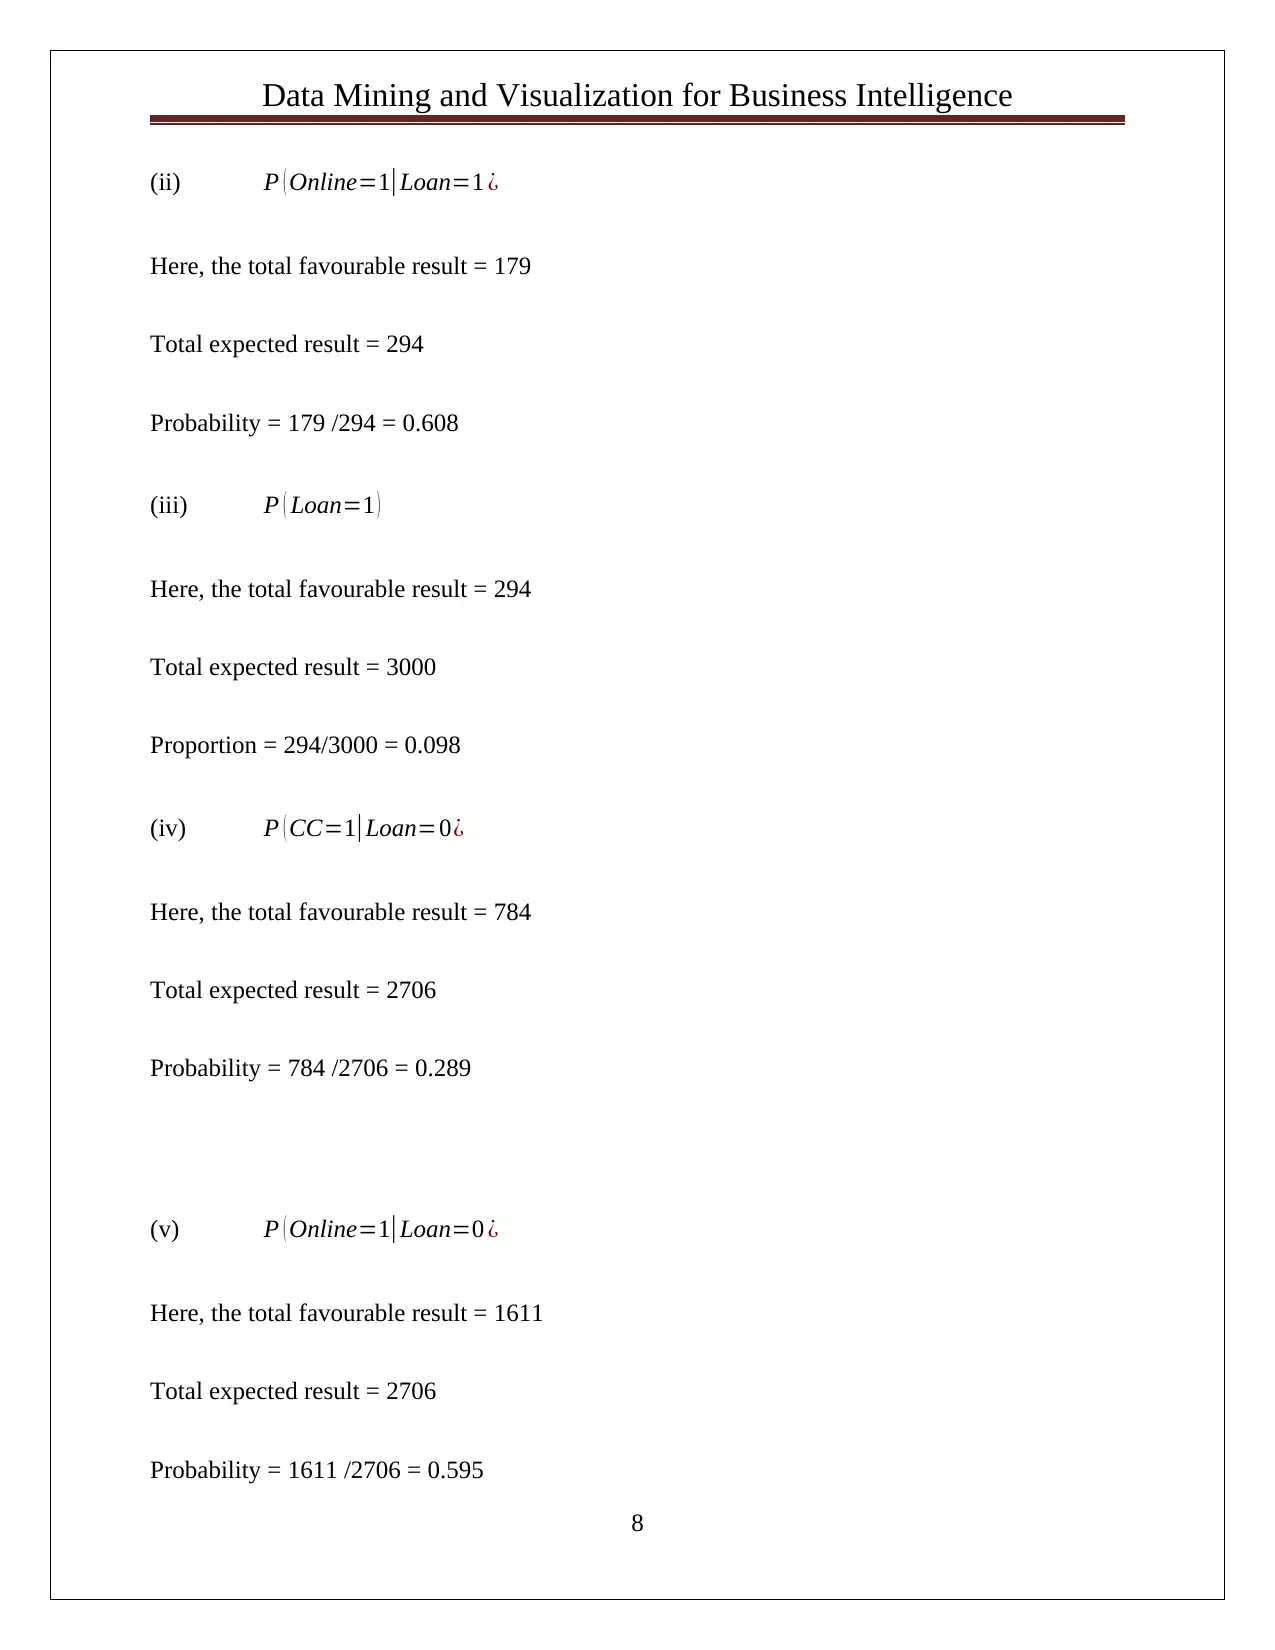
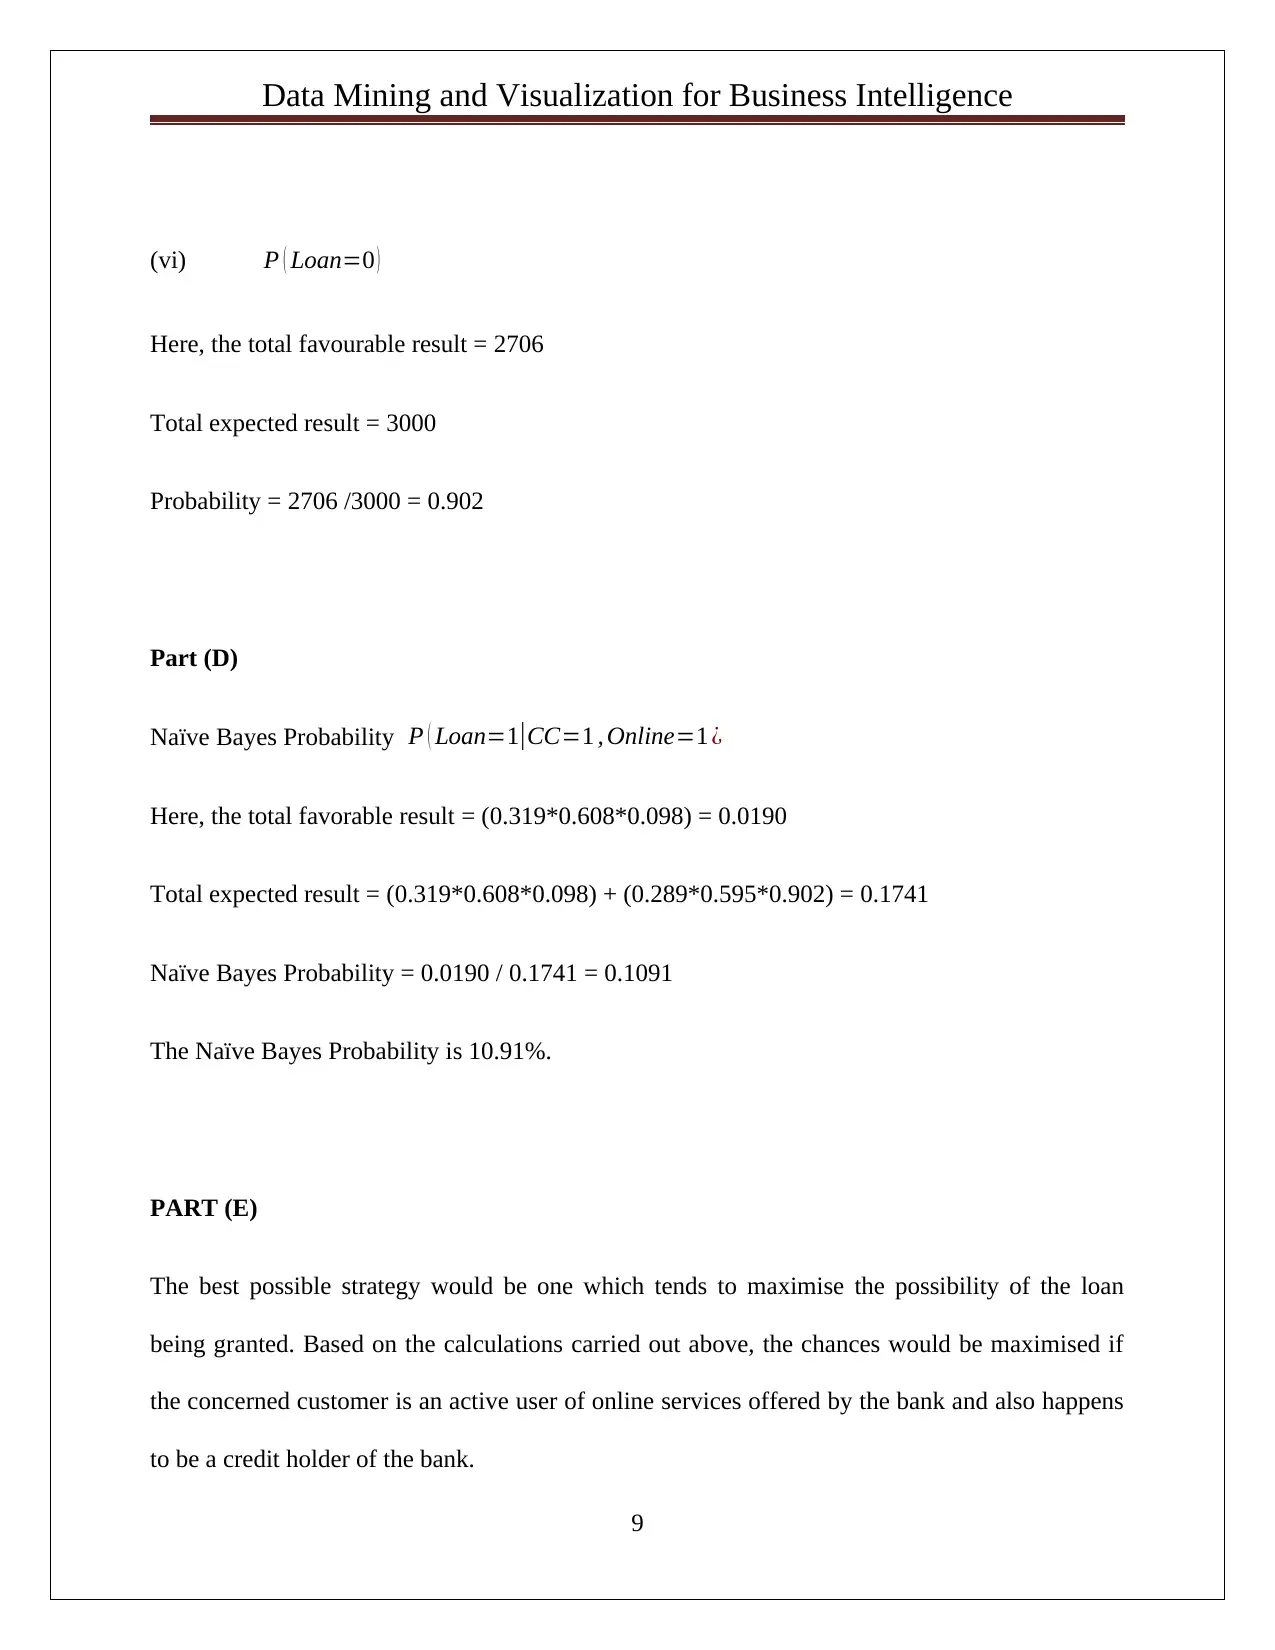
This assignment solution focuses on data mining and visualization techniques for business intelligence. It includes an analysis of Principal Component Analysis (PCA) output, interpreting variance and identifying significant features for dimension reduction. The solution also covers the Naive Bayes classifier, including pivot table design to analyze relationships between predictors (credit card holders, online banking users) and loan acceptance. Probability calculations are performed to determine the likelihood of loan acceptance based on customer profiles, and a Naive Bayes Probability is derived. The assignment concludes with a discussion of the best strategy to maximize loan approval chances, based on the calculated probabilities. The solution leverages tools like XLMiner for analysis and provides insights into data normalization and the advantages and disadvantages of PCA.

Data Mining and Visualization for Business Intelligence
Business Case Analysis
[Pick the date]
Student id and anme
Question 1
DIMENSION REDUCTION
Business Case Analysis
[Pick the date]
Student id and anme
Question 1
DIMENSION REDUCTION
Paraphrase This Document
Need a fresh take? Get an instant paraphrase of this document with our AI Paraphraser

Data Mining and Visualization for Business Intelligence
(a) PCA
Principal component analysis has been run through XLMiner and the output is shown below:
XLMiner – PCA summary output
1
(a) PCA
Principal component analysis has been run through XLMiner and the output is shown below:
XLMiner – PCA summary output
1

Data Mining and Visualization for Business Intelligence
XLMiner –PCA principal component analysis
2
XLMiner –PCA principal component analysis
2
⊘ This is a preview!⊘
Do you want full access?
Subscribe today to unlock all pages.

Trusted by 1+ million students worldwide

Data Mining and Visualization for Business Intelligence
Interpretation of PCA output
From the values of variance in the variance % table, it can be noted that about 85% of variance
come from principal components 1, 2, 3, 4 and 5. Further, only small portions come from
principal components 6, 7 and 8. Therefore, these components would be termed as noise
components and can be removed from the original principal matrix. The matrix would be termed
as reduced principal matrix and is highlighted below:
After analyzing the features of the above highlighted principal components, the most significant
features would be decided which are shown below:
X2 - Principal component 1
X6 - Principal component 2
X7 - Principal component 3
X3 - Principal component 4
X4 - Principal component 5
After evaluating the variances of each of the significant feature variable the key significant
components are listed below:
3
Paraphrase This Document
Need a fresh take? Get an instant paraphrase of this document with our AI Paraphraser

Data Mining and Visualization for Business Intelligence
X2,
X6
X7
Normalization of data would be essential to perform only when a few variables are contributing
significantly in the total variance. An example is when one variable is showing extremely high
percentage of variance in total variance. The data normalisation is not essential to adopt when the
are more than one or two variables that are having meaningful level of contribution in variance.
In the presence case scenario, each variable has associated with their respective variance
percentage in the total variance. Therefore, for performing the PCA for the variables, data
normalization is not requisite.
Part (b)
Advantages
PCA is considered to be a powerful method to examine the structure and projection of the data
set. The main advantage of PCA is in reduction the multidimensional variables into fewer
dimension variables. This also reduces the total risk that can be developed in the process of
over-fitting the data. Interpretation and visualization of the data is easy as compared with other
techniques because it provide result in orthogonal view and in m-cloud point dimensional space.
Disadvantages
The major drawback of PCA technique is that it can only be applicable for the data which
exhibits linear relationship. Further, when the data set is significantly high, then measurement
4

Data Mining and Visualization for Business Intelligence
and principal component’s direction is a critical task. At times, the difference in the variances is
very low and hence, the decision to select the key significant feature is difficult task. This cannot
be used for blind data and categorical variables data set.
Question 2
NAÏVE BAYES CLASSIFIER
Number of observations (Number of customers) = 5000
Partition of total data in training set and validation set through XLMiner by taking the following
percentages.
60% = Training & 40% = Validation
Part (A)
In part a the aim is to design a pivot table that would show the relations among the given
predictors and the loan variable only for the training data.
These two predictors are credit card (CC) holders and user of online banking service. Hence,
below highlighted the pivot comprises one column label i.e. Online and two row variables i.e.
Credit card and Persoanl loan.
CC = 0 and 1 : The value 0 in the first row highlighted that the customer is not holding the credit
card and 1 implies that customer has credit card.
5
⊘ This is a preview!⊘
Do you want full access?
Subscribe today to unlock all pages.

Trusted by 1+ million students worldwide

Data Mining and Visualization for Business Intelligence
Loan = 0 and 1: The value 0 in the second row highlighted that the customer would not accept
the Universal Bank loan offer. On the other hand, the value 1 implies that customer would accept
the Universal Bank loan offer.
Online = 0 and 1: The value 0 in the column highlighted that the customer is not an active user
of onine bank services and 1 implies that customer is an active user of onine bank services.
Part (B)
Probability that customer (CC= 1 | Online = 1) would accept the loan =?
Here, the total favourable result = 53
Total expected result = 518
Probability = 53/518 = 0.1023
Hence, there is 10.23% probability that a customer who already uses banking service and credit
card would also ready to take the offer of loan from bank.
6
Paraphrase This Document
Need a fresh take? Get an instant paraphrase of this document with our AI Paraphraser

Data Mining and Visualization for Business Intelligence
Part (C)
The two separate pivot tables for the given set of description are highlighted below:
(1) Pivot table one highlights the association between the online as column label and loan as
row label:
(2) Pivot table one highlights the association between the Credit Card as column label and
loan as row label:
Determination of P (A|B) for the given cases
(i) P ( CC=1|Loan=1 ¿
Here, the total favorable result = 94
Total expected result = 294
Probability = 94/294 = 0.319
7

Data Mining and Visualization for Business Intelligence
(ii) P ( Online=1|Loan=1 ¿
Here, the total favourable result = 179
Total expected result = 294
Probability = 179 /294 = 0.608
(iii) P ( Loan=1 )
Here, the total favourable result = 294
Total expected result = 3000
Proportion = 294/3000 = 0.098
(iv) P ( CC=1|Loan=0¿
Here, the total favourable result = 784
Total expected result = 2706
Probability = 784 /2706 = 0.289
(v) P ( Online=1|Loan=0 ¿
Here, the total favourable result = 1611
Total expected result = 2706
Probability = 1611 /2706 = 0.595
8
⊘ This is a preview!⊘
Do you want full access?
Subscribe today to unlock all pages.

Trusted by 1+ million students worldwide

Data Mining and Visualization for Business Intelligence
(vi) P ( Loan=0 )
Here, the total favourable result = 2706
Total expected result = 3000
Probability = 2706 /3000 = 0.902
Part (D)
Naïve Bayes Probability P ( Loan=1|CC=1 , Online=1 ¿
Here, the total favorable result = (0.319*0.608*0.098) = 0.0190
Total expected result = (0.319*0.608*0.098) + (0.289*0.595*0.902) = 0.1741
Naïve Bayes Probability = 0.0190 / 0.1741 = 0.1091
The Naïve Bayes Probability is 10.91%.
PART (E)
The best possible strategy would be one which tends to maximise the possibility of the loan
being granted. Based on the calculations carried out above, the chances would be maximised if
the concerned customer is an active user of online services offered by the bank and also happens
to be a credit holder of the bank.
9
Paraphrase This Document
Need a fresh take? Get an instant paraphrase of this document with our AI Paraphraser

Data Mining and Visualization for Business Intelligence
10
10
1 out of 11
Related Documents

Your All-in-One AI-Powered Toolkit for Academic Success.
+13062052269
info@desklib.com
Available 24*7 on WhatsApp / Email
Unlock your academic potential
Copyright © 2020–2025 A2Z Services. All Rights Reserved. Developed and managed by ZUCOL.