Data Mining & Visualization Business Case

Verified

Added on  2019/10/30

|10
|899
|382
Report
AI Summary
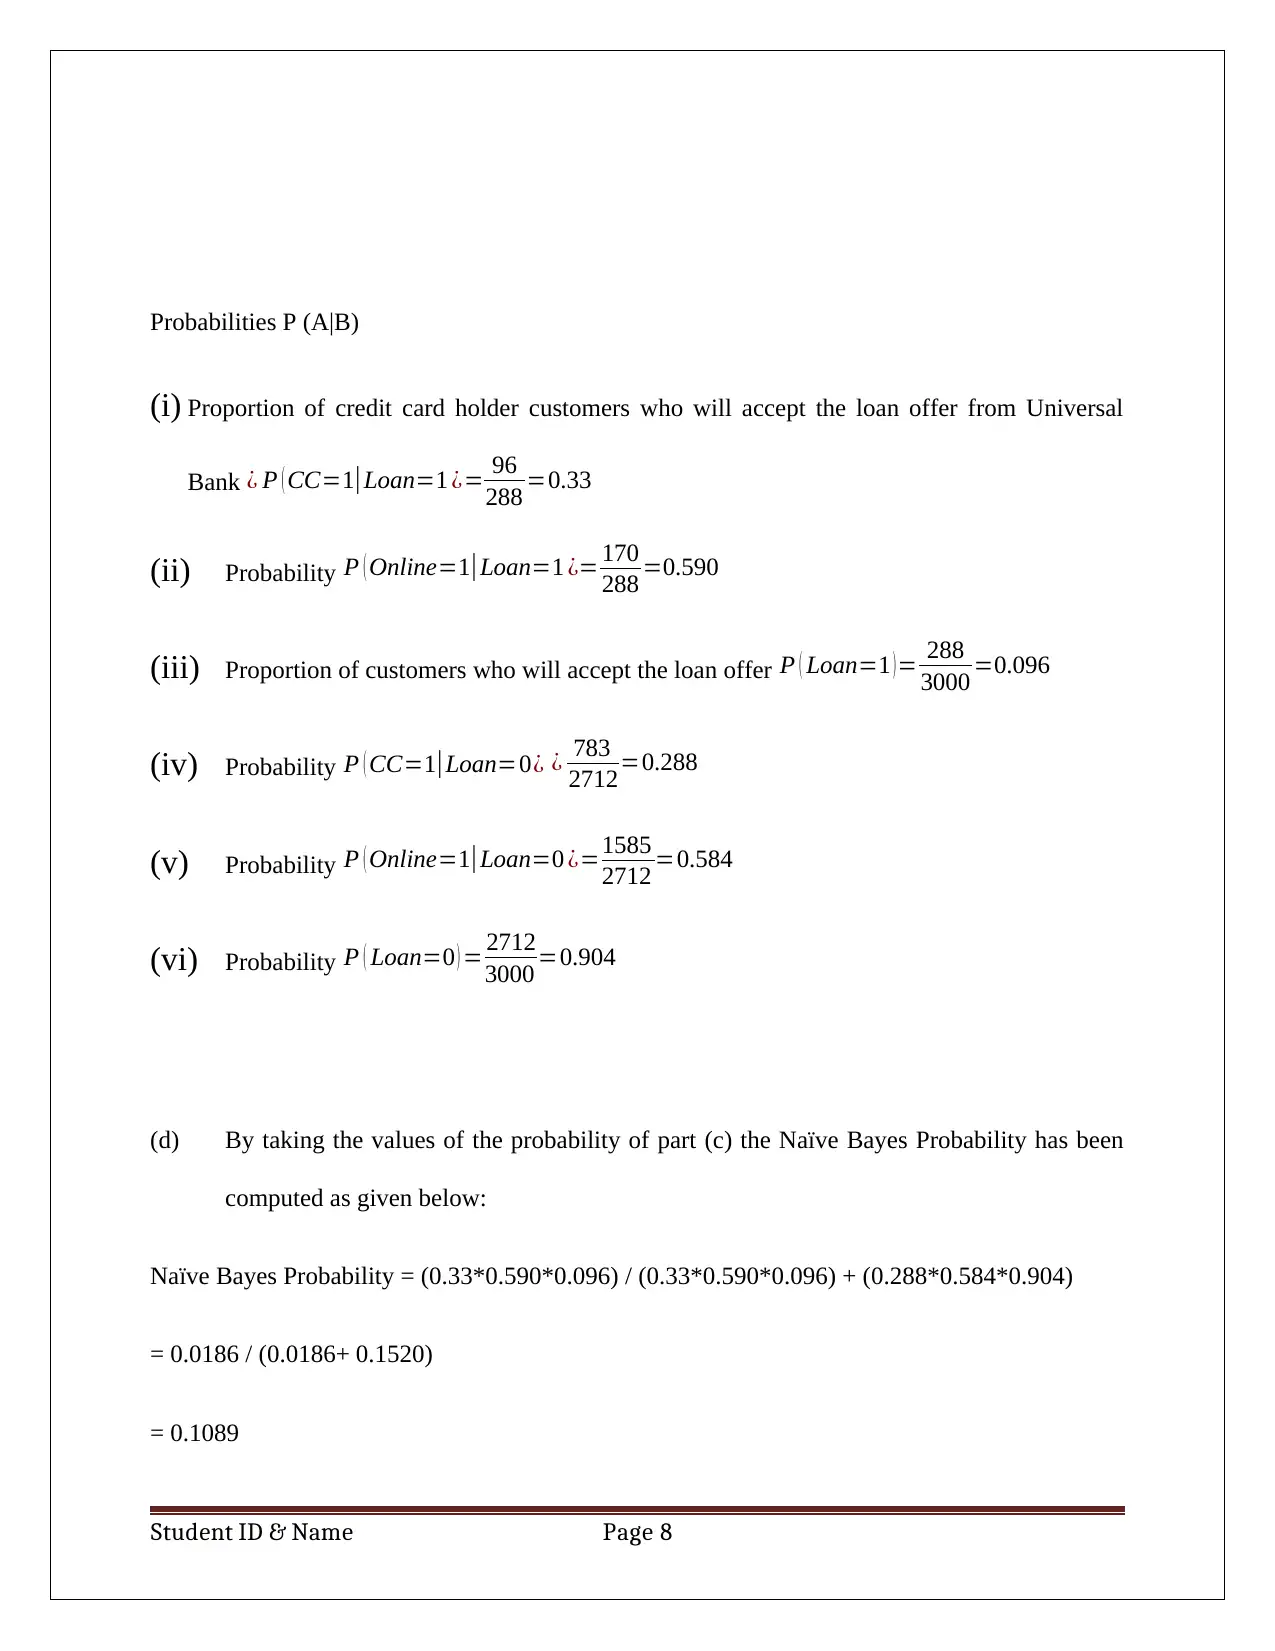
This report details a business case analysis using data mining and visualization techniques. The student utilizes Principal Component Analysis (PCA) to reduce the dimensionality of a dataset, identifying key components for predicting customer loan acceptance. The analysis includes a discussion of data normalization within the PCA context, weighing the advantages and disadvantages of this approach. Furthermore, the report employs Naïve Bayes probability to calculate the likelihood of a customer accepting a loan offer based on factors like credit card ownership and online banking usage. The report concludes by suggesting the optimal customer profile for maximizing loan acceptance probability, highlighting the practical application of data analysis in business decision-making. The analysis is supported by pivot tables and calculations, demonstrating a clear understanding of the methods employed.
Document Page
Data Mining and Visualization for Business Intelligence
Business Case Analysis
Student id
[Pick the date]
Question 1
tabler-icon-diamond-filled.svg

Paraphrase This Document

Need a fresh take? Get an instant paraphrase of this document with our AI Paraphraser
Document Page
Data and variable description
(a) Principal component Analysis
This is considered to be a powerful technique to reduce n- number of predictors into principal
components by evaluating the input variables. The resulting output for PCA on the given set of
variables from XLMiner is shown below:
Student ID & Name Page 1
Document Page
Figure 1 : PCA OUTPUT FROM XLMINER
Analysis
It can be viewed from variance % table that initial 5 principal components has more than 85% of
total variation is associated with the eight (original) variable. Therefore it can be suggested to
eliminate the rest three principal components because they do not have much influence on the
scale of variables. The reduced matrix is given below:
Student ID & Name Page 2
Document Page
Figure 2 : FIRST FIVE PRINCIPAL COMPONENTS
The key components have been decided based on the significance features (contribution in
variance) of the principal components.
Key components are decided as X2: Rate of return on capital, X6: Sales (KWH use per year) and
X7: Percent Nuclear. This has been derived considering the respect values for each of the eight
attributes in case of the principal components that have the highest variance contribution.
Normalizing Data in PCA
Student ID & Name Page 3
tabler-icon-diamond-filled.svg

Paraphrase This Document

Need a fresh take? Get an instant paraphrase of this document with our AI Paraphraser
Document Page
In order to determine whether normalizing of the data set is required or not, the first step is to
find the weights of the original variables in various principal components. Normalizing data or
say standardization of data provides equal importance to each of variables in terms of variance.
It replaces each of the original variables by its standardized version of the variables which shows
unit variance. Also, when each variable has sizable involvement in the total variance, then
normalizing data does not need to be performed for the original data variable.
For the given subsets, the normalizing data is not essential because from the table of variance
percentage, it is apparent that most of the principal components are having significant
domination in total variance and the same is not overly dominated by only one of the parameters.
(b) The main advantages and disadvantages are listed below:
Advantages
Help to understand the structure of the subsets.
This technique is useful when the subset of measurements and the final measurement
scale is same.
It can be used when the data variables are highly correlated through linear relations.
It reduces the multiple variables set into few variables.
These few variables are termed as principal components and are having the “explanatory
power” of the whole original subset.
The vital advantage of principal components analysis is that the principal components
and the original data are non-correlated and thus, the value of correlation coefficient
between them is zero.
Student ID & Name Page 4
Document Page
The regression model by taking these principal components would reduce the risk of
“Multicollinearity.”.
Disadvantages
This method is recommended to use only for “quantitative variables” and thus, for other
variables such as categorical variables correspondence analysis would be more
imperative.
It provides visualization in a cloud point based m- dimensional space and therefore, it
seems difficult to determine the exact direction of the variable vector.
It cannot be deemed suitable for the subsets when it has been derived from an unknown
or blind separation data.
It is not suitable for the data which does not have definite mean and variance and
orthogonal type projection in the point cloud.
Student ID & Name Page 5
Document Page
Question 2
Total sample = 5000 Customers
Partition though XLMiner (60% Training and 40% validation)
(a) Training data of 3000 customers would be used to make the pivot table based on the
given information about row and column label.
Column label – Online
Row label – 1st: Credit Card & 2nd: Personal Loan
(b) The probability that customers who owns credit card and using the online bank service
would ready to accept the universal bank loan offer is computed below:
Student ID & Name Page 6
tabler-icon-diamond-filled.svg

Paraphrase This Document

Need a fresh take? Get an instant paraphrase of this document with our AI Paraphraser
Document Page
P= 55
512 =0.1074
Therefore, the probability is only 10.74% that the customers who owns credit card and using the
online bank service would ready to accept the universal bank loan offer.
(c) The pivot tables are indicated below:
Pivot table (i)
Column label – Online
Row label –Personal Loan
Pivot table (ii)
Column label – Credit Card
Row label –Personal Loan
Student ID & Name Page 7
Document Page
Probabilities P (A|B)
(i) Proportion of credit card holder customers who will accept the loan offer from Universal
Bank ¿ P ( CC=1|Loan=1 ¿= 96
288 =0.33
(ii) Probability P ( Online=1|Loan=1 ¿= 170
288 =0.590
(iii) Proportion of customers who will accept the loan offer P ( Loan=1 ) = 288
3000 =0.096
(iv) Probability P ( CC=1|Loan=0¿ ¿ 783
2712=0.288
(v) Probability P ( Online=1|Loan=0 ¿=1585
2712 =0.584
(vi) Probability P ( Loan=0 ) = 2712
3000 =0.904
(d) By taking the values of the probability of part (c) the Naïve Bayes Probability has been
computed as given below:
Naïve Bayes Probability = (0.33*0.590*0.096) / (0.33*0.590*0.096) + (0.288*0.584*0.904)
= 0.0186 / (0.0186+ 0.1520)
= 0.1089
Student ID & Name Page 8
Document Page
Hence, the value of Naïve Bayes Probability is 0.1089 or 10.89%.
(e) Best strategy from the customer point of view would be possession of same bank credit
card coupled with usage of online banking services of the same bank as it leads to
maximization of the personal loan being offered to the random customer.
Student ID & Name Page 9
chevron_up_icon
1 out of 10
circle_padding
hide_on_mobile
zoom_out_icon
[object Object]