Data Mining Assignment: Weka, Iris, and Attribute Exploration

Verified

Added on  2022/09/15

|7
|420
|15
Homework Assignment
AI Summary
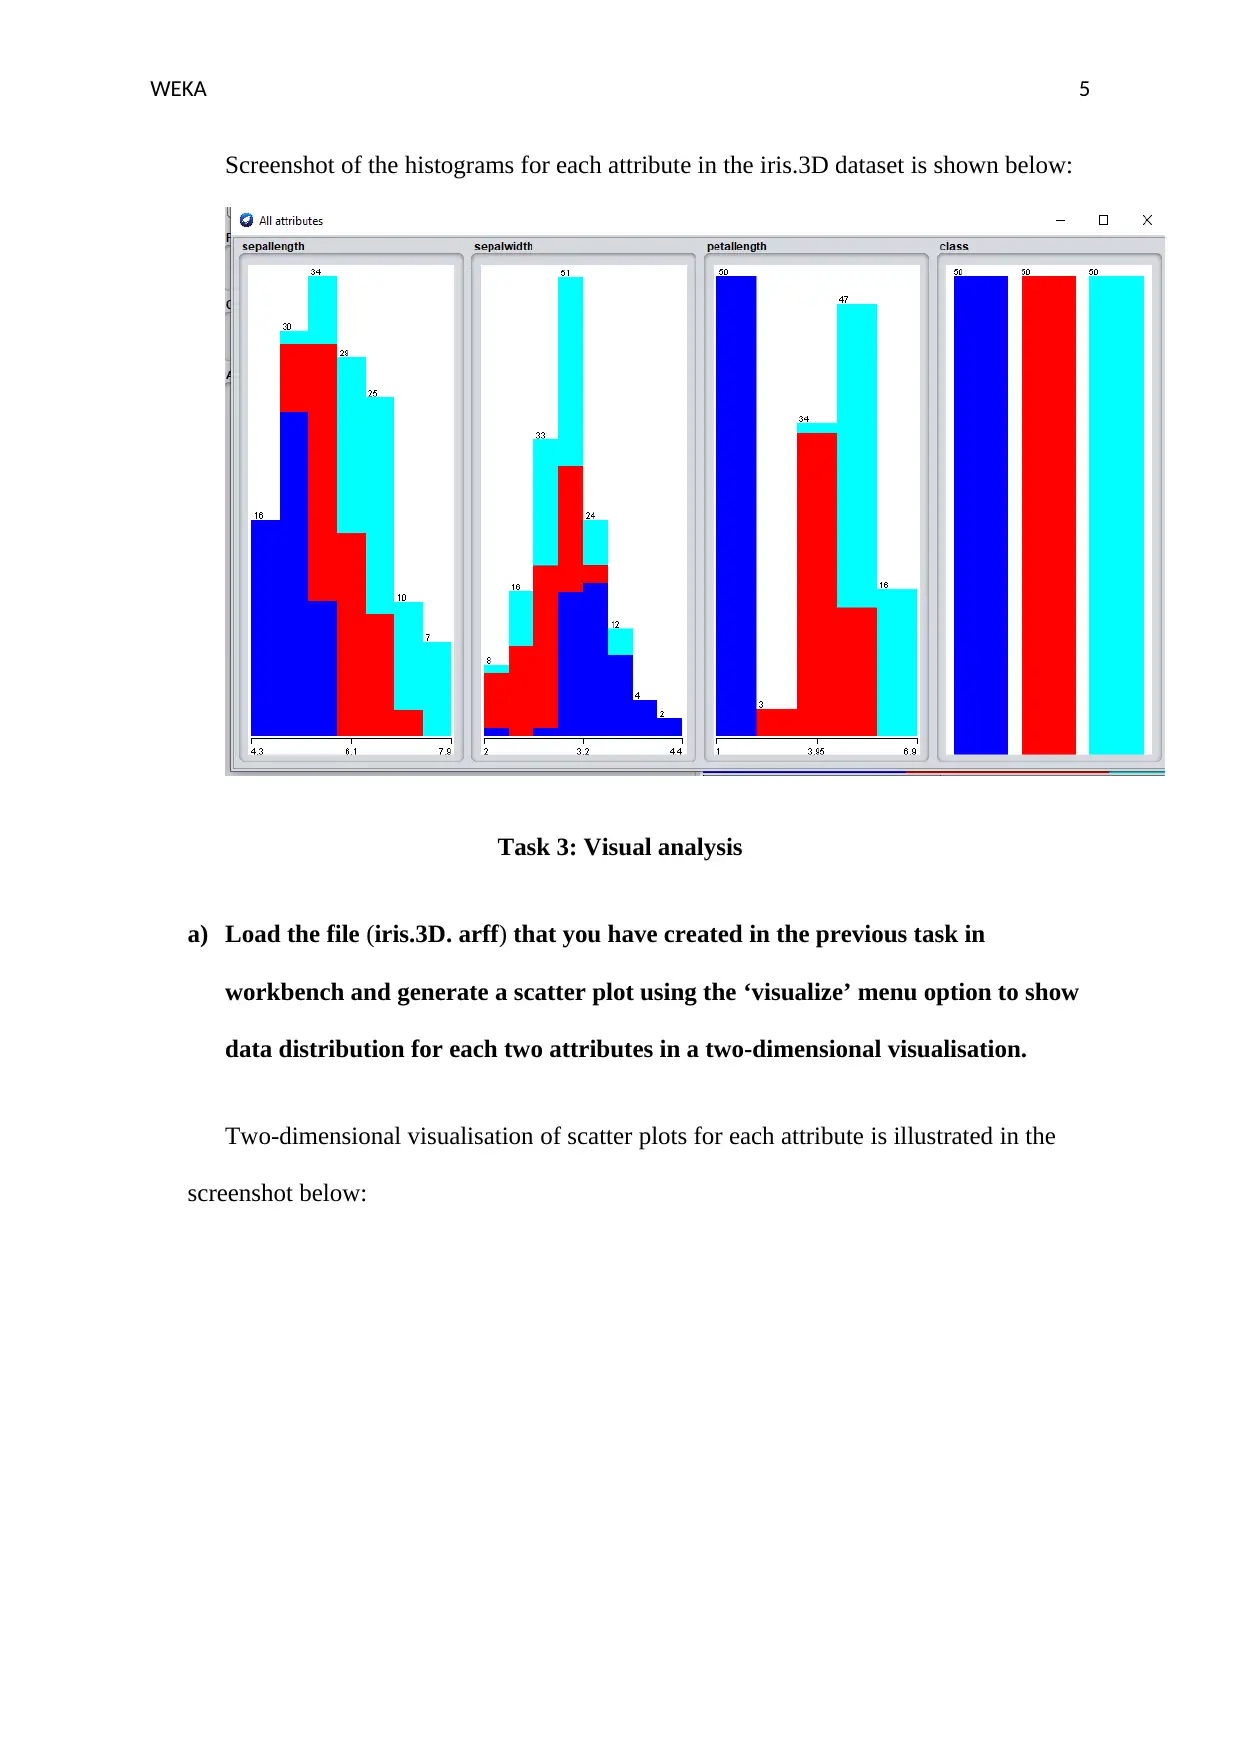
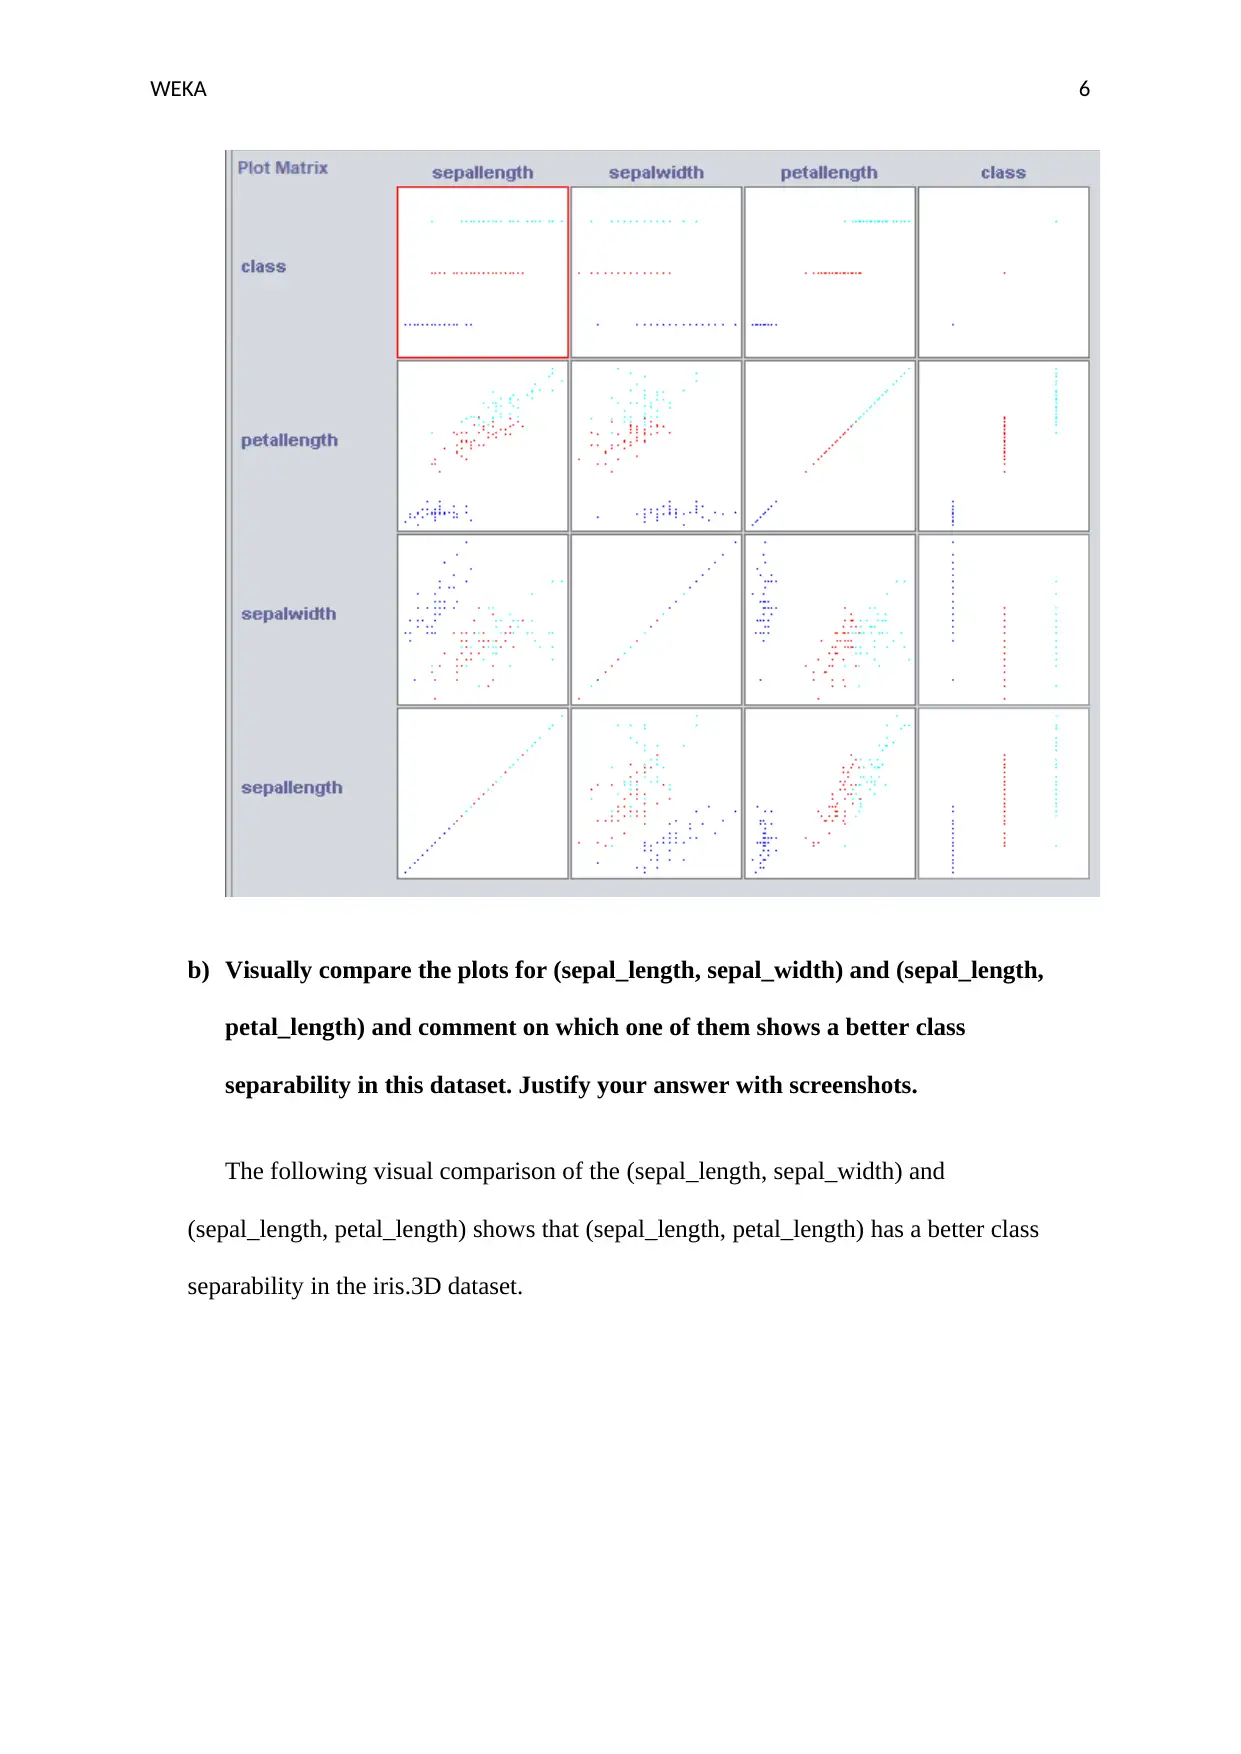
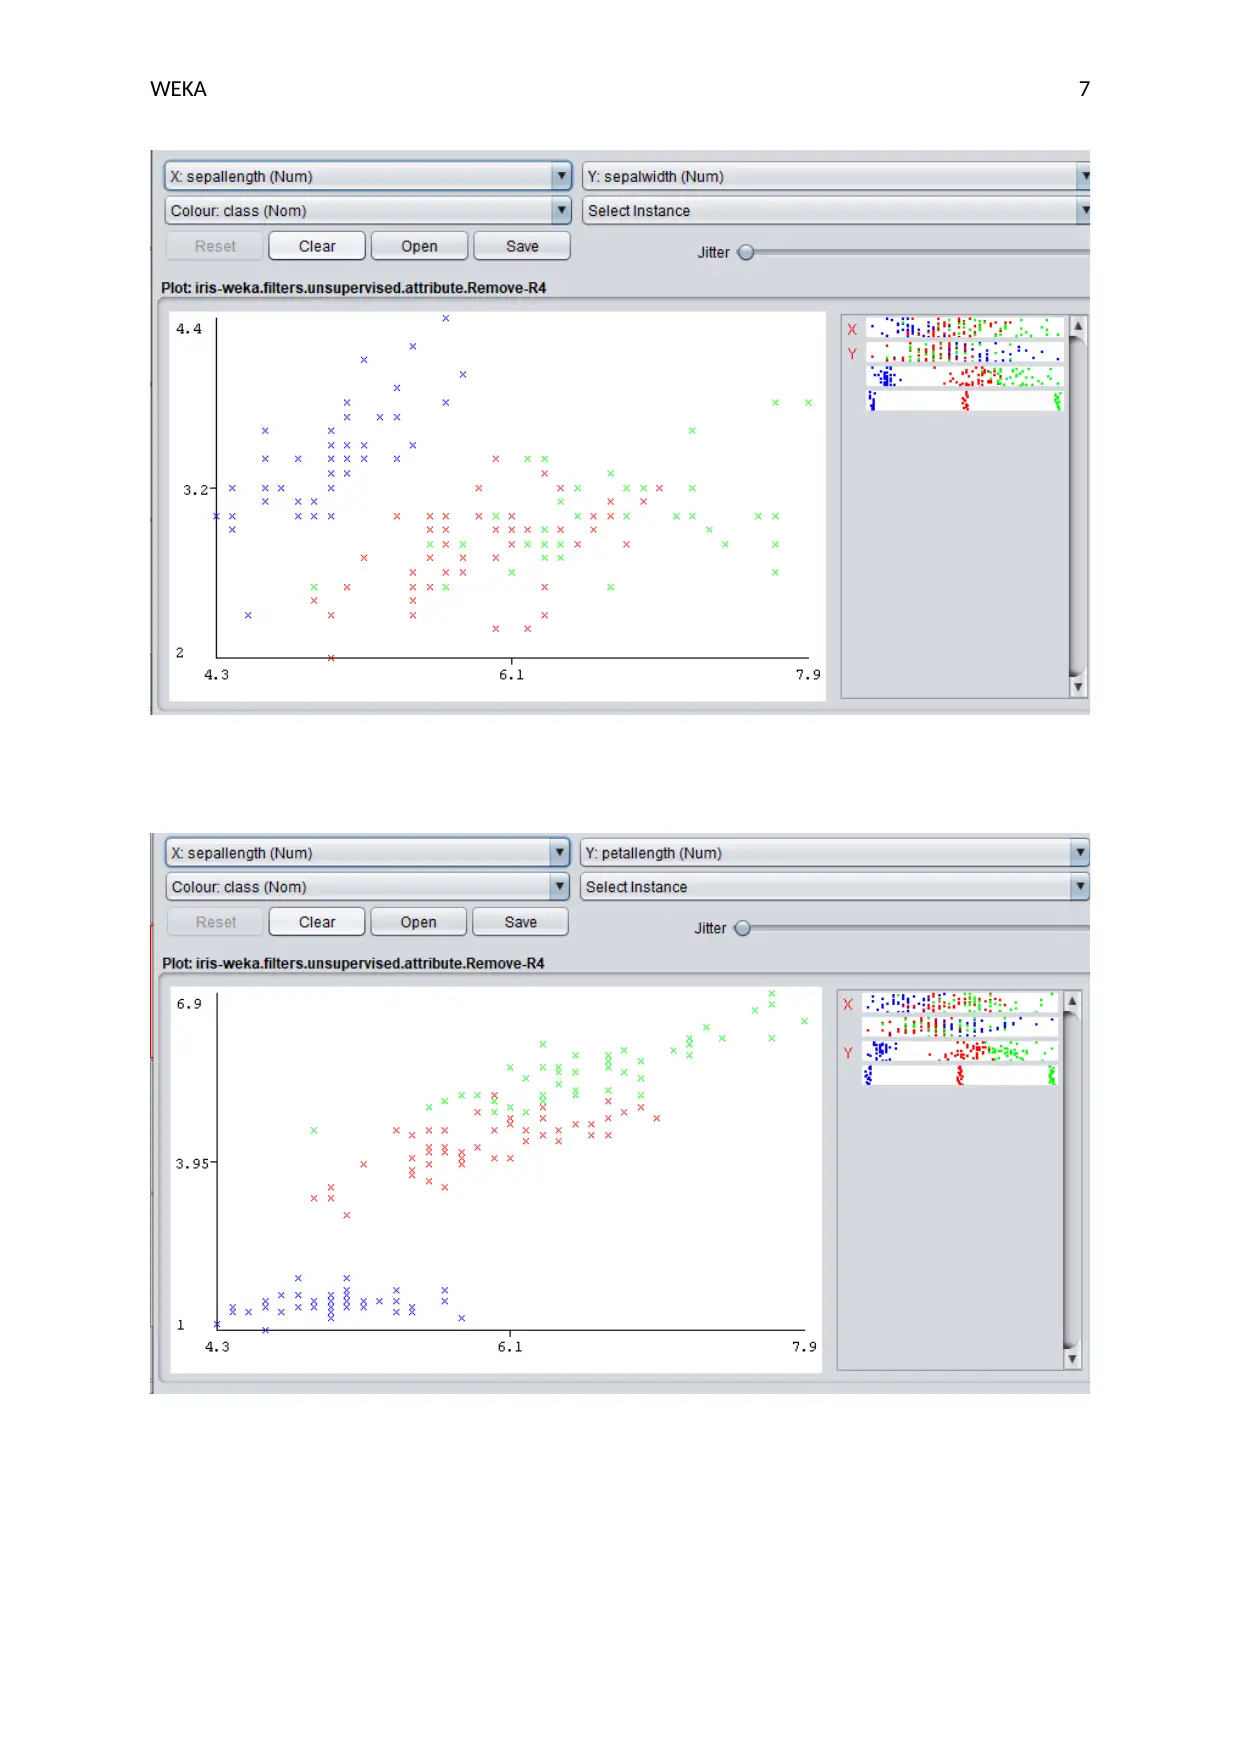
This document presents a solution to a Weka data mining assignment. The solution begins with an analysis of a dataset, including identifying the number of instances, attributes, and classes. It then explores the use of histograms to visualize data distribution and determine the age group with the highest number of samples. The assignment continues by guiding the user through the creation of a modified dataset from the iris.arff file, removing an attribute, and visualizing the data using histograms. Finally, the solution includes a visual analysis of scatter plots to compare and assess class separability between different attributes within the dataset. Screenshots are provided to illustrate each step and the findings of the analysis.
Document Page
Running head: WEKA 1
Data Mining
Name
Institution
Date
Author’s Note
tabler-icon-diamond-filled.svg

Paraphrase This Document

Need a fresh take? Get an instant paraphrase of this document with our AI Paraphraser
Document Page
WEKA 2
Data Mining
Task 1: Weka data exploration
(a) How many instances and attributes (including the class attribute) does this dataset
have?
The dataset has 768 instances and 9 attributes. The attributes (includes 1 class attribute)
are Preg, Plas, Pres, Skin, Insu, Mass, Pedi, Age and Class. The following Figure
(Screenshot from Weka) demonstrates the mentioned 9 attributes and 768 instances.
(b) How many classes are present in the dataset and how many instances are there for
each class?
There are two classes present in the dataset. These are tested_negative and tested_positive.
The tested_positive has 268 instances while tested_negative has 500 instances as indicated
below:
Document Page
WEKA 3
(c) Use histograms (with default settings) to show which age group has the highest
number of samples?
The Age Group with the highest number of samples (267 samples) is 21 to 25.6 years.
The Figure below confirms the finding.
Document Page
WEKA 4
Task 2: Working with a new data file in Weka.
a) Open the iris.arff file from ~/weka/data/ folder in a text editor, then remove
‘petal_width’ attribute and save it as iris.3D.arff. Please make sure that the
Attribute-Relation File Format (.arff) is correctly preserved.
The following is a screenshot of iris.3D. arff:
b) Load this file in workbench and include a screenshot of the histograms (with
default setting) for each attribute in this dataset.
tabler-icon-diamond-filled.svg

Paraphrase This Document

Need a fresh take? Get an instant paraphrase of this document with our AI Paraphraser
Document Page
WEKA 5
Screenshot of the histograms for each attribute in the iris.3D dataset is shown below:
Task 3: Visual analysis
a) Load the file (iris.3D. arff) that you have created in the previous task in
workbench and generate a scatter plot using the ‘visualize’ menu option to show
data distribution for each two attributes in a two-dimensional visualisation.
Two-dimensional visualisation of scatter plots for each attribute is illustrated in the
screenshot below:
Document Page
WEKA 6
b) Visually compare the plots for (sepal_length, sepal_width) and (sepal_length,
petal_length) and comment on which one of them shows a better class
separability in this dataset. Justify your answer with screenshots.
The following visual comparison of the (sepal_length, sepal_width) and
(sepal_length, petal_length) shows that (sepal_length, petal_length) has a better class
separability in the iris.3D dataset.
Document Page
WEKA 7
chevron_up_icon
1 out of 7
circle_padding
hide_on_mobile
zoom_out_icon
[object Object]