Graphical Misrepresentation of Data: Global Warming and COVID-19

Verified

Added on  2022/09/18

|7
|1386
|23
Report
AI Summary
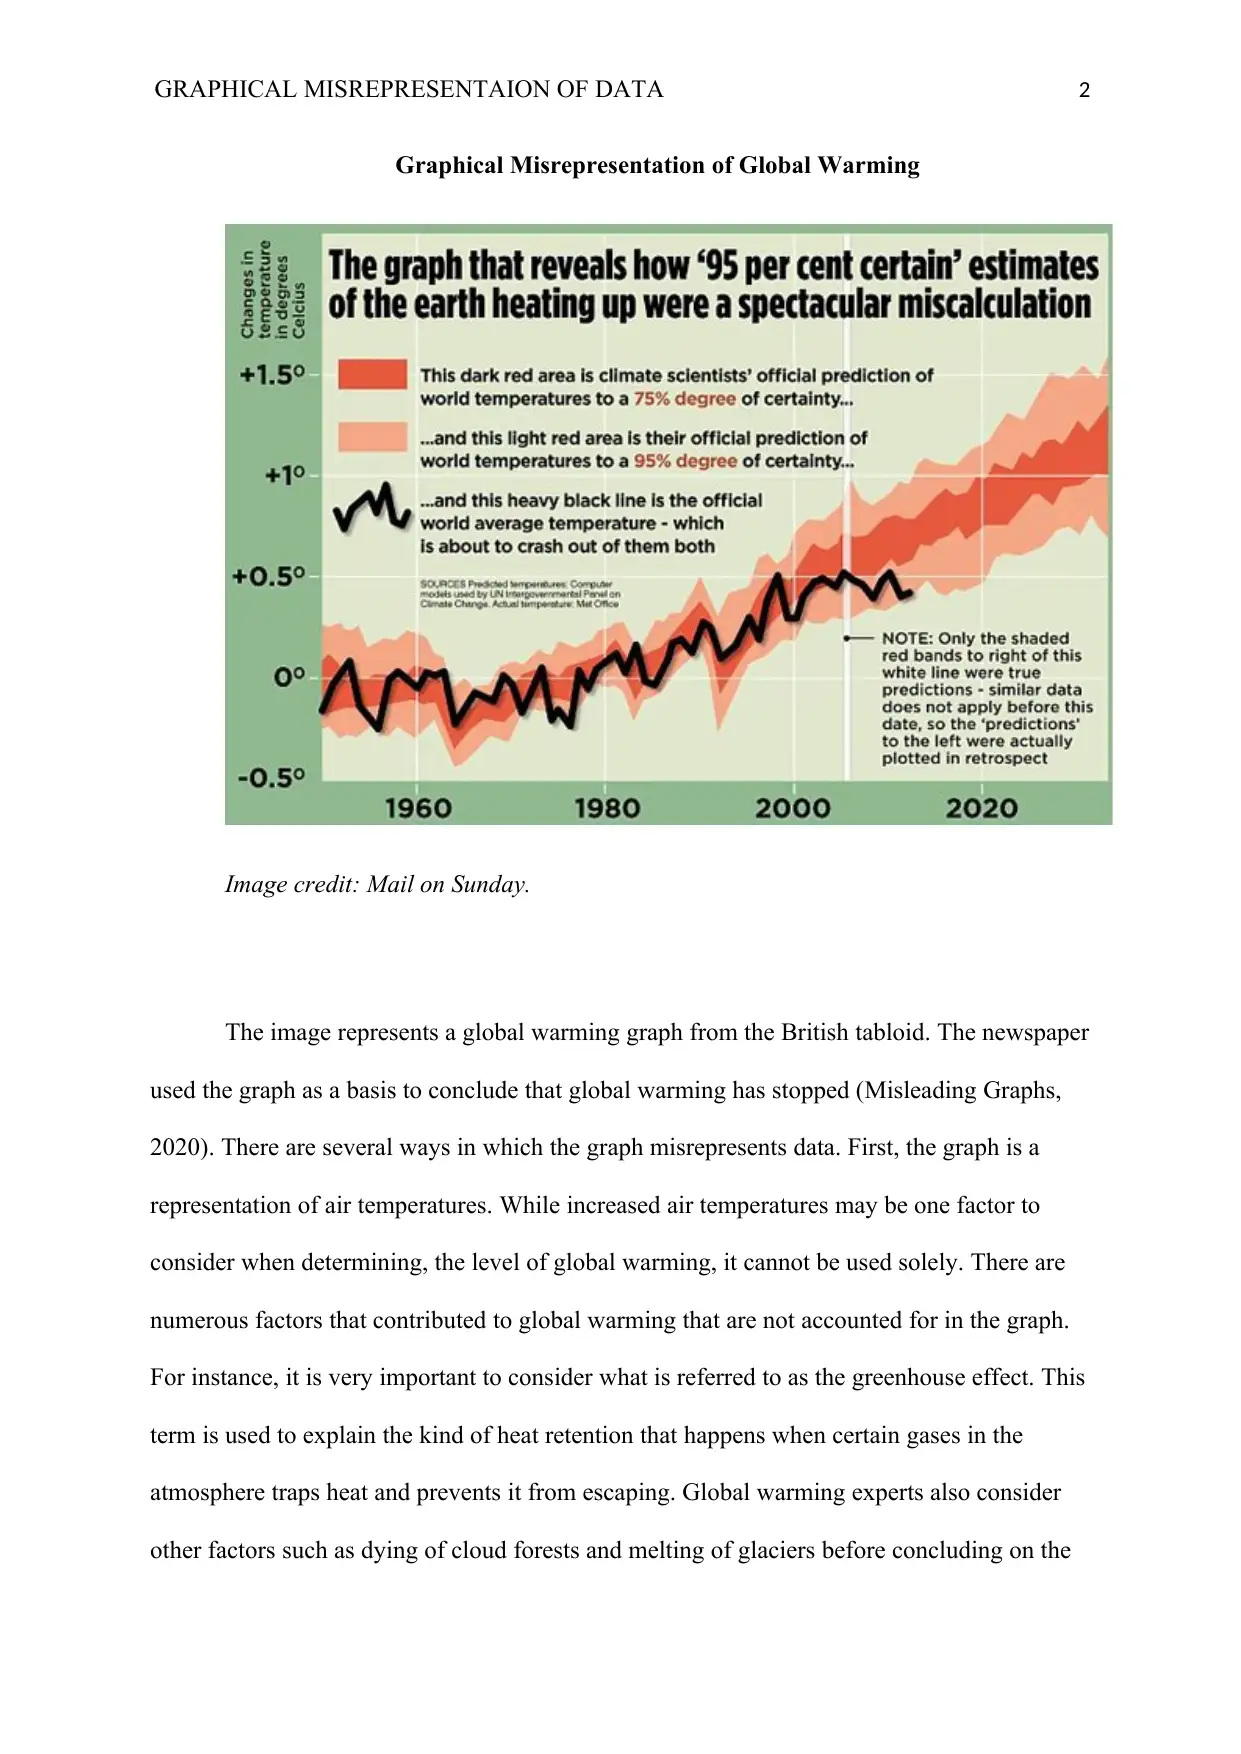
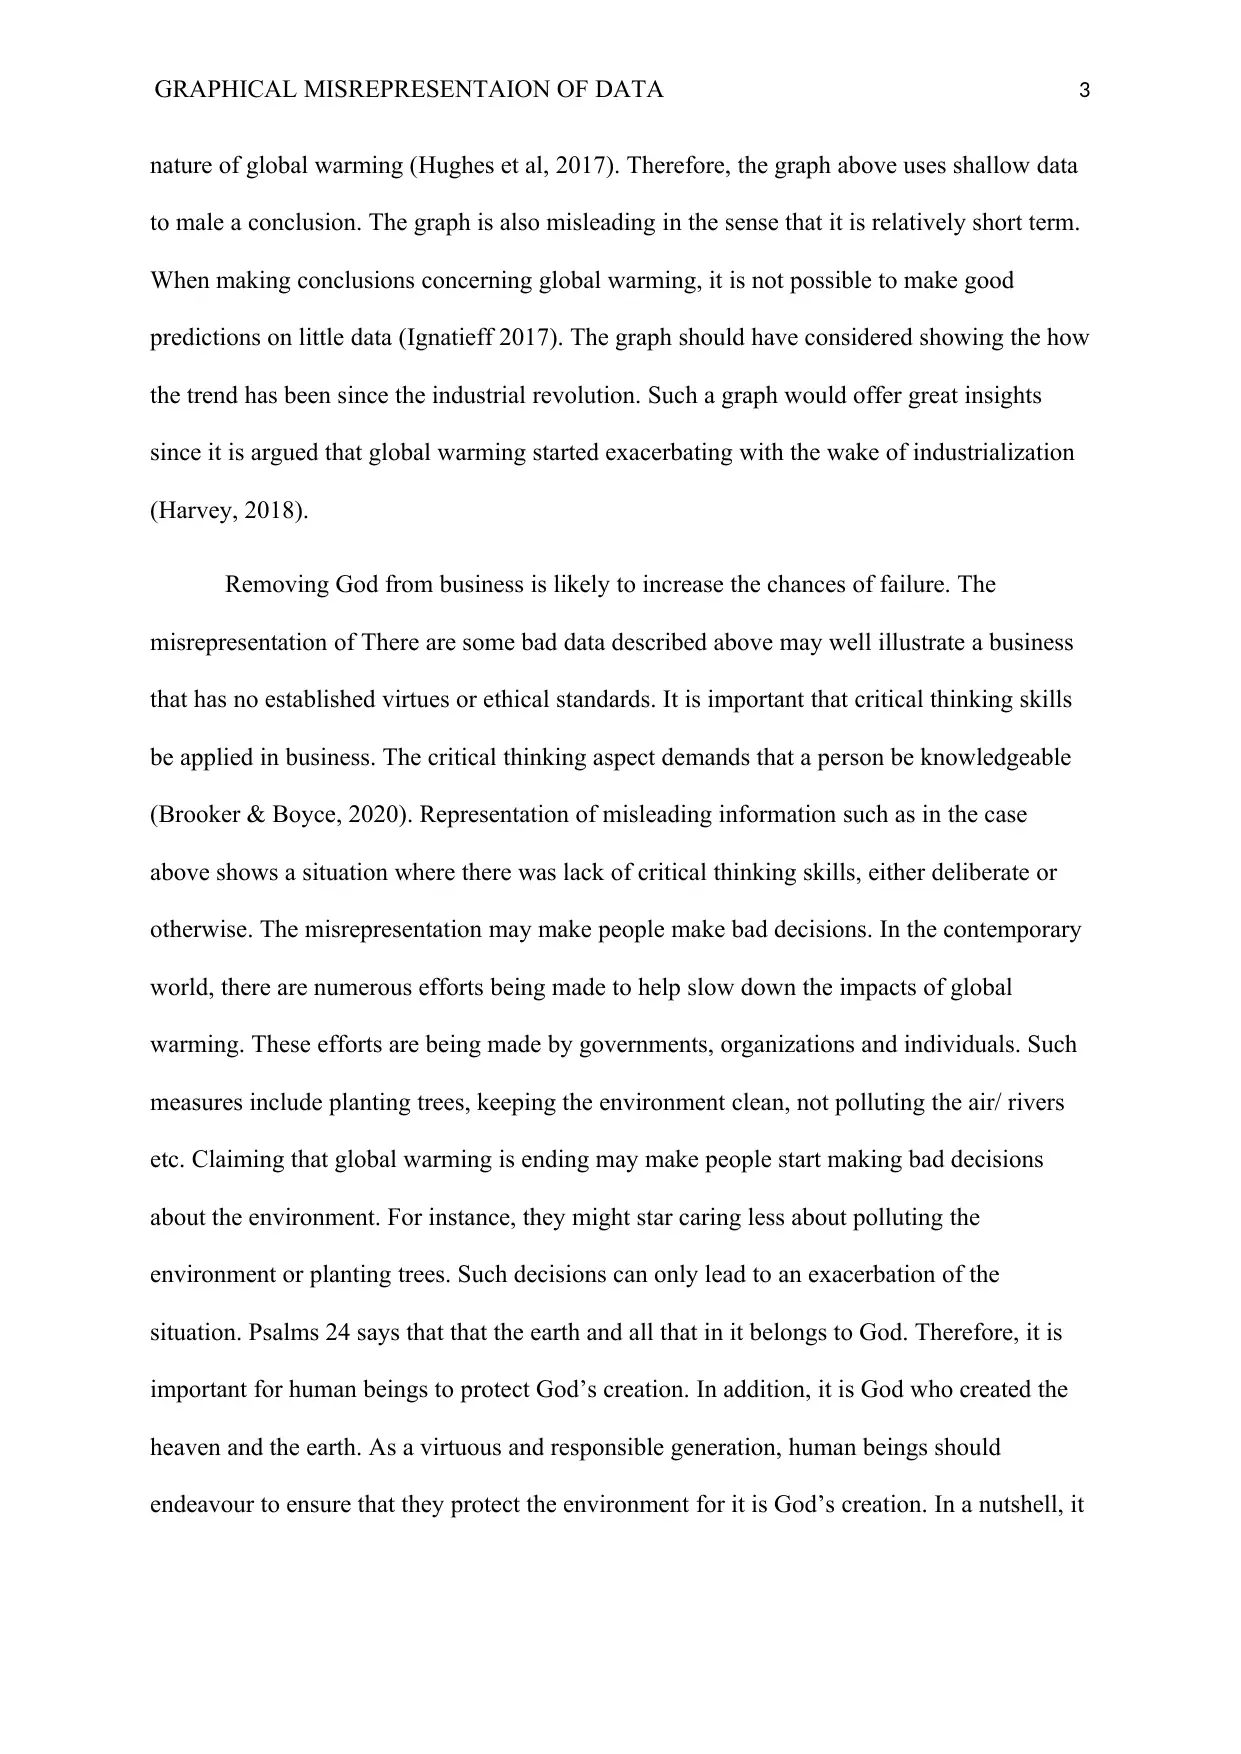
This report examines graphical misrepresentation of data, focusing on examples related to global warming and the COVID-19 pandemic. The analysis highlights how graphs can be misleading due to factors such as the selection of data, short-term perspectives, and the omission of critical information like active versus confirmed COVID-19 cases or considering greenhouse effects and other factors influencing global warming. The report emphasizes the ethical implications of such misrepresentations, particularly their potential to cause panic or lead to poor decision-making. The author advocates for ethical data representation that promotes hope, critical thinking, and a comprehensive understanding of the issues. References to religious texts underscore the importance of virtuous behavior, responsible environmental stewardship, and avoiding the spread of misinformation. The report underscores the importance of considering all factors while interpreting data, and avoiding the use of shallow data to make conclusions.
Document Page
Running head: GRAPHICAL MISREPRESENTAION OF DATA
Graphical Misrepresentation of Data
Student’s Name
Institutional Affiliation
tabler-icon-diamond-filled.svg

Paraphrase This Document

Need a fresh take? Get an instant paraphrase of this document with our AI Paraphraser
Document Page
GRAPHICAL MISREPRESENTAION OF DATA 2
Graphical Misrepresentation of Global Warming
Image credit: Mail on Sunday.
The image represents a global warming graph from the British tabloid. The newspaper
used the graph as a basis to conclude that global warming has stopped (Misleading Graphs,
2020). There are several ways in which the graph misrepresents data. First, the graph is a
representation of air temperatures. While increased air temperatures may be one factor to
consider when determining, the level of global warming, it cannot be used solely. There are
numerous factors that contributed to global warming that are not accounted for in the graph.
For instance, it is very important to consider what is referred to as the greenhouse effect. This
term is used to explain the kind of heat retention that happens when certain gases in the
atmosphere traps heat and prevents it from escaping. Global warming experts also consider
other factors such as dying of cloud forests and melting of glaciers before concluding on the
Document Page
GRAPHICAL MISREPRESENTAION OF DATA 3
nature of global warming (Hughes et al, 2017). Therefore, the graph above uses shallow data
to male a conclusion. The graph is also misleading in the sense that it is relatively short term.
When making conclusions concerning global warming, it is not possible to make good
predictions on little data (Ignatieff 2017). The graph should have considered showing the how
the trend has been since the industrial revolution. Such a graph would offer great insights
since it is argued that global warming started exacerbating with the wake of industrialization
(Harvey, 2018).
Removing God from business is likely to increase the chances of failure. The
misrepresentation of There are some bad data described above may well illustrate a business
that has no established virtues or ethical standards. It is important that critical thinking skills
be applied in business. The critical thinking aspect demands that a person be knowledgeable
(Brooker & Boyce, 2020). Representation of misleading information such as in the case
above shows a situation where there was lack of critical thinking skills, either deliberate or
otherwise. The misrepresentation may make people make bad decisions. In the contemporary
world, there are numerous efforts being made to help slow down the impacts of global
warming. These efforts are being made by governments, organizations and individuals. Such
measures include planting trees, keeping the environment clean, not polluting the air/ rivers
etc. Claiming that global warming is ending may make people start making bad decisions
about the environment. For instance, they might star caring less about polluting the
environment or planting trees. Such decisions can only lead to an exacerbation of the
situation. Psalms 24 says that that the earth and all that in it belongs to God. Therefore, it is
important for human beings to protect God’s creation. In addition, it is God who created the
heaven and the earth. As a virtuous and responsible generation, human beings should
endeavour to ensure that they protect the environment for it is God’s creation. In a nutshell, it
Document Page
GRAPHICAL MISREPRESENTAION OF DATA 4
is misleading for the newspaper to claim that global warming has ended. It would have been
ethical to call on people to protect the environment.
tabler-icon-diamond-filled.svg

Paraphrase This Document

Need a fresh take? Get an instant paraphrase of this document with our AI Paraphraser
Document Page
GRAPHICAL MISREPRESENTAION OF DATA 5
Graphical Misrepresentation of COVID-19
Chart: Joe Rull, Daily Lobo Source: COVID Tracking Project Get the data Created
with Datawrapper
The picture above represents a graph of the COVID -19 confirmed cases in the United
States from March 4th to March 22nd 2020 (A primer on COVID-19 data coverage, 2020).
While the curve may be representing the actual numbers of confirmed cases, it misrepresents
data in several ways. While it is important for a person to represent to the raw data for the
number of positive cases, it could be scary to the average person. The person viewing the
graph may conclude that doom is the only thing to expect. While cases may continue to rise,
it is important to appreciate that the graph leaves a lot of relevant information that prevent the
viewer from seeing the larger picture. For instance, it would be important for such a graph to
show a clear distinction between confirmed cases and the cases that are active. The active
number of cases shows the number of people who are still positive. The graph leaves out
information on the number of recoveries and the number of those who have succumbed to the
virus. While some people have succumbed to the infection, a majority have already
recovered. Therefore, representing all the information would make the graph less scary and
show the actual picture of the pandemic.
Document Page
GRAPHICAL MISREPRESENTAION OF DATA 6
There are some ethical considerations that should have been made before representing
the data this way. First, it would be important for the journalist to acknowledge that the
COVID-19 pandemic has changed the way of life for many people. It has made many people
scared and lose hope. Some people have also been affected by the pandemic either directly or
indirectly. Therefore, it is important to ensure that data is represented correctly and in a way
that does not cause panic. Considering the fact that most people believe in the information
that they come across in the dailies, it would have been ethical for the journalist to represent
the information in a way that brings hope to the readers (Richards & King, 2014). Human
beings are emotional by nature. During this time, it is important to ensure that information is
represented in an ethical manner and does not aggravate the situation. There are people who
may have their mental health affected due to consumption of news that are seemingly sad
(Lipsitch, Swerdlow & Finelli, 2020). Such people may not have been better had the
information been represented in a better way. In the book Mathew chapter 25, Jesus
encourages us not to be anxious about anything. If we are well today, we should not be
worried about tomorrow. It is the duty of every virtuous person to ensure that they do not
panic or make others panic. Rather, every human being should be an ambassador of hope.
Psalms 71 encourages us to put our hope in God. It is important that every person and every
organization submit to God. With this, virtuousness would become a norm and it would be
almost impossible to have such misrepresentations of data.
Document Page
GRAPHICAL MISREPRESENTAION OF DATA 7
References
Misleading Graphs: Real Life Examples - Statistics How To. (2020). Retrieved 10 April
2020, from https://www.statisticshowto.com/misleading-graphs/
Richards, N. M., & King, J. H. (2014). Big data ethics. Wake Forest L. Rev., 49, 393.
Brooker, M. & Boyce J. W. (2020). Virtuous Leaders and Organizations. The DeVoe report.
Ignatieff, M. (2017). The Ordinary Virtues. Harvard University Press.
Hughes, T. P., Kerry, J. T., Álvarez-Noriega, M., Álvarez-Romero, J. G., Anderson, K. D.,
Baird, A. H. & Bridge, T. C. (2017). Global warming and recurrent mass bleaching of
corals. Nature, 543(7645), 373-377.
Harvey, L. D. (2018). Global warming. Routledge.
Lipsitch, M., Swerdlow, D. L., & Finelli, L. (2020). Defining the epidemiology of Covid-19
—studies needed. New England Journal of Medicine.
A primer on COVID-19 data coverage. (2020). Retrieved 10 April 2020, from
https://www.dailylobo.com/article/2020/03/opinion-bad-graphs-suck-a-primer-on-
covid-19-data-coverage
chevron_up_icon
1 out of 7
circle_padding
hide_on_mobile
zoom_out_icon
[object Object]