Data Model Development and Implementation for Healthcare Database
VerifiedAdded on 2024/04/26
|27
|2238
|305
Practical Assignment
AI Summary
This assignment focuses on the development and implementation of a data model for Knox Private Hospital. It involves analyzing user requirements to identify entities such as Patient, Doctor, Prescribe, Drug, and Pharmacy. The solution details the attributes for each entity, outlines the relationships between them, and determines functional dependencies. The tables are normalized to 3NF, explaining each step. An entity-relationship (E-R) diagram visually represents the database structure. The model is built using MS Access, with tables populated with data and relationships created. SQL queries are written and executed to answer specific questions, including retrieving doctor details and patient information, with screenshots of the outputs provided. This document is available on Desklib, a platform offering study tools and solved assignments.

DATA MODEL DEVELOPMENT
AND IMPLEMENTATION
Assignment 2
AND IMPLEMENTATION
Assignment 2
Paraphrase This Document
Need a fresh take? Get an instant paraphrase of this document with our AI Paraphraser
Contents
Question 1:............................................................................................................................................3
Part A:................................................................................................................................................3
Part B:................................................................................................................................................4
Part C:................................................................................................................................................5
Part D:................................................................................................................................................6
Part E:................................................................................................................................................7
Question2............................................................................................................................................10
Part A:..............................................................................................................................................10
Question 3...........................................................................................................................................12
Question4............................................................................................................................................19
Part A:..............................................................................................................................................23
Part B:..............................................................................................................................................24
Part C:...............................................................................................................................................25
References...........................................................................................................................................26
1
List of figure
Figure 1: Relationship diagram..............................................................................................................5
Figure 3: Conceptual diagram..............................................................................................................10
Figure 2: ER Diagram...........................................................................................................................11
Figure 4: Design view...........................................................................................................................12
Figure 5: Table View............................................................................................................................12
Figure 6: Form.....................................................................................................................................13
Figure 7: Table view.............................................................................................................................13
Figure 8: Design view...........................................................................................................................14
Figure 9: Form view.............................................................................................................................14
Figure 10: Table view...........................................................................................................................15
Figure 11: Design view.........................................................................................................................15
Figure 12 Form....................................................................................................................................16
Figure 13: Table view...........................................................................................................................16
Figure 14: Design view.........................................................................................................................17
Figure 15: Form...................................................................................................................................17
Figure 16: Table view...........................................................................................................................18
Figure 17: Design view.........................................................................................................................18
Figure 18: Form...................................................................................................................................18
Figure 19: Design view.........................................................................................................................19
Figure 20: Table view...........................................................................................................................19
Figure 21: Design view.........................................................................................................................20
Figure 22: Table view...........................................................................................................................20
Figure 23: Design view.........................................................................................................................20
Figure 24: Table view...........................................................................................................................21
Figure 25: Design view.........................................................................................................................21
Figure 26: Table view...........................................................................................................................21
Figure 27: Design view.........................................................................................................................22
Figure 28: Table view...........................................................................................................................22
Figure 29: Query1................................................................................................................................23
Figure 30: Query2................................................................................................................................24
Figure 31: Query 3...............................................................................................................................25
2
⊘ This is a preview!⊘
Do you want full access?
Subscribe today to unlock all pages.
Trusted by 1+ million students worldwide
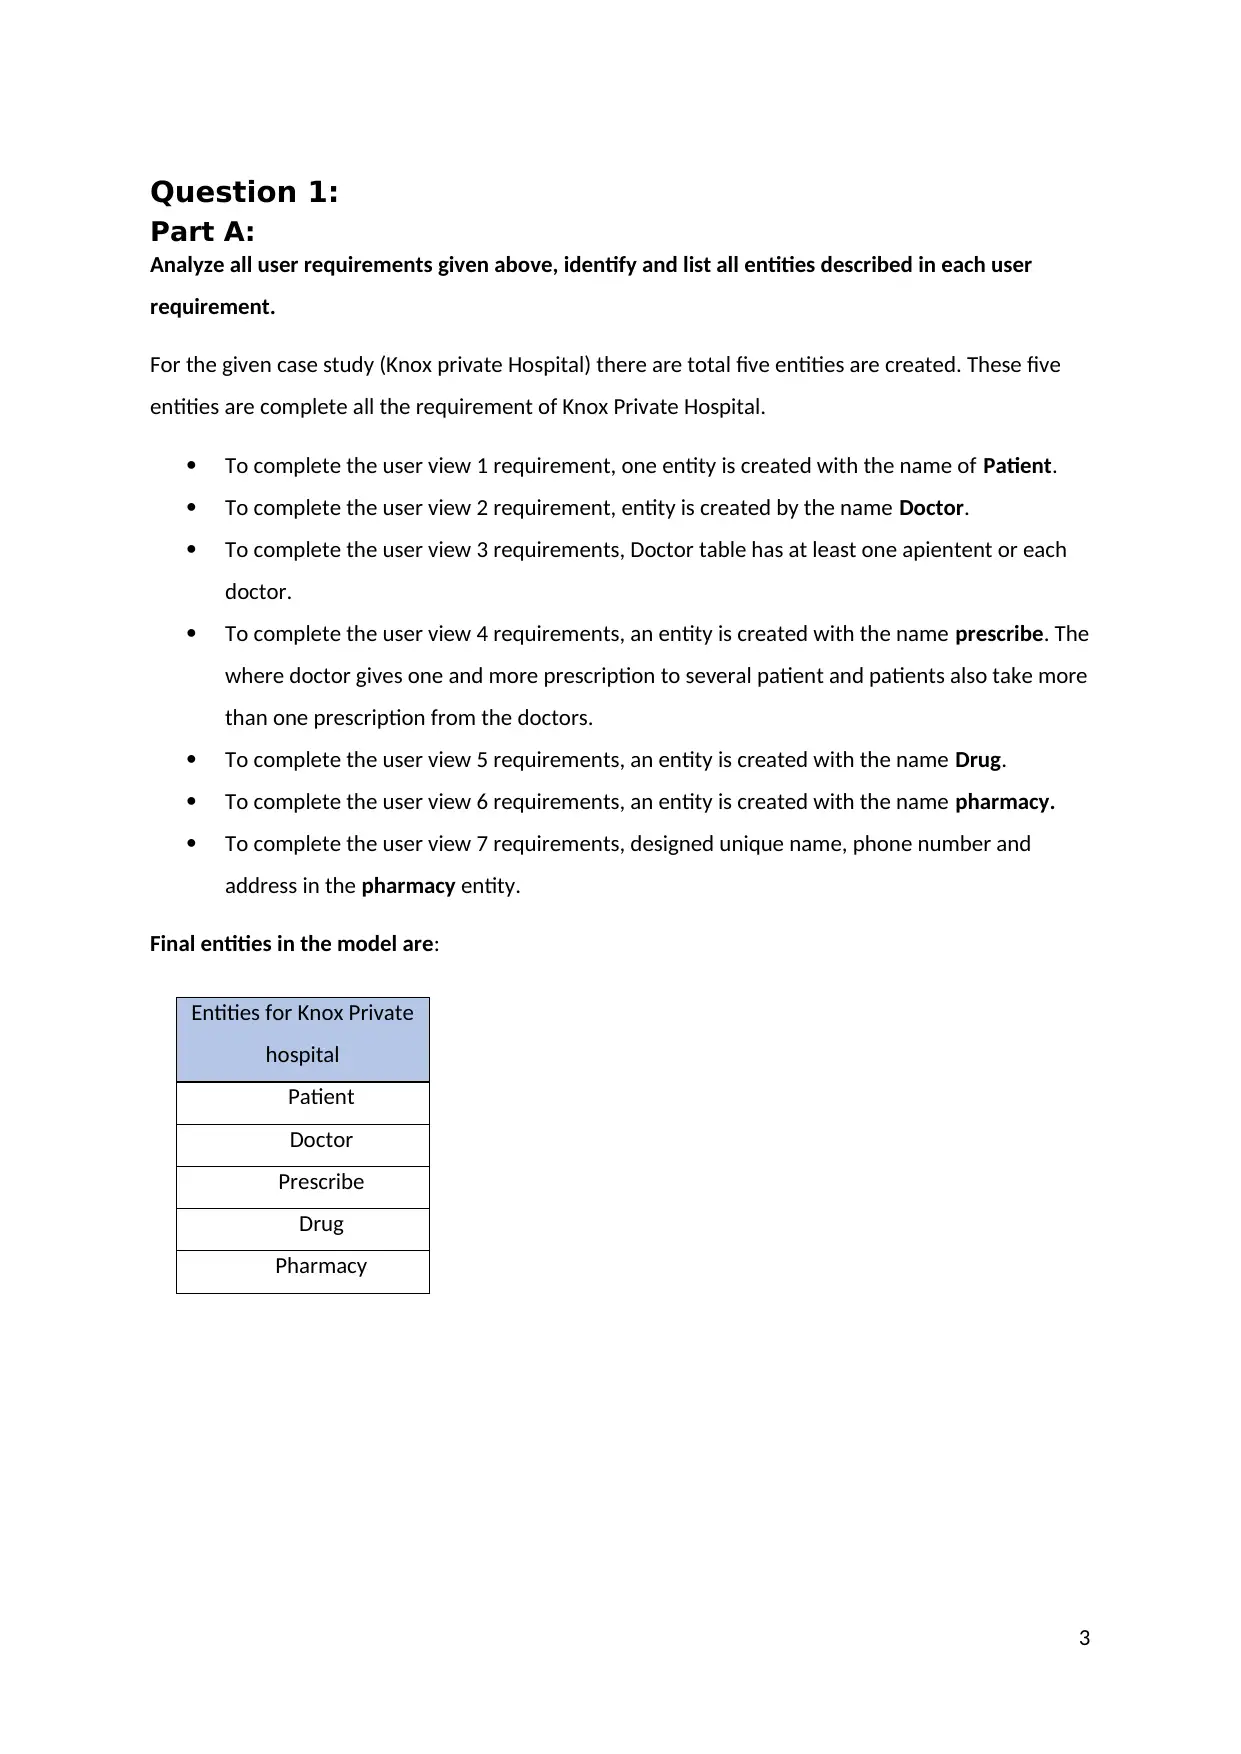
Question 1:
Part A:
Analyze all user requirements given above, identify and list all entities described in each user
requirement.
For the given case study (Knox private Hospital) there are total five entities are created. These five
entities are complete all the requirement of Knox Private Hospital.
To complete the user view 1 requirement, one entity is created with the name of Patient.
To complete the user view 2 requirement, entity is created by the name Doctor.
To complete the user view 3 requirements, Doctor table has at least one apientent or each
doctor.
To complete the user view 4 requirements, an entity is created with the name prescribe. The
where doctor gives one and more prescription to several patient and patients also take more
than one prescription from the doctors.
To complete the user view 5 requirements, an entity is created with the name Drug.
To complete the user view 6 requirements, an entity is created with the name pharmacy.
To complete the user view 7 requirements, designed unique name, phone number and
address in the pharmacy entity.
Final entities in the model are:
3
Entities for Knox Private
hospital
Patient
Doctor
Prescribe
Drug
Pharmacy
Paraphrase This Document
Need a fresh take? Get an instant paraphrase of this document with our AI Paraphraser
Part B:
Add attributes to these entities and represent these entities (or Tables) and attributes as a
collection of Tables and attributes
In the below shows the attributes of the various tables that are created in the Knox private hospital
database system.
1. Patient (Patient_ID (PK), Patient_name, Patient_Address, Patient_Number, Patient_Age)
2. Doctor (Doctor_ID (PK), Doctor_Name, Doctor_specialty, Year_Of_Experiance,
Contact_Number, Patient_ID)
3. Pharmacy (pharmacy_Name (PK), Drug_ID, Patient_ID, Location, Cost, Phone_Number)
4. Drug (Drug_ID (PK), Patient_ID, Trade_Name, Formula)
5. Prescription (Presciption_ID (PK), Doctor_ID, Patient_ID, pharmacy_Name)
4
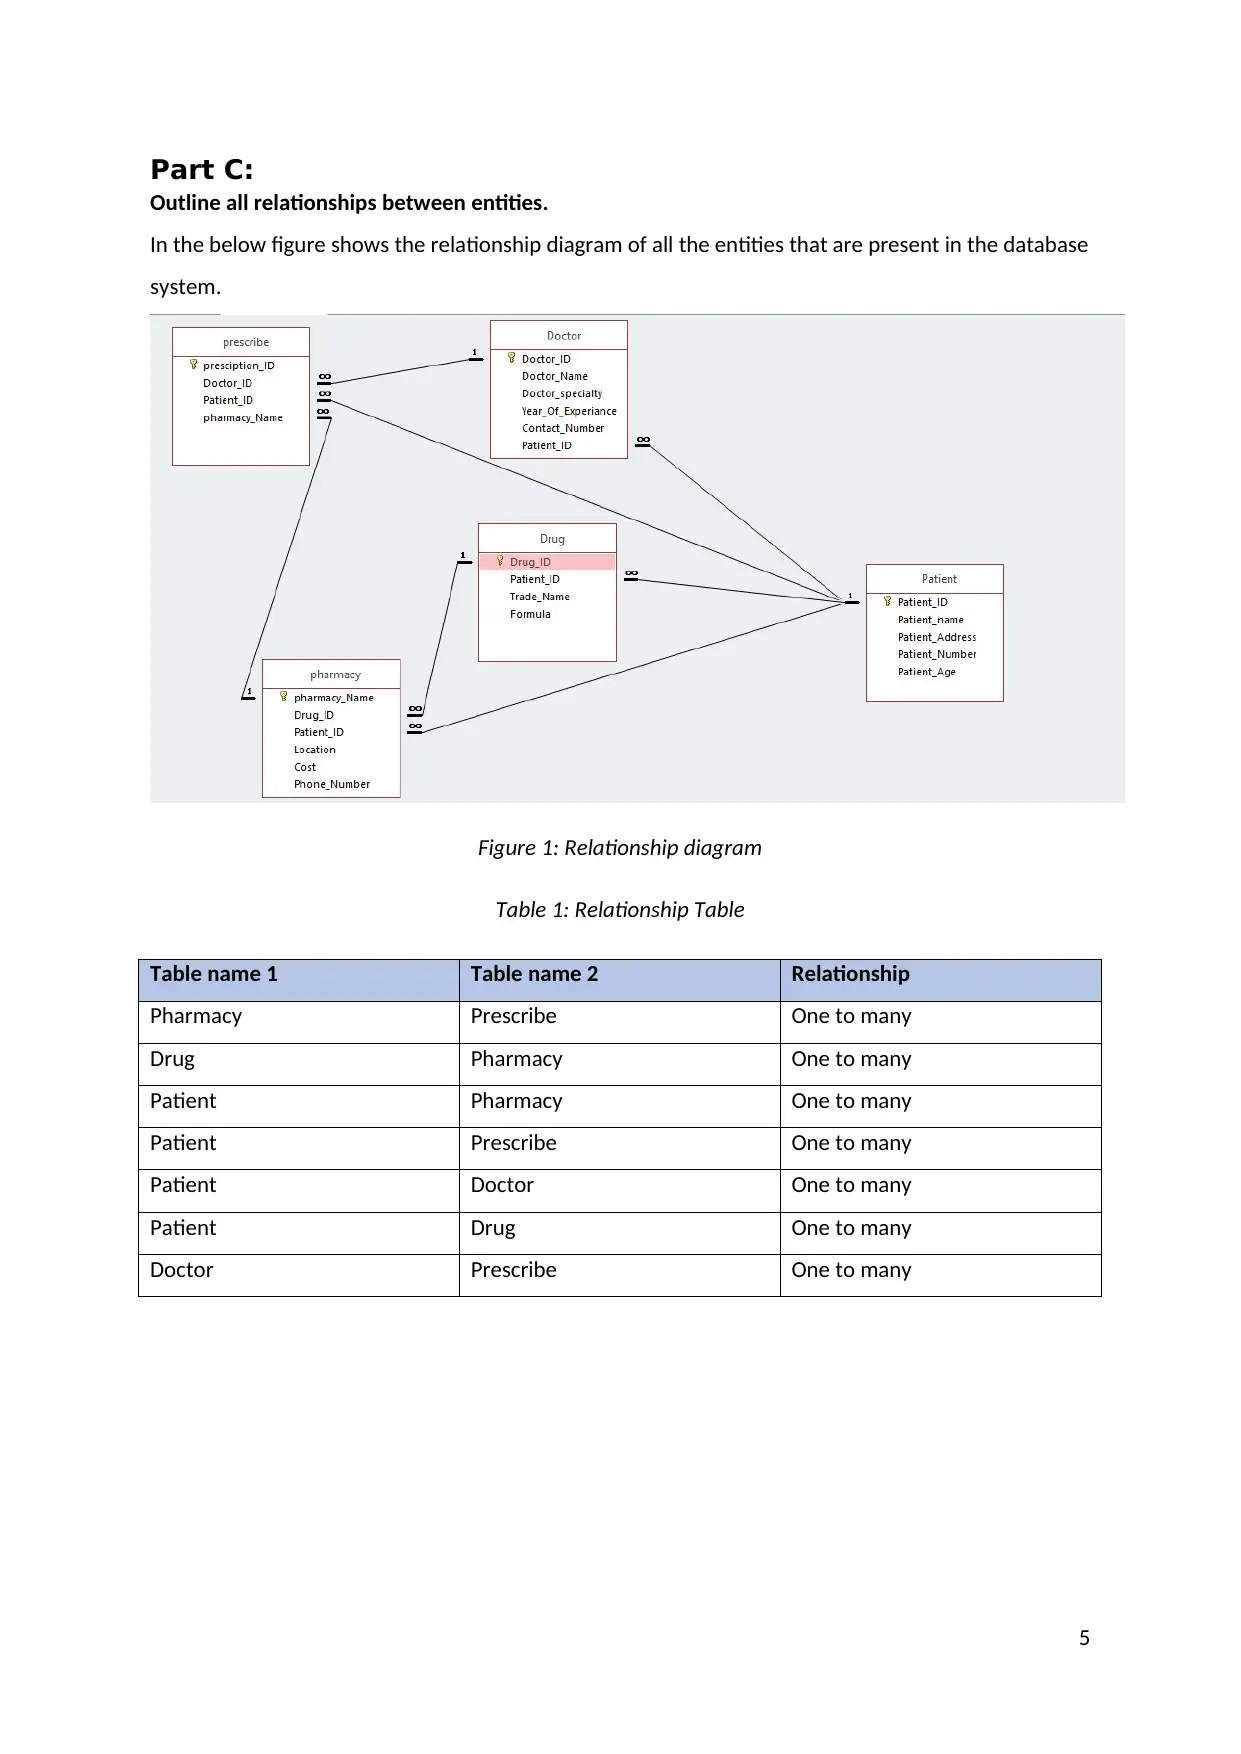
Part C:
Outline all relationships between entities.
In the below figure shows the relationship diagram of all the entities that are present in the database
system.
Figure 1: Relationship diagram
Table 1: Relationship Table
Table name 1 Table name 2 Relationship
Pharmacy Prescribe One to many
Drug Pharmacy One to many
Patient Pharmacy One to many
Patient Prescribe One to many
Patient Doctor One to many
Patient Drug One to many
Doctor Prescribe One to many
5
⊘ This is a preview!⊘
Do you want full access?
Subscribe today to unlock all pages.
Trusted by 1+ million students worldwide
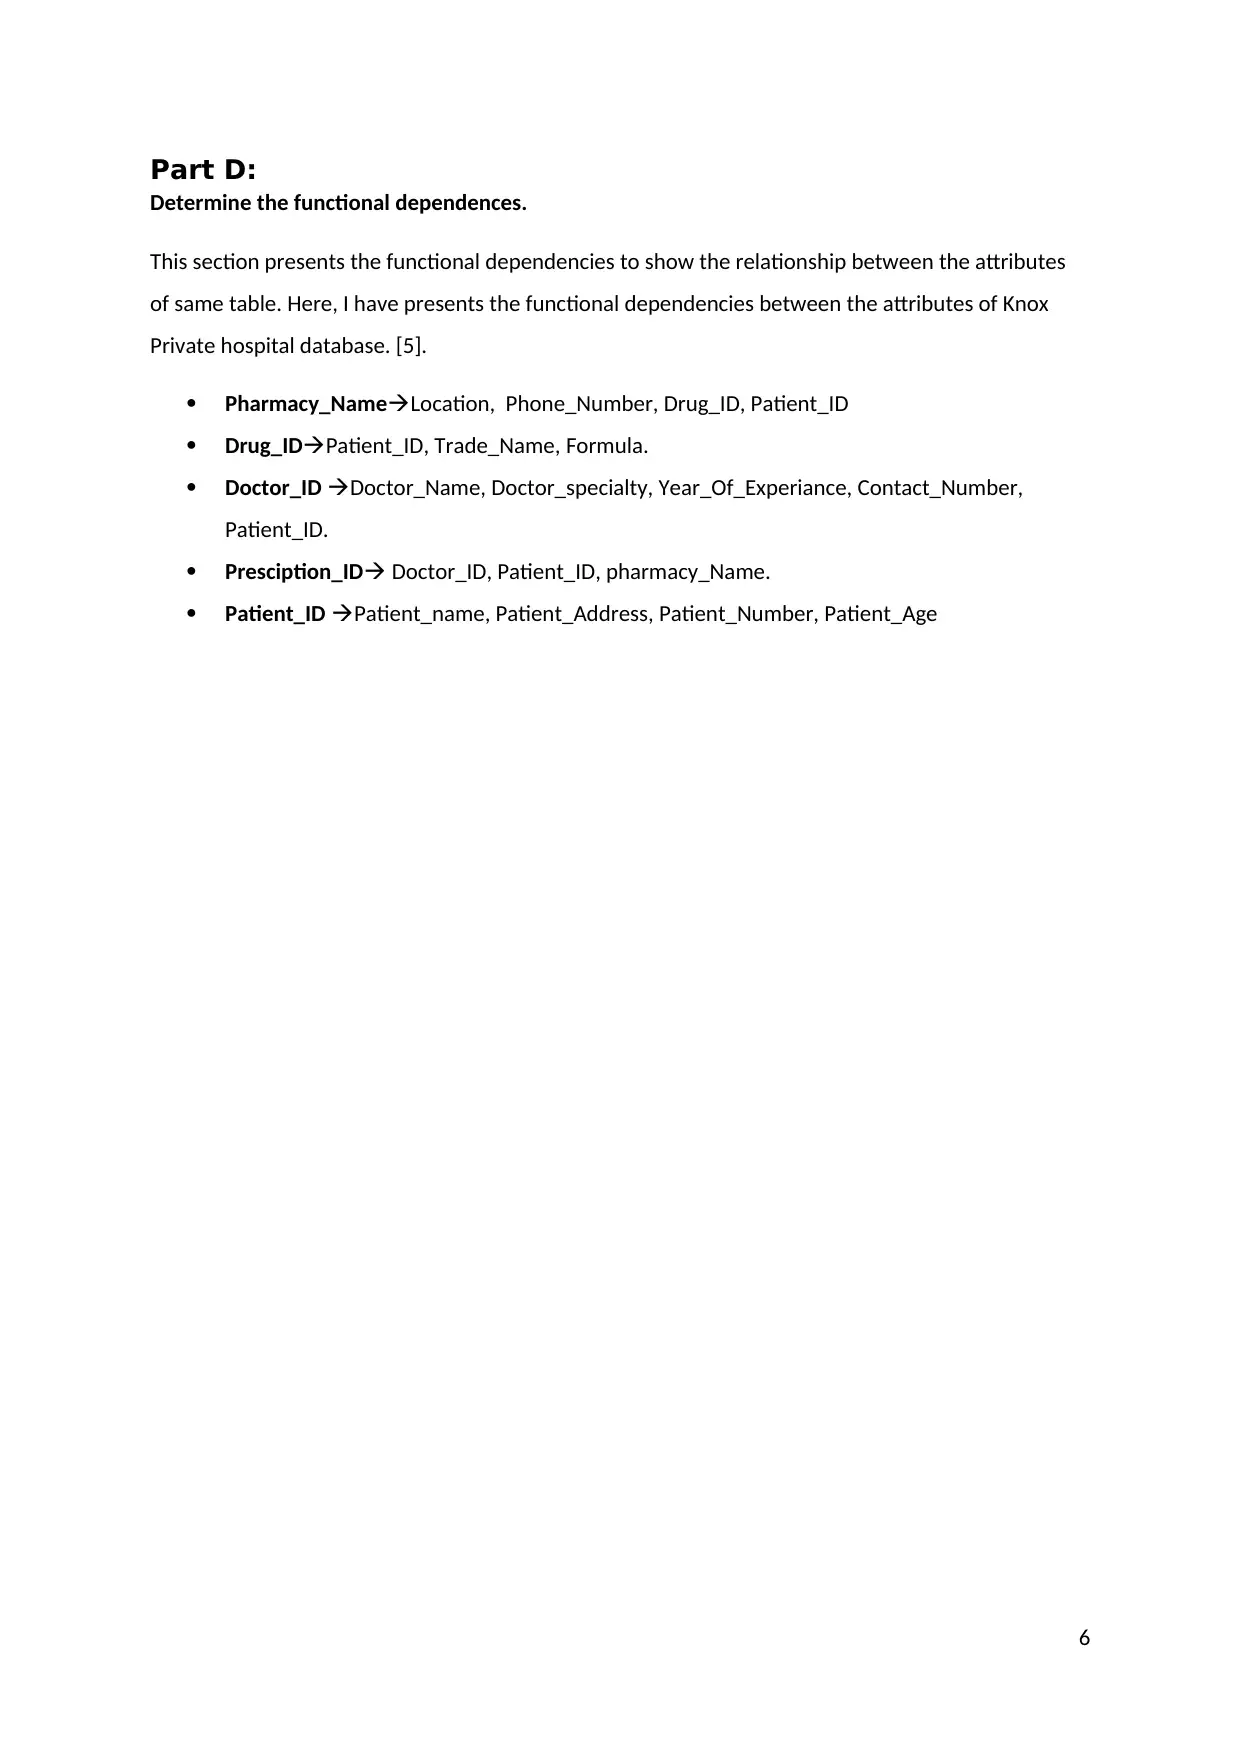
Part D:
Determine the functional dependences.
This section presents the functional dependencies to show the relationship between the attributes
of same table. Here, I have presents the functional dependencies between the attributes of Knox
Private hospital database. [5].
Pharmacy_NameLocation, Phone_Number, Drug_ID, Patient_ID
Drug_IDPatient_ID, Trade_Name, Formula.
Doctor_ID Doctor_Name, Doctor_specialty, Year_Of_Experiance, Contact_Number,
Patient_ID.
Presciption_ID Doctor_ID, Patient_ID, pharmacy_Name.
Patient_ID Patient_name, Patient_Address, Patient_Number, Patient_Age
6
Paraphrase This Document
Need a fresh take? Get an instant paraphrase of this document with our AI Paraphraser
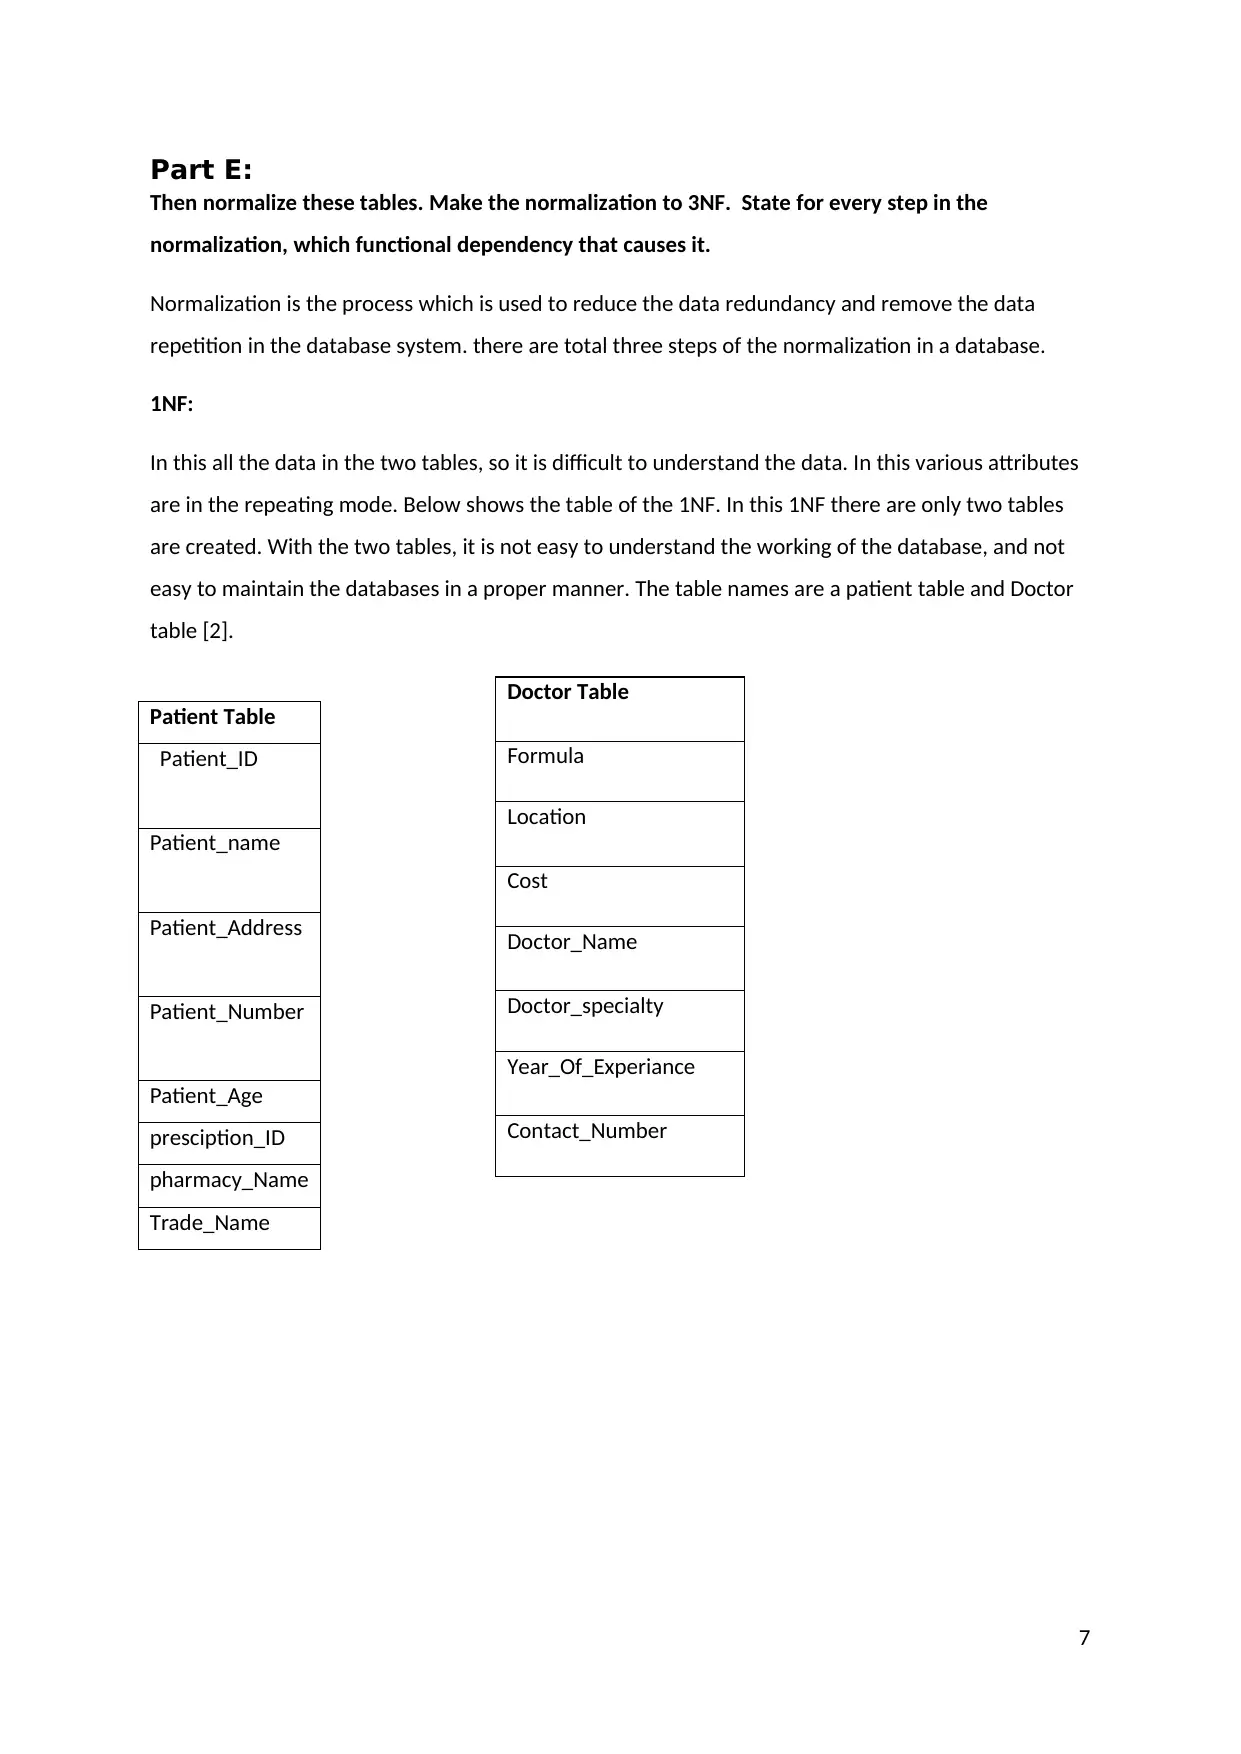
Part E:
Then normalize these tables. Make the normalization to 3NF. State for every step in the
normalization, which functional dependency that causes it.
Normalization is the process which is used to reduce the data redundancy and remove the data
repetition in the database system. there are total three steps of the normalization in a database.
1NF:
In this all the data in the two tables, so it is difficult to understand the data. In this various attributes
are in the repeating mode. Below shows the table of the 1NF. In this 1NF there are only two tables
are created. With the two tables, it is not easy to understand the working of the database, and not
easy to maintain the databases in a proper manner. The table names are a patient table and Doctor
table [2].
7
Patient Table
Patient_ID
Patient_name
Patient_Address
Patient_Number
Patient_Age
presciption_ID
pharmacy_Name
Trade_Name
Doctor Table
Formula
Location
Cost
Doctor_Name
Doctor_specialty
Year_Of_Experiance
Contact_Number
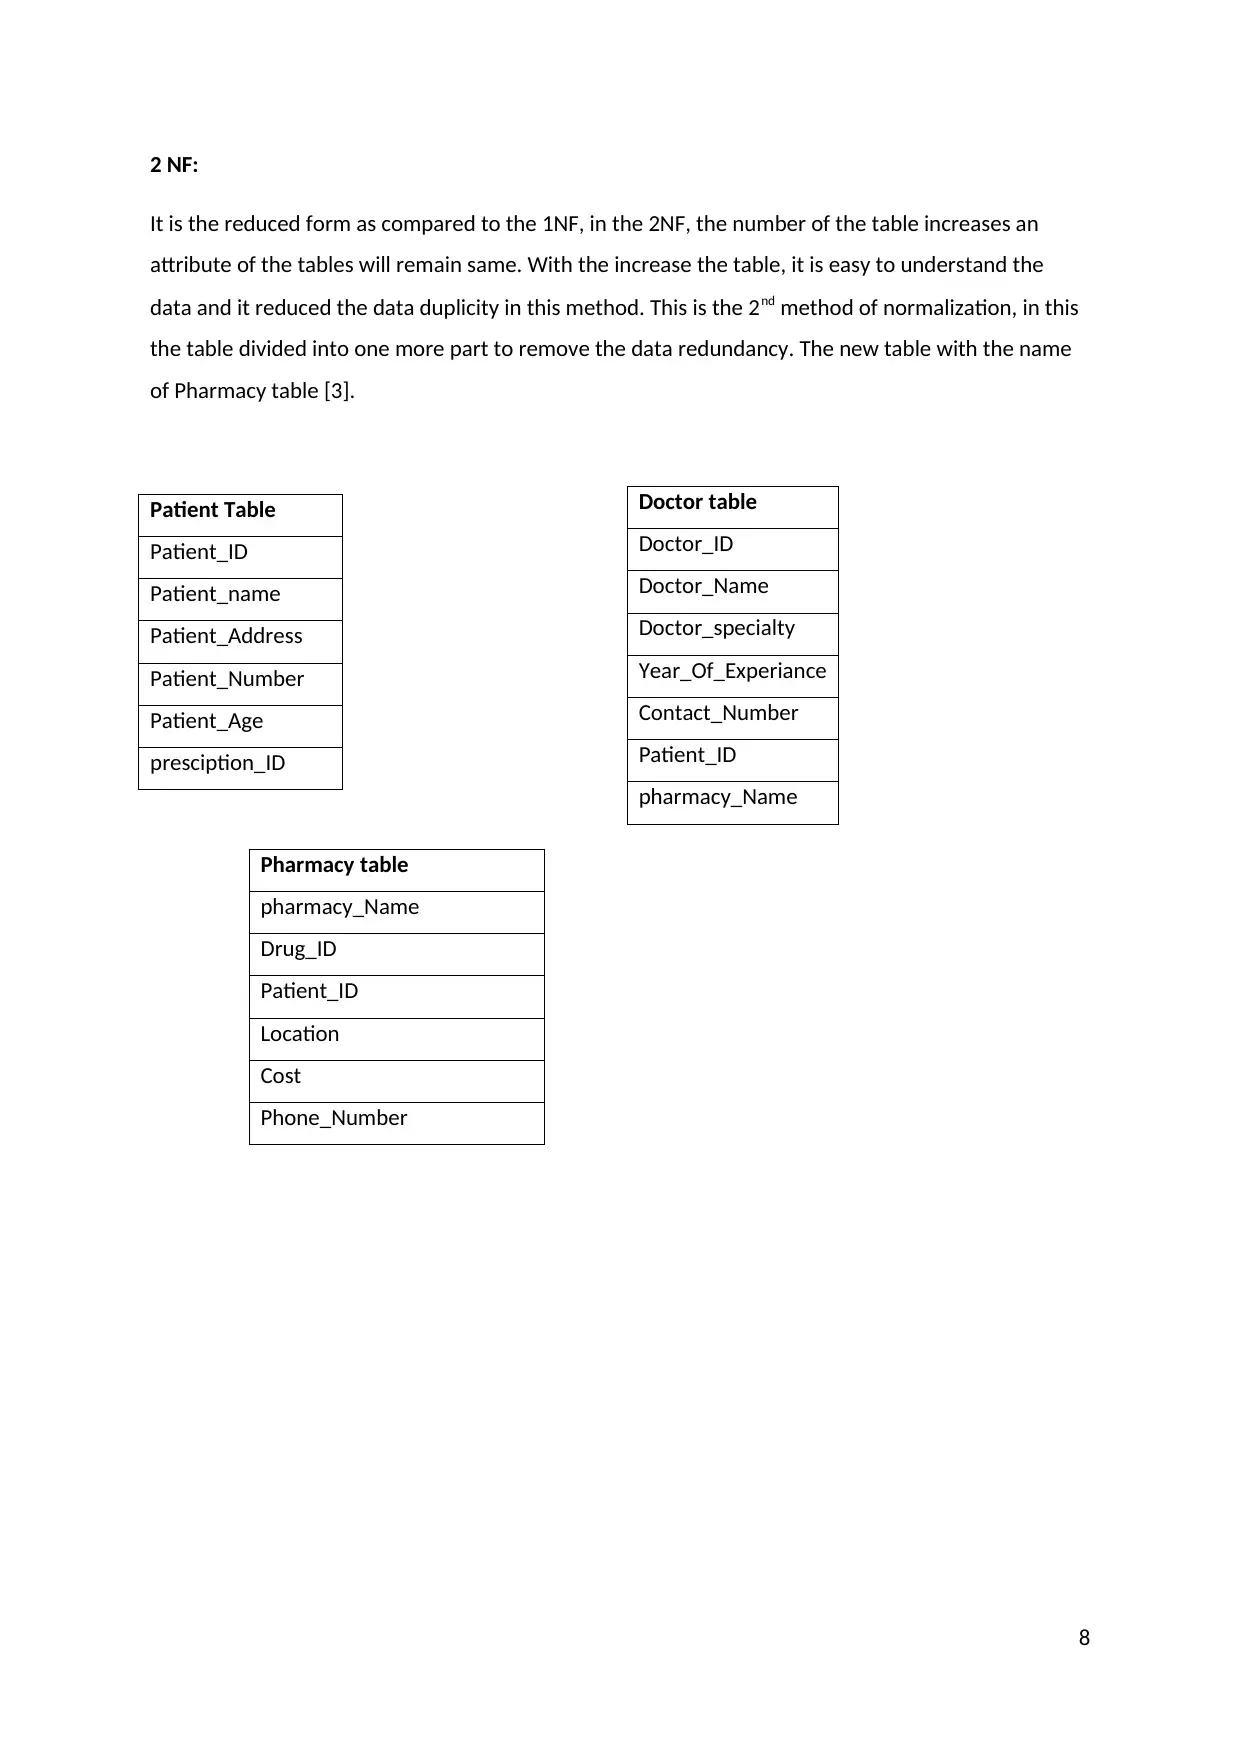
2 NF:
It is the reduced form as compared to the 1NF, in the 2NF, the number of the table increases an
attribute of the tables will remain same. With the increase the table, it is easy to understand the
data and it reduced the data duplicity in this method. This is the 2nd method of normalization, in this
the table divided into one more part to remove the data redundancy. The new table with the name
of Pharmacy table [3].
Patient Table
Patient_ID
Patient_name
Patient_Address
Patient_Number
Patient_Age
presciption_ID
Pharmacy table
pharmacy_Name
Drug_ID
Patient_ID
Location
Cost
Phone_Number
8
Doctor table
Doctor_ID
Doctor_Name
Doctor_specialty
Year_Of_Experiance
Contact_Number
Patient_ID
pharmacy_Name
⊘ This is a preview!⊘
Do you want full access?
Subscribe today to unlock all pages.
Trusted by 1+ million students worldwide
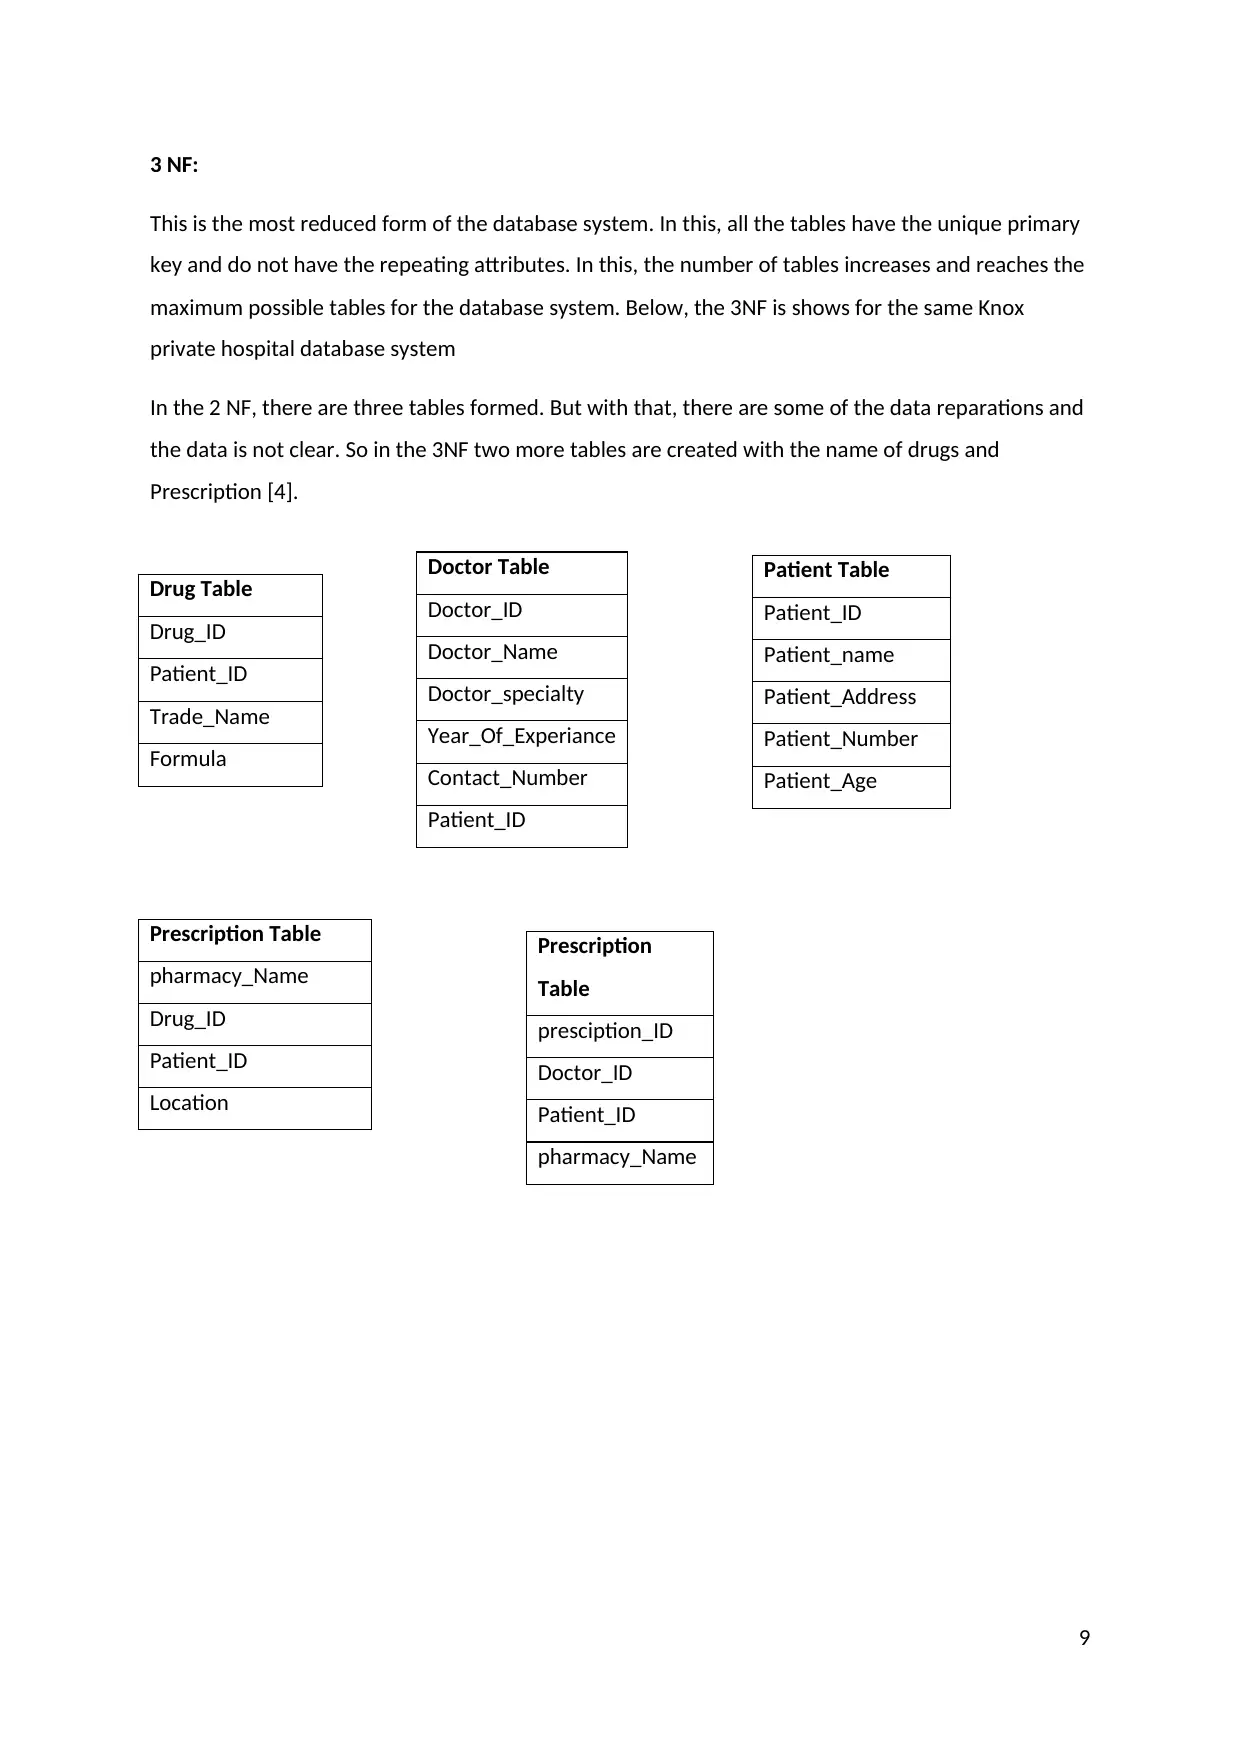
3 NF:
This is the most reduced form of the database system. In this, all the tables have the unique primary
key and do not have the repeating attributes. In this, the number of tables increases and reaches the
maximum possible tables for the database system. Below, the 3NF is shows for the same Knox
private hospital database system
In the 2 NF, there are three tables formed. But with that, there are some of the data reparations and
the data is not clear. So in the 3NF two more tables are created with the name of drugs and
Prescription [4].
9
Patient Table
Patient_ID
Patient_name
Patient_Address
Patient_Number
Patient_Age
Drug Table
Drug_ID
Patient_ID
Trade_Name
Formula
Doctor Table
Doctor_ID
Doctor_Name
Doctor_specialty
Year_Of_Experiance
Contact_Number
Patient_ID
Prescription Table
pharmacy_Name
Drug_ID
Patient_ID
Location
Prescription
Table
presciption_ID
Doctor_ID
Patient_ID
pharmacy_Name
Paraphrase This Document
Need a fresh take? Get an instant paraphrase of this document with our AI Paraphraser
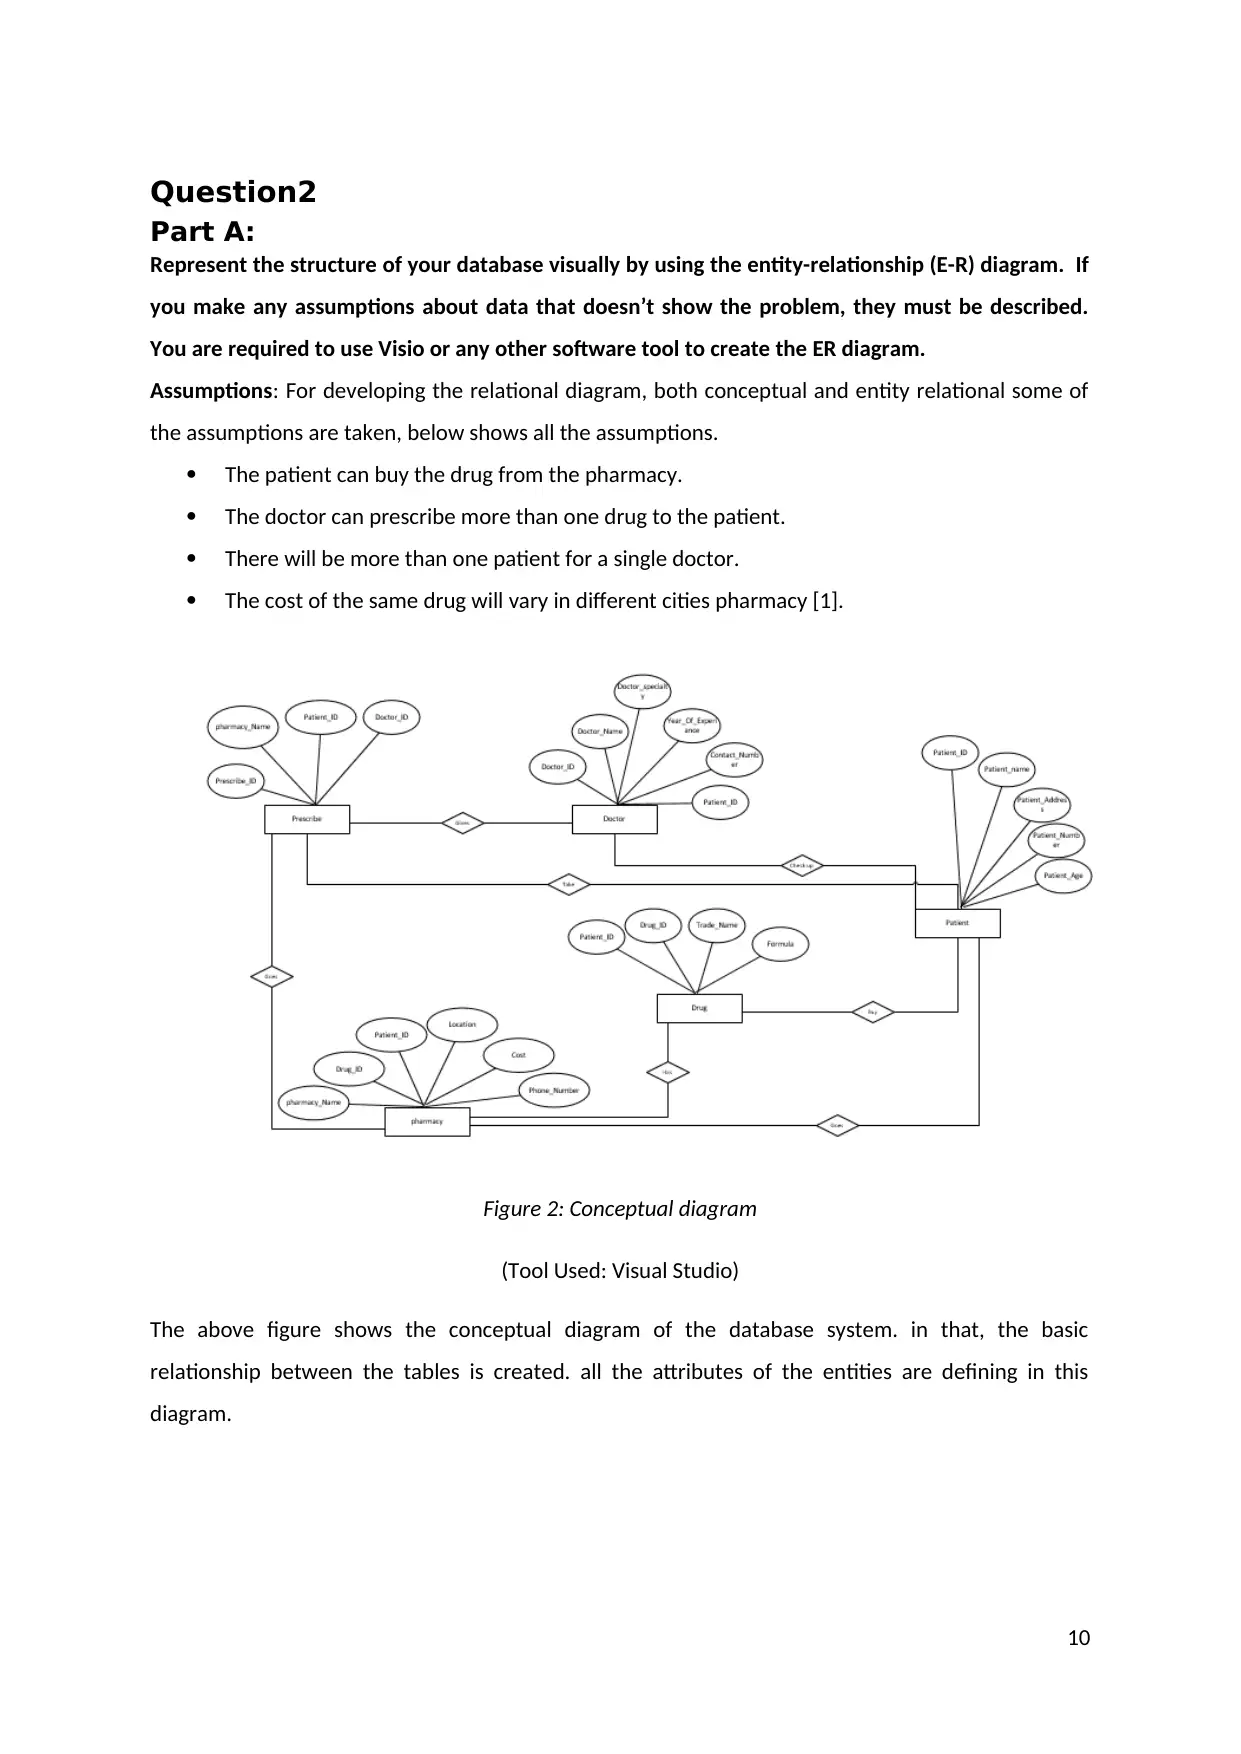
Question2
Part A:
Represent the structure of your database visually by using the entity-relationship (E-R) diagram. If
you make any assumptions about data that doesn’t show the problem, they must be described.
You are required to use Visio or any other software tool to create the ER diagram.
Assumptions: For developing the relational diagram, both conceptual and entity relational some of
the assumptions are taken, below shows all the assumptions.
The patient can buy the drug from the pharmacy.
The doctor can prescribe more than one drug to the patient.
There will be more than one patient for a single doctor.
The cost of the same drug will vary in different cities pharmacy [1].
Figure 2: Conceptual diagram
(Tool Used: Visual Studio)
The above figure shows the conceptual diagram of the database system. in that, the basic
relationship between the tables is created. all the attributes of the entities are defining in this
diagram.
10
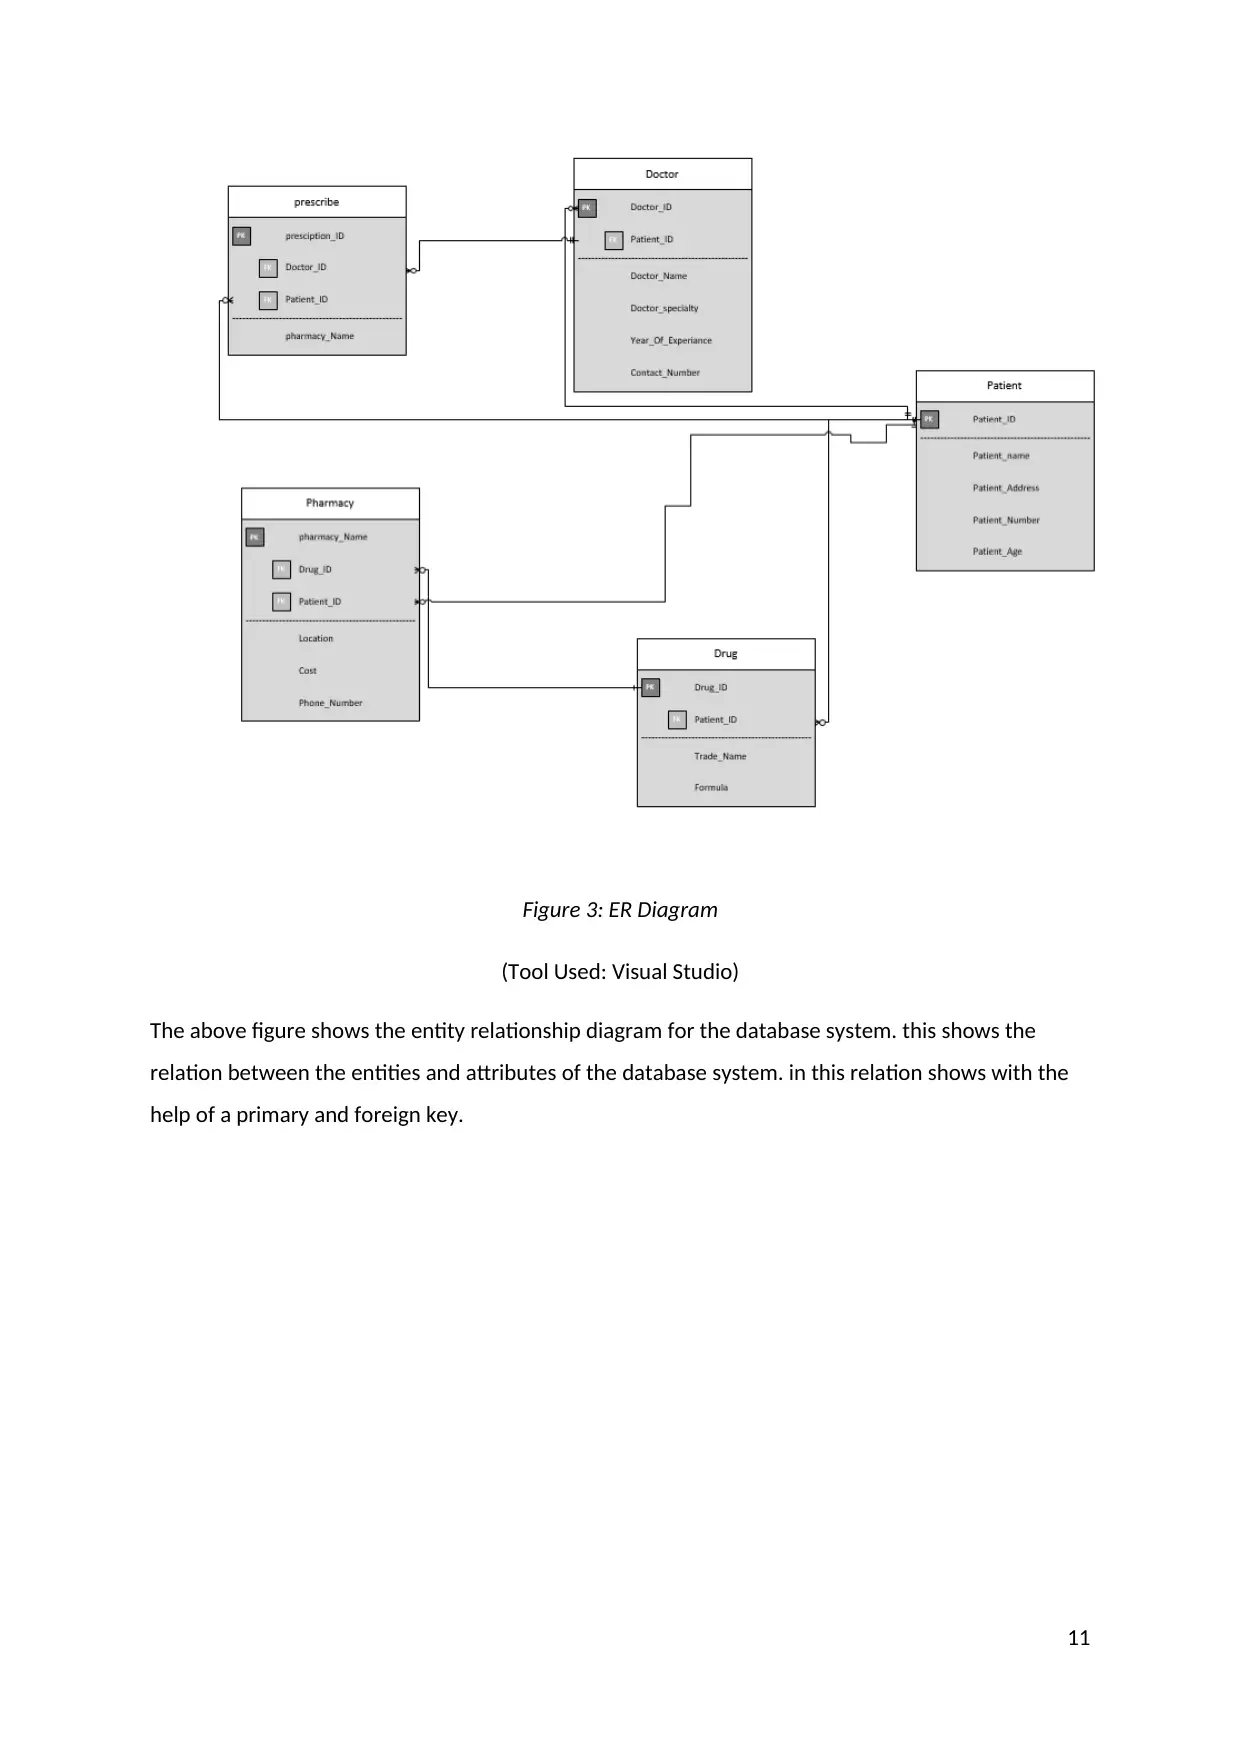
Figure 3: ER Diagram
(Tool Used: Visual Studio)
The above figure shows the entity relationship diagram for the database system. this shows the
relation between the entities and attributes of the database system. in this relation shows with the
help of a primary and foreign key.
11
(Tool Used: Visual Studio)
The above figure shows the entity relationship diagram for the database system. this shows the
relation between the entities and attributes of the database system. in this relation shows with the
help of a primary and foreign key.
11
⊘ This is a preview!⊘
Do you want full access?
Subscribe today to unlock all pages.
Trusted by 1+ million students worldwide
1 out of 27
Related Documents


Your All-in-One AI-Powered Toolkit for Academic Success.
+13062052269
info@desklib.com
Available 24*7 on WhatsApp / Email
![[object Object]](/_next/static/media/star-bottom.7253800d.svg)
Unlock your academic potential
Copyright © 2020–2026 A2Z Services. All Rights Reserved. Developed and managed by ZUCOL.