Data Analysis, Problem Solving, and Digital Operations Report
VerifiedAdded on 2020/03/23
|13
|2211
|76
Report
AI Summary
This report presents a detailed analysis of a retail organization's operational procedures and sales data. It utilizes business intelligence tools, specifically Tableau, to create dashboards that visualize key performance indicators. The report explores order priorities, delivery methods, and product sales across different categories (furniture, office supplies, and technology). The analysis includes a 'what if' scenario to assess potential outcomes based on data manipulation. Key findings reveal the company's equal preference for order priorities, the dominance of regular air shipping, and the corporate sector as the primary customer. The report also highlights the decline in furniture sales and the high profitability of technology products. The report provides a comprehensive understanding of the retail chain's operations, sales strategies, and financial performance based on the provided dataset.
Running head: DATA ANALYSIS, PROBLEM SOLVING, AND DIGITAL OPERATIONS
Data Analysis, Problem Solving, and Digital Operations
Name of the Student
Name of the University
Author Note
Data Analysis, Problem Solving, and Digital Operations
Name of the Student
Name of the University
Author Note
Paraphrase This Document
Need a fresh take? Get an instant paraphrase of this document with our AI Paraphraser
1
DATA ANALYSIS, PROBLEM SOLVING, AND DIGITAL OPERATIONS
Executive summary
This report deals with the analysis of a data set based on the productive and sales analysis of
a retail organization. The data has been analyzed to produce insights of the operational
behavior of the retail chain and produce dashboard charts with the help of a business
intelligence tools. The following report consists of a detailed description of the mode of
operations in the retail store, the analysis of the data set in the form of dashboards created
using the tools. The report also includes the key metric extracted from the data set, which
makes the understanding of the report easier
2
DATA ANALYSIS, PROBLEM SOLVING, AND DIGITAL OPERATIONS
Table of Contents
Introduction....................................................................................................................3
Analysis of the dashboard developed.............................................................................3
“What if” analysis..........................................................................................................7
Conclusion......................................................................................................................9
Bibliography.................................................................................................................10
⊘ This is a preview!⊘
Do you want full access?
Subscribe today to unlock all pages.
Trusted by 1+ million students worldwide
3
DATA ANALYSIS, PROBLEM SOLVING, AND DIGITAL OPERATIONS
Introduction
The purpose for the development of this report is to provide an overview of the data
set that has targets the operation procedures in a retail organization. The data set has been
analyzed and the detailed insight has been provided in the report with the help of a business
intelligence tool. The tool used for the completion of the report is a software named Tableau.
The following report consists of a detailed description of the mode of operations in the retail
store, the analysis of the data set in the form of dashboards created using the tools. The report
also includes the key metric extracted from the data set, which makes the understanding of
the report easier.
Analysis of the dashboard developed
Paraphrase This Document
Need a fresh take? Get an instant paraphrase of this document with our AI Paraphraser
4
DATA ANALYSIS, PROBLEM SOLVING, AND DIGITAL OPERATIONS
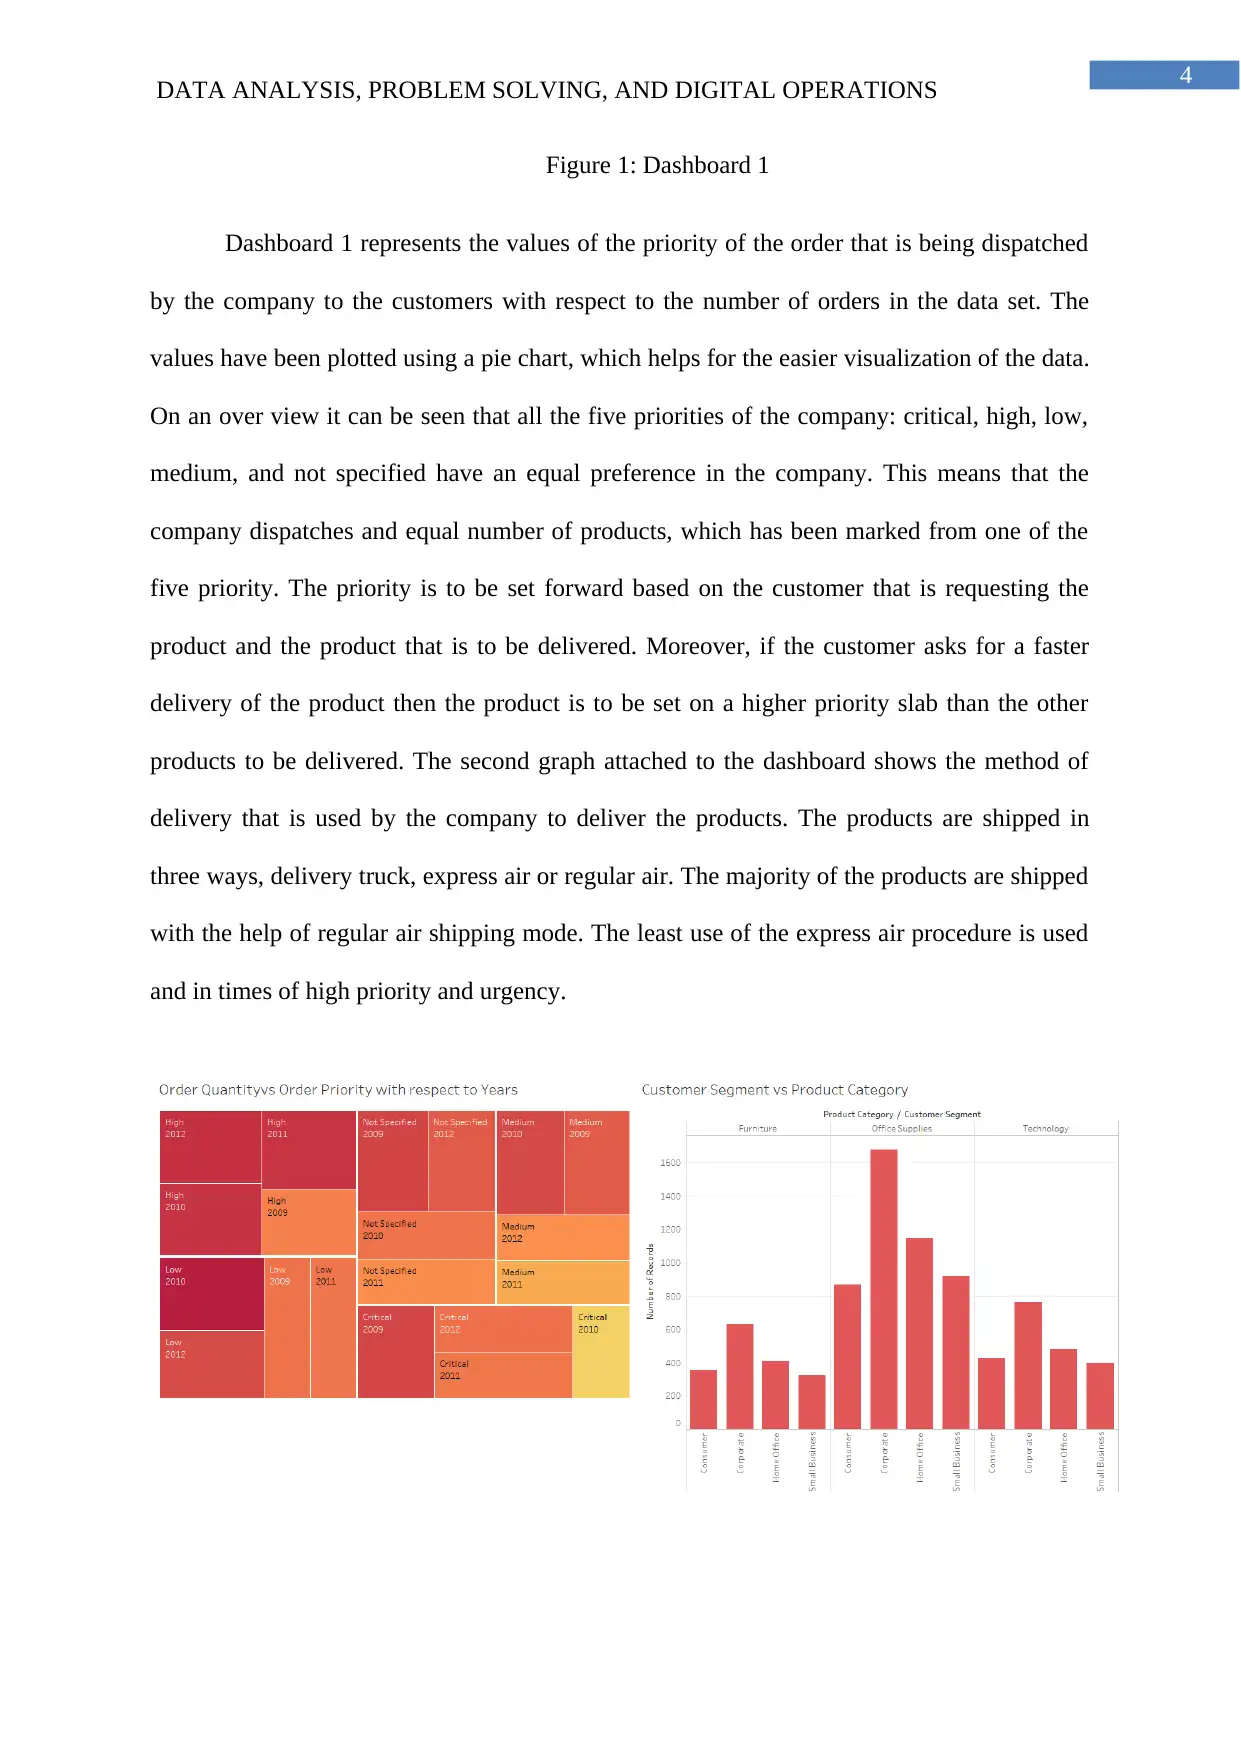
Figure 1: Dashboard 1
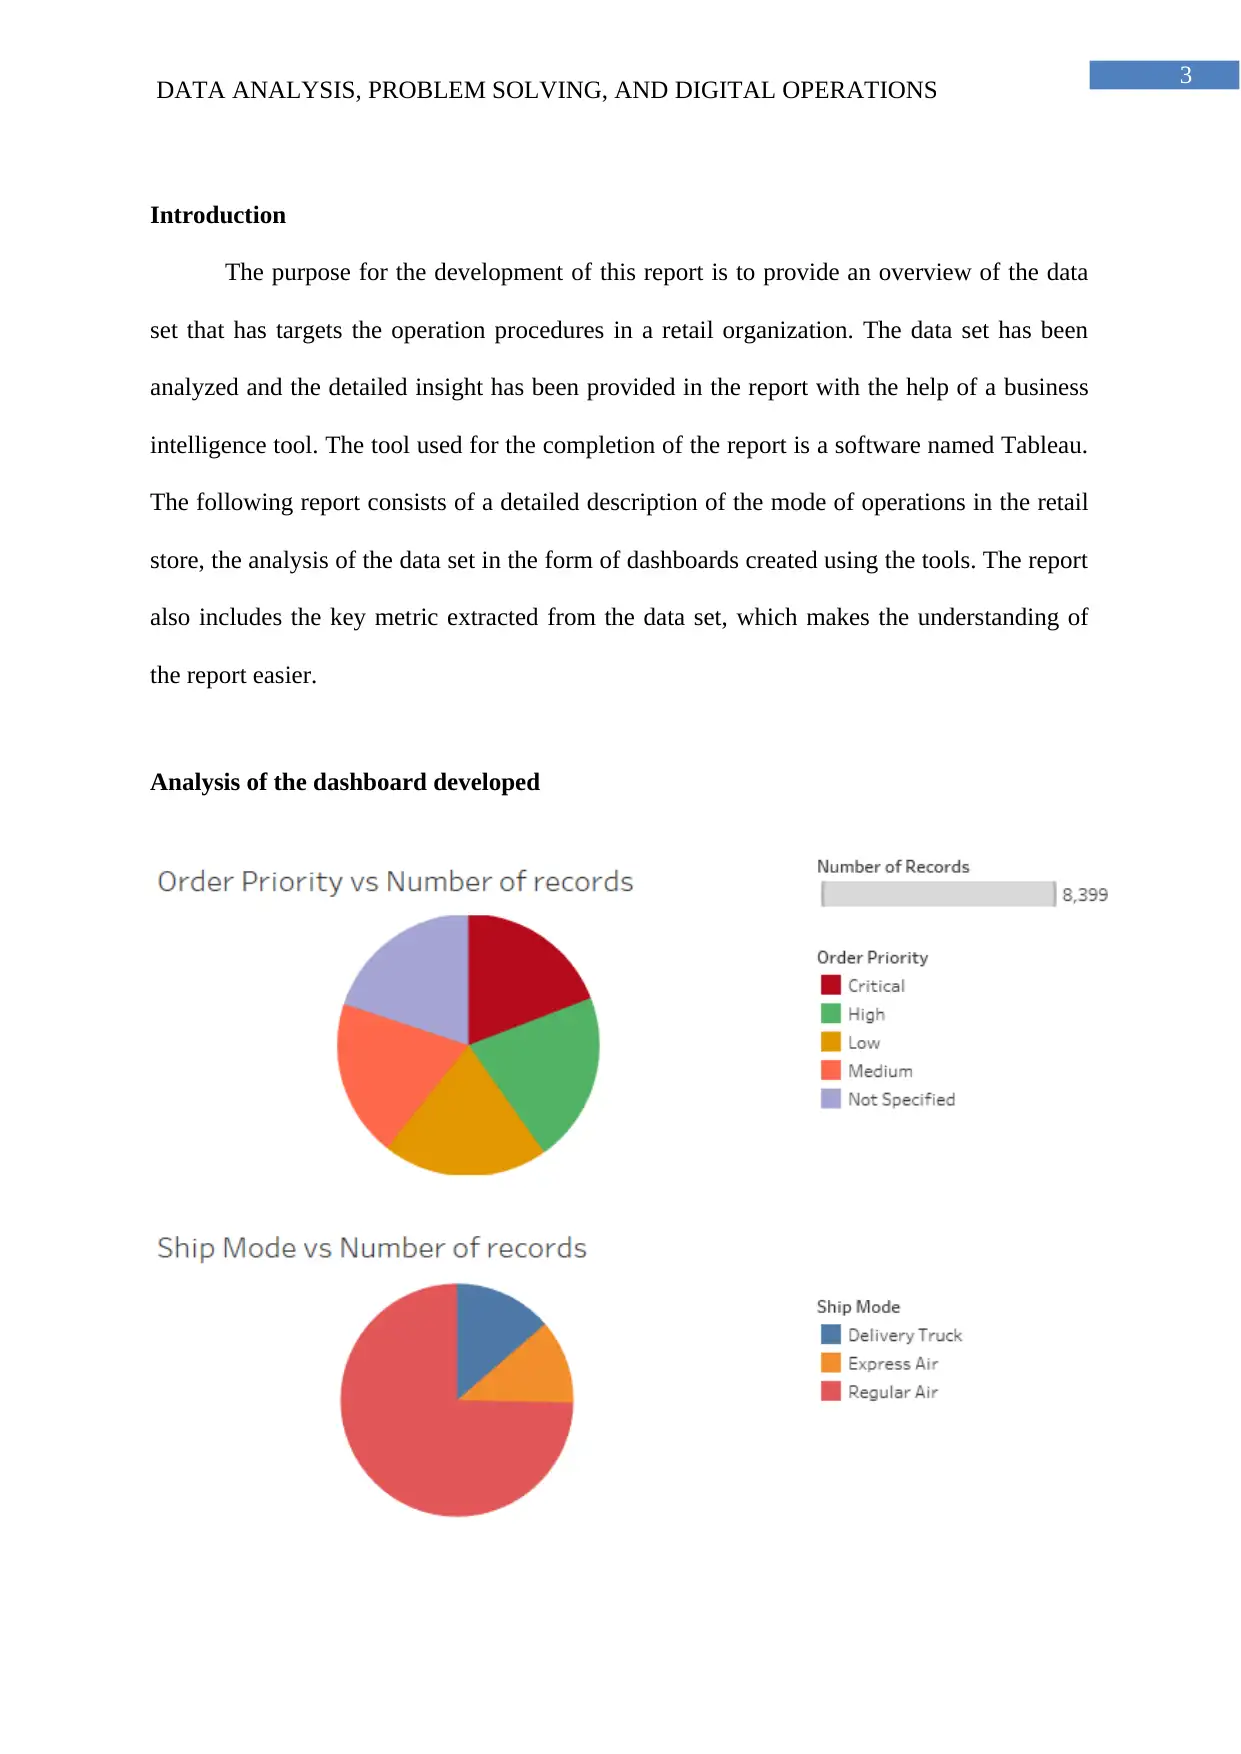
Dashboard 1 represents the values of the priority of the order that is being dispatched
by the company to the customers with respect to the number of orders in the data set. The
values have been plotted using a pie chart, which helps for the easier visualization of the data.
On an over view it can be seen that all the five priorities of the company: critical, high, low,
medium, and not specified have an equal preference in the company. This means that the
company dispatches and equal number of products, which has been marked from one of the
five priority. The priority is to be set forward based on the customer that is requesting the
product and the product that is to be delivered. Moreover, if the customer asks for a faster
delivery of the product then the product is to be set on a higher priority slab than the other
products to be delivered. The second graph attached to the dashboard shows the method of
delivery that is used by the company to deliver the products. The products are shipped in
three ways, delivery truck, express air or regular air. The majority of the products are shipped
with the help of regular air shipping mode. The least use of the express air procedure is used
and in times of high priority and urgency.
DATA ANALYSIS, PROBLEM SOLVING, AND DIGITAL OPERATIONS
Figure 1: Dashboard 1
Dashboard 1 represents the values of the priority of the order that is being dispatched
by the company to the customers with respect to the number of orders in the data set. The
values have been plotted using a pie chart, which helps for the easier visualization of the data.
On an over view it can be seen that all the five priorities of the company: critical, high, low,
medium, and not specified have an equal preference in the company. This means that the
company dispatches and equal number of products, which has been marked from one of the
five priority. The priority is to be set forward based on the customer that is requesting the
product and the product that is to be delivered. Moreover, if the customer asks for a faster
delivery of the product then the product is to be set on a higher priority slab than the other
products to be delivered. The second graph attached to the dashboard shows the method of
delivery that is used by the company to deliver the products. The products are shipped in
three ways, delivery truck, express air or regular air. The majority of the products are shipped
with the help of regular air shipping mode. The least use of the express air procedure is used
and in times of high priority and urgency.
5
DATA ANALYSIS, PROBLEM SOLVING, AND DIGITAL OPERATIONS
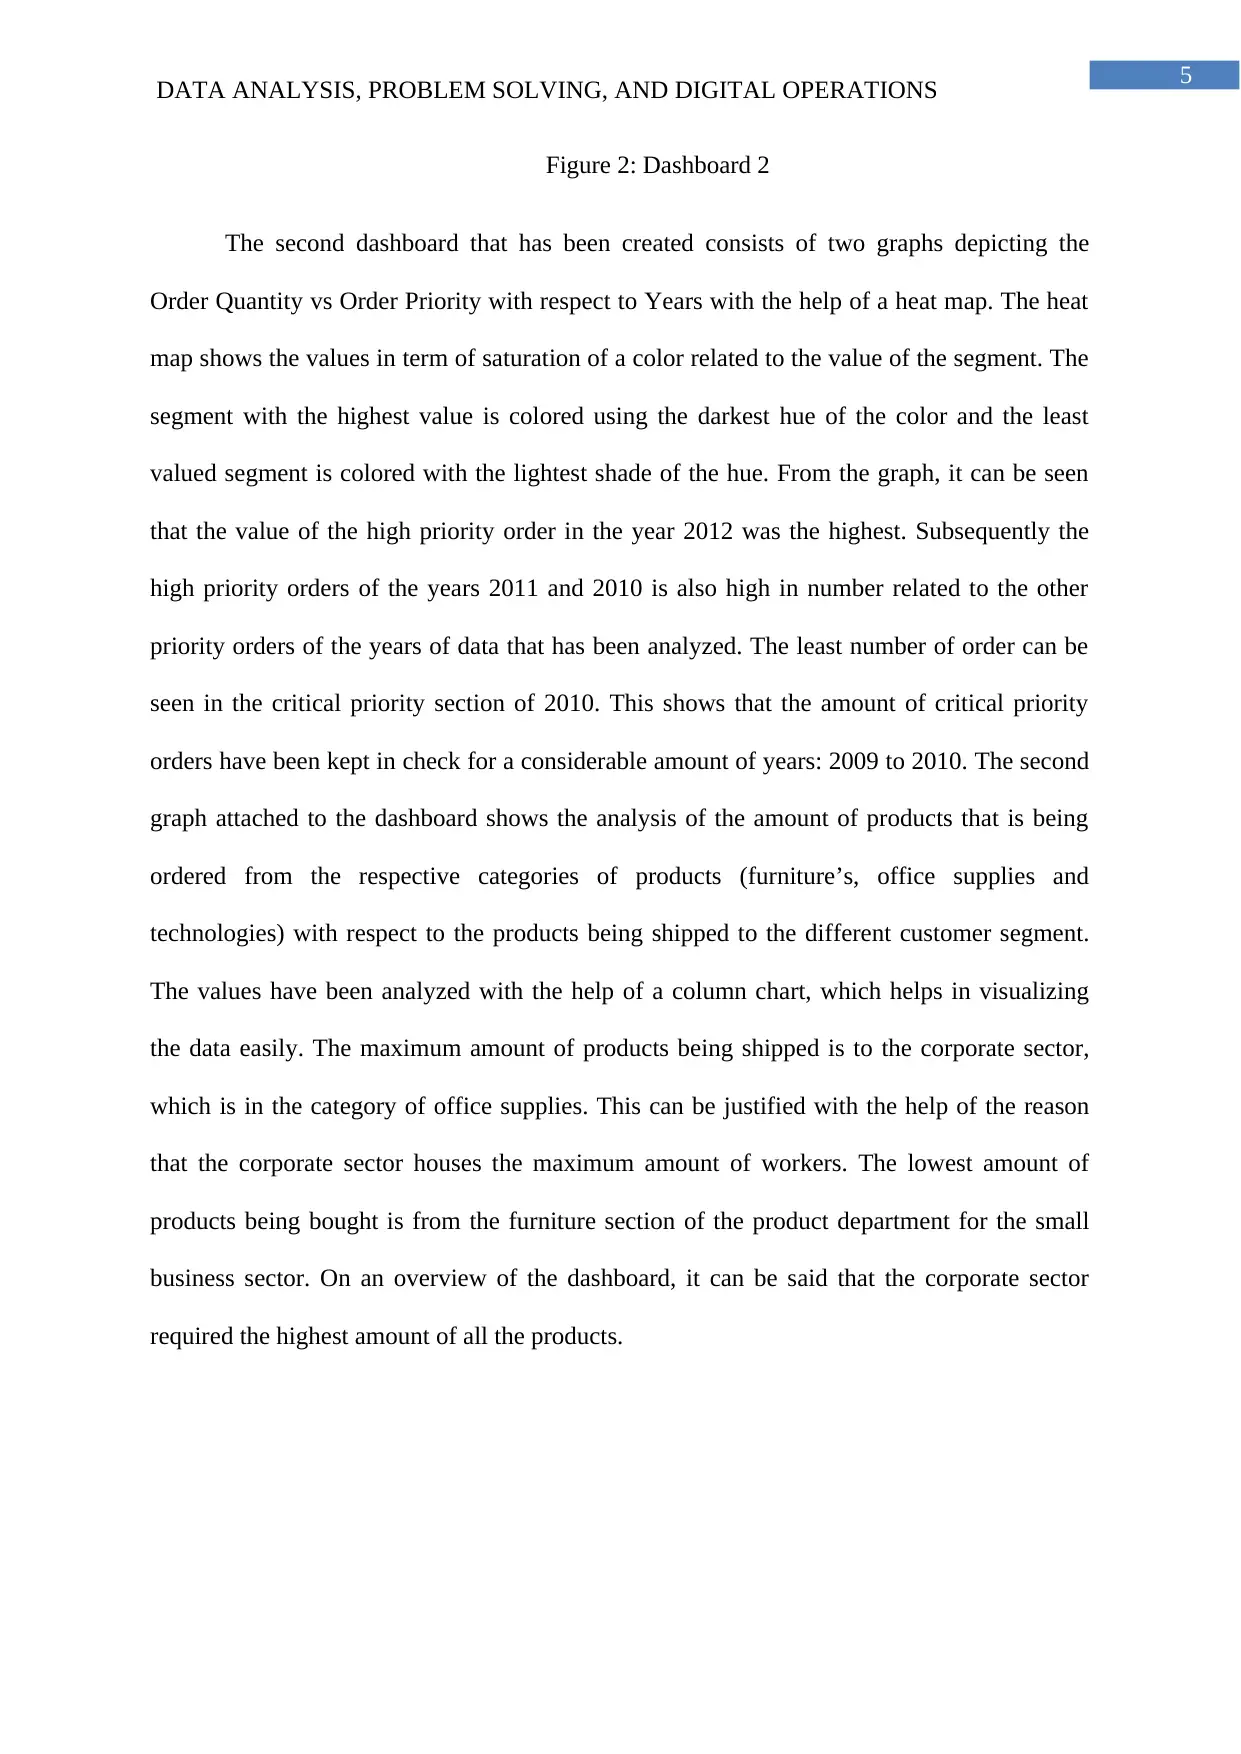
Figure 2: Dashboard 2
The second dashboard that has been created consists of two graphs depicting the
Order Quantity vs Order Priority with respect to Years with the help of a heat map. The heat
map shows the values in term of saturation of a color related to the value of the segment. The
segment with the highest value is colored using the darkest hue of the color and the least
valued segment is colored with the lightest shade of the hue. From the graph, it can be seen
that the value of the high priority order in the year 2012 was the highest. Subsequently the
high priority orders of the years 2011 and 2010 is also high in number related to the other
priority orders of the years of data that has been analyzed. The least number of order can be
seen in the critical priority section of 2010. This shows that the amount of critical priority
orders have been kept in check for a considerable amount of years: 2009 to 2010. The second
graph attached to the dashboard shows the analysis of the amount of products that is being
ordered from the respective categories of products (furniture’s, office supplies and
technologies) with respect to the products being shipped to the different customer segment.
The values have been analyzed with the help of a column chart, which helps in visualizing
the data easily. The maximum amount of products being shipped is to the corporate sector,
which is in the category of office supplies. This can be justified with the help of the reason
that the corporate sector houses the maximum amount of workers. The lowest amount of
products being bought is from the furniture section of the product department for the small
business sector. On an overview of the dashboard, it can be said that the corporate sector
required the highest amount of all the products.
DATA ANALYSIS, PROBLEM SOLVING, AND DIGITAL OPERATIONS
Figure 2: Dashboard 2
The second dashboard that has been created consists of two graphs depicting the
Order Quantity vs Order Priority with respect to Years with the help of a heat map. The heat
map shows the values in term of saturation of a color related to the value of the segment. The
segment with the highest value is colored using the darkest hue of the color and the least
valued segment is colored with the lightest shade of the hue. From the graph, it can be seen
that the value of the high priority order in the year 2012 was the highest. Subsequently the
high priority orders of the years 2011 and 2010 is also high in number related to the other
priority orders of the years of data that has been analyzed. The least number of order can be
seen in the critical priority section of 2010. This shows that the amount of critical priority
orders have been kept in check for a considerable amount of years: 2009 to 2010. The second
graph attached to the dashboard shows the analysis of the amount of products that is being
ordered from the respective categories of products (furniture’s, office supplies and
technologies) with respect to the products being shipped to the different customer segment.
The values have been analyzed with the help of a column chart, which helps in visualizing
the data easily. The maximum amount of products being shipped is to the corporate sector,
which is in the category of office supplies. This can be justified with the help of the reason
that the corporate sector houses the maximum amount of workers. The lowest amount of
products being bought is from the furniture section of the product department for the small
business sector. On an overview of the dashboard, it can be said that the corporate sector
required the highest amount of all the products.
⊘ This is a preview!⊘
Do you want full access?
Subscribe today to unlock all pages.
Trusted by 1+ million students worldwide
6
DATA ANALYSIS, PROBLEM SOLVING, AND DIGITAL OPERATIONS
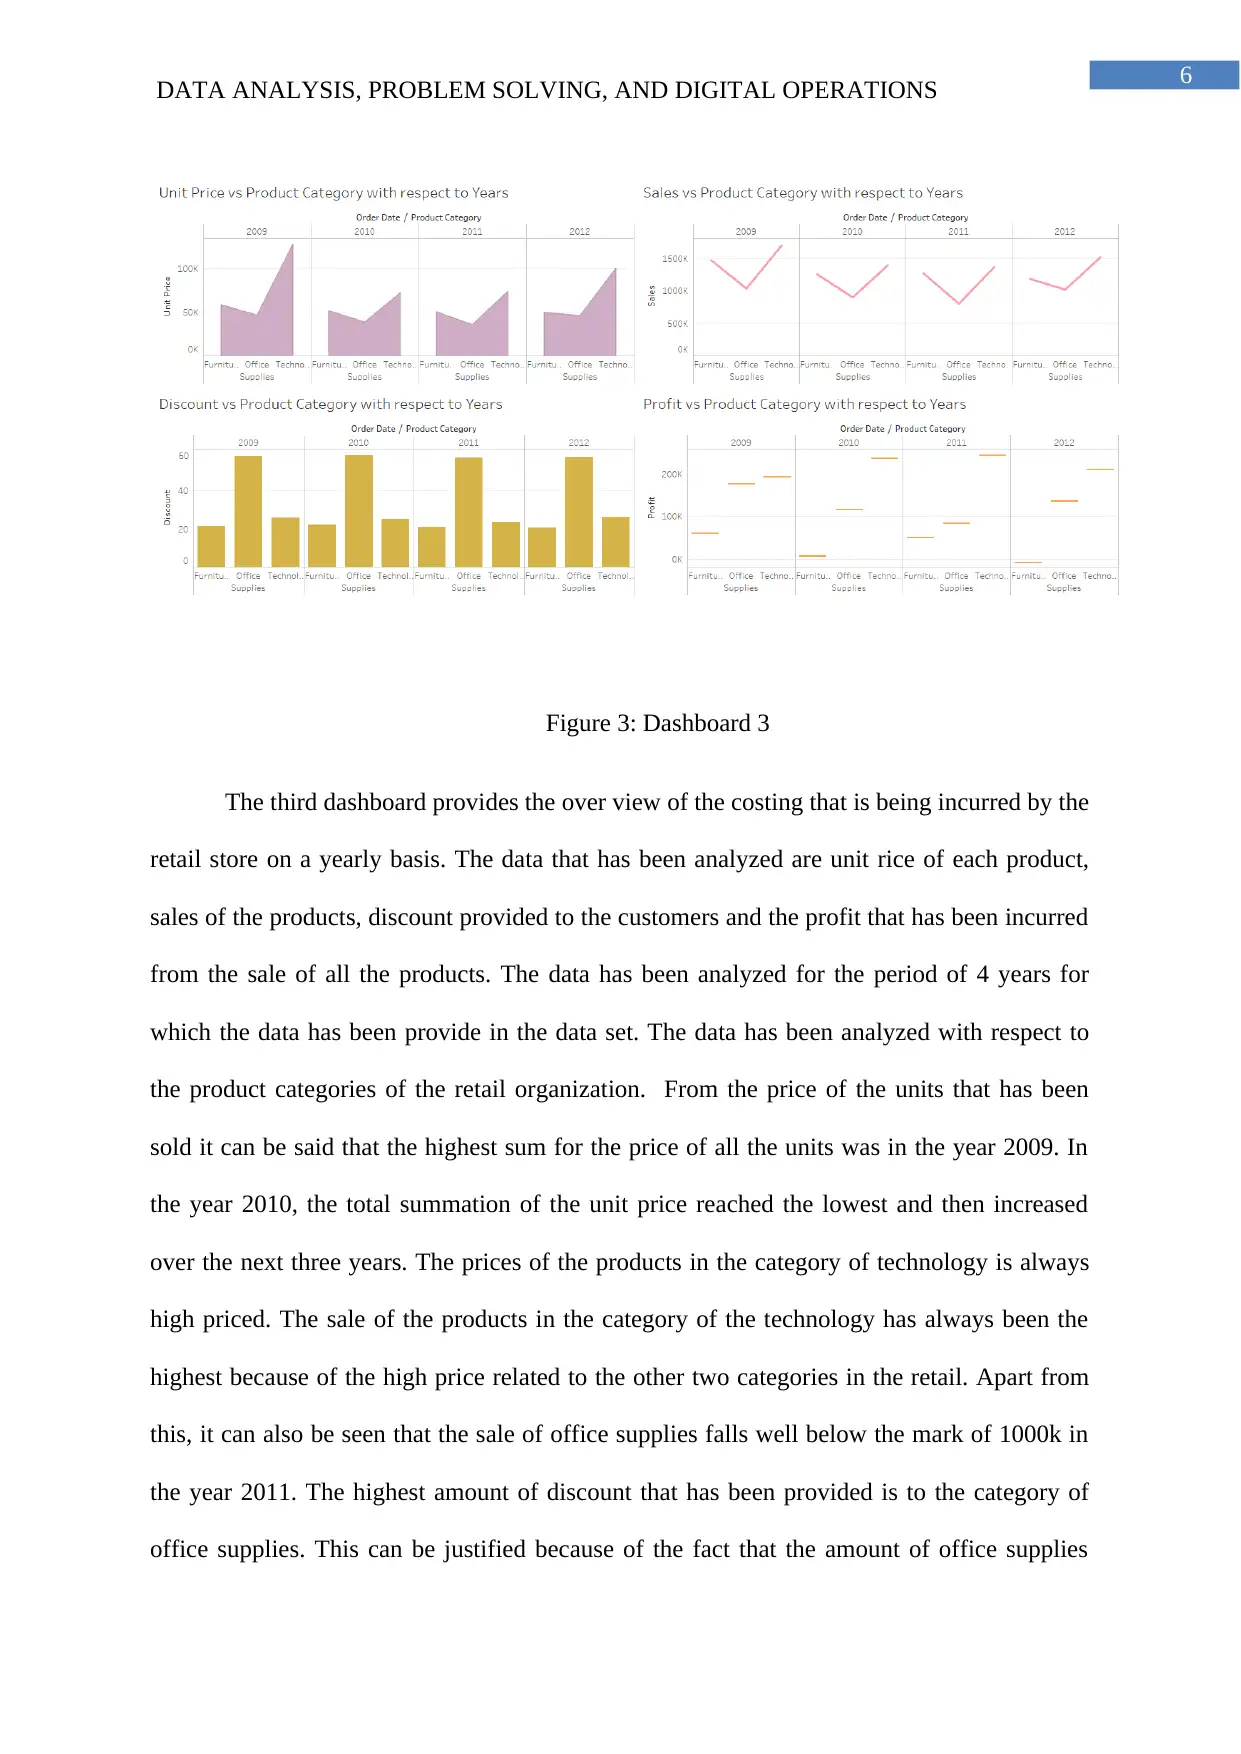
Figure 3: Dashboard 3
The third dashboard provides the over view of the costing that is being incurred by the
retail store on a yearly basis. The data that has been analyzed are unit rice of each product,
sales of the products, discount provided to the customers and the profit that has been incurred
from the sale of all the products. The data has been analyzed for the period of 4 years for
which the data has been provide in the data set. The data has been analyzed with respect to
the product categories of the retail organization. From the price of the units that has been
sold it can be said that the highest sum for the price of all the units was in the year 2009. In
the year 2010, the total summation of the unit price reached the lowest and then increased
over the next three years. The prices of the products in the category of technology is always
high priced. The sale of the products in the category of the technology has always been the
highest because of the high price related to the other two categories in the retail. Apart from
this, it can also be seen that the sale of office supplies falls well below the mark of 1000k in
the year 2011. The highest amount of discount that has been provided is to the category of
office supplies. This can be justified because of the fact that the amount of office supplies
DATA ANALYSIS, PROBLEM SOLVING, AND DIGITAL OPERATIONS
Figure 3: Dashboard 3
The third dashboard provides the over view of the costing that is being incurred by the
retail store on a yearly basis. The data that has been analyzed are unit rice of each product,
sales of the products, discount provided to the customers and the profit that has been incurred
from the sale of all the products. The data has been analyzed for the period of 4 years for
which the data has been provide in the data set. The data has been analyzed with respect to
the product categories of the retail organization. From the price of the units that has been
sold it can be said that the highest sum for the price of all the units was in the year 2009. In
the year 2010, the total summation of the unit price reached the lowest and then increased
over the next three years. The prices of the products in the category of technology is always
high priced. The sale of the products in the category of the technology has always been the
highest because of the high price related to the other two categories in the retail. Apart from
this, it can also be seen that the sale of office supplies falls well below the mark of 1000k in
the year 2011. The highest amount of discount that has been provided is to the category of
office supplies. This can be justified because of the fact that the amount of office supplies
Paraphrase This Document
Need a fresh take? Get an instant paraphrase of this document with our AI Paraphraser
7
DATA ANALYSIS, PROBLEM SOLVING, AND DIGITAL OPERATIONS
that is being sold by the company can be directly related to the amount of discount that is
being provided by the company. The lowest amount of discount is provided for the category
of furniture. The last chart of the dashboard shows the amount of profit the company makes
from the sale of the products of the categories. The most striking value of all the data plotted
is of the furniture category. The value started to decrease from 2009 and gained an increase in
2011. However, at the end of 2012, the value dropped below zero, which shows that all the
products were sold at a loss and no profit was gained. The highest profit gained from the sale
of the products is from the category of technology. This means that the retail chain at a much
lowers price is acquiring the products and even after providing discounts on the products,
they are also able to gain a high percentage of profit from the sale of the products
The above-discussed dashboard provide the best insight into the data set that has been
used for the analysis and for the development of this report.
8
DATA ANALYSIS, PROBLEM SOLVING, AND DIGITAL OPERATIONS
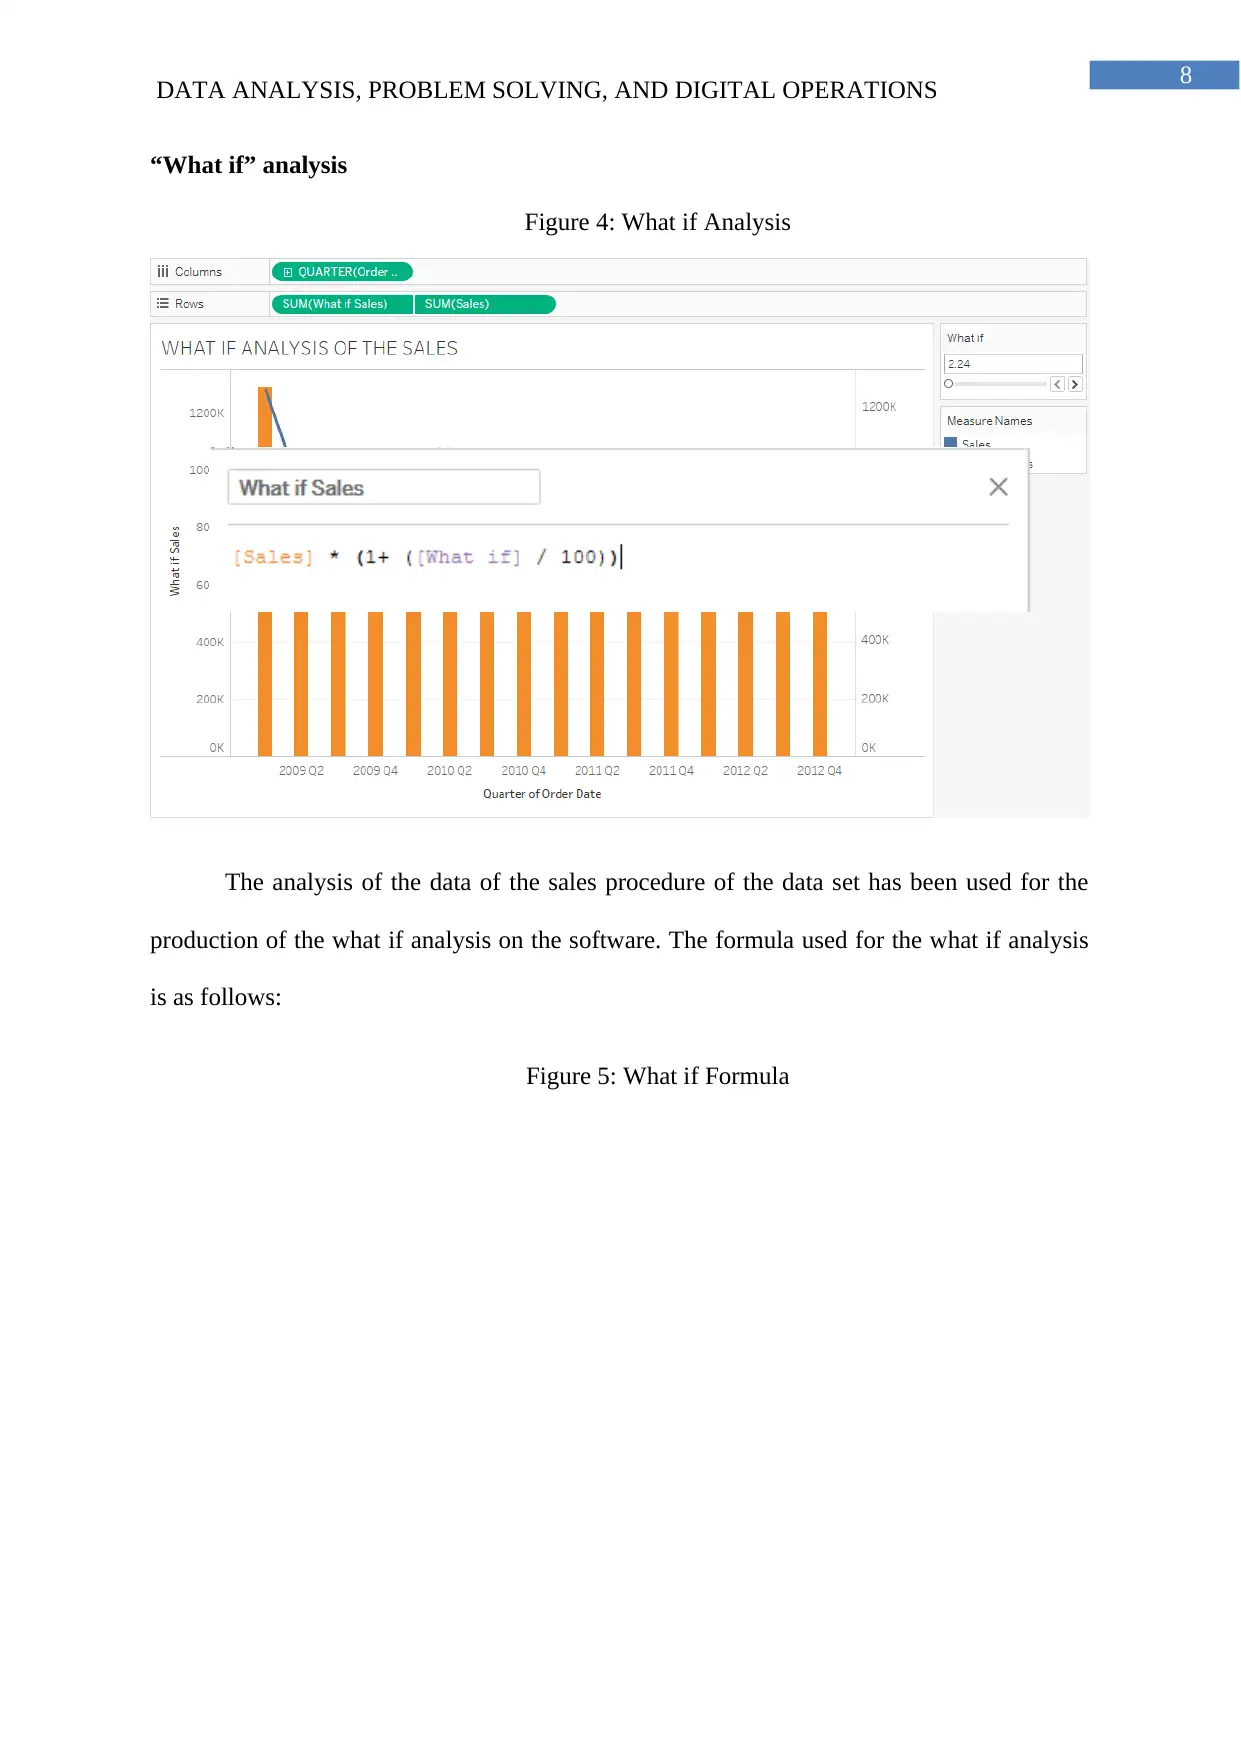
“What if” analysis
Figure 4: What if Analysis
The analysis of the data of the sales procedure of the data set has been used for the
production of the what if analysis on the software. The formula used for the what if analysis
is as follows:
Figure 5: What if Formula
DATA ANALYSIS, PROBLEM SOLVING, AND DIGITAL OPERATIONS
“What if” analysis
Figure 4: What if Analysis
The analysis of the data of the sales procedure of the data set has been used for the
production of the what if analysis on the software. The formula used for the what if analysis
is as follows:
Figure 5: What if Formula
⊘ This is a preview!⊘
Do you want full access?
Subscribe today to unlock all pages.
Trusted by 1+ million students worldwide
9
DATA ANALYSIS, PROBLEM SOLVING, AND DIGITAL OPERATIONS
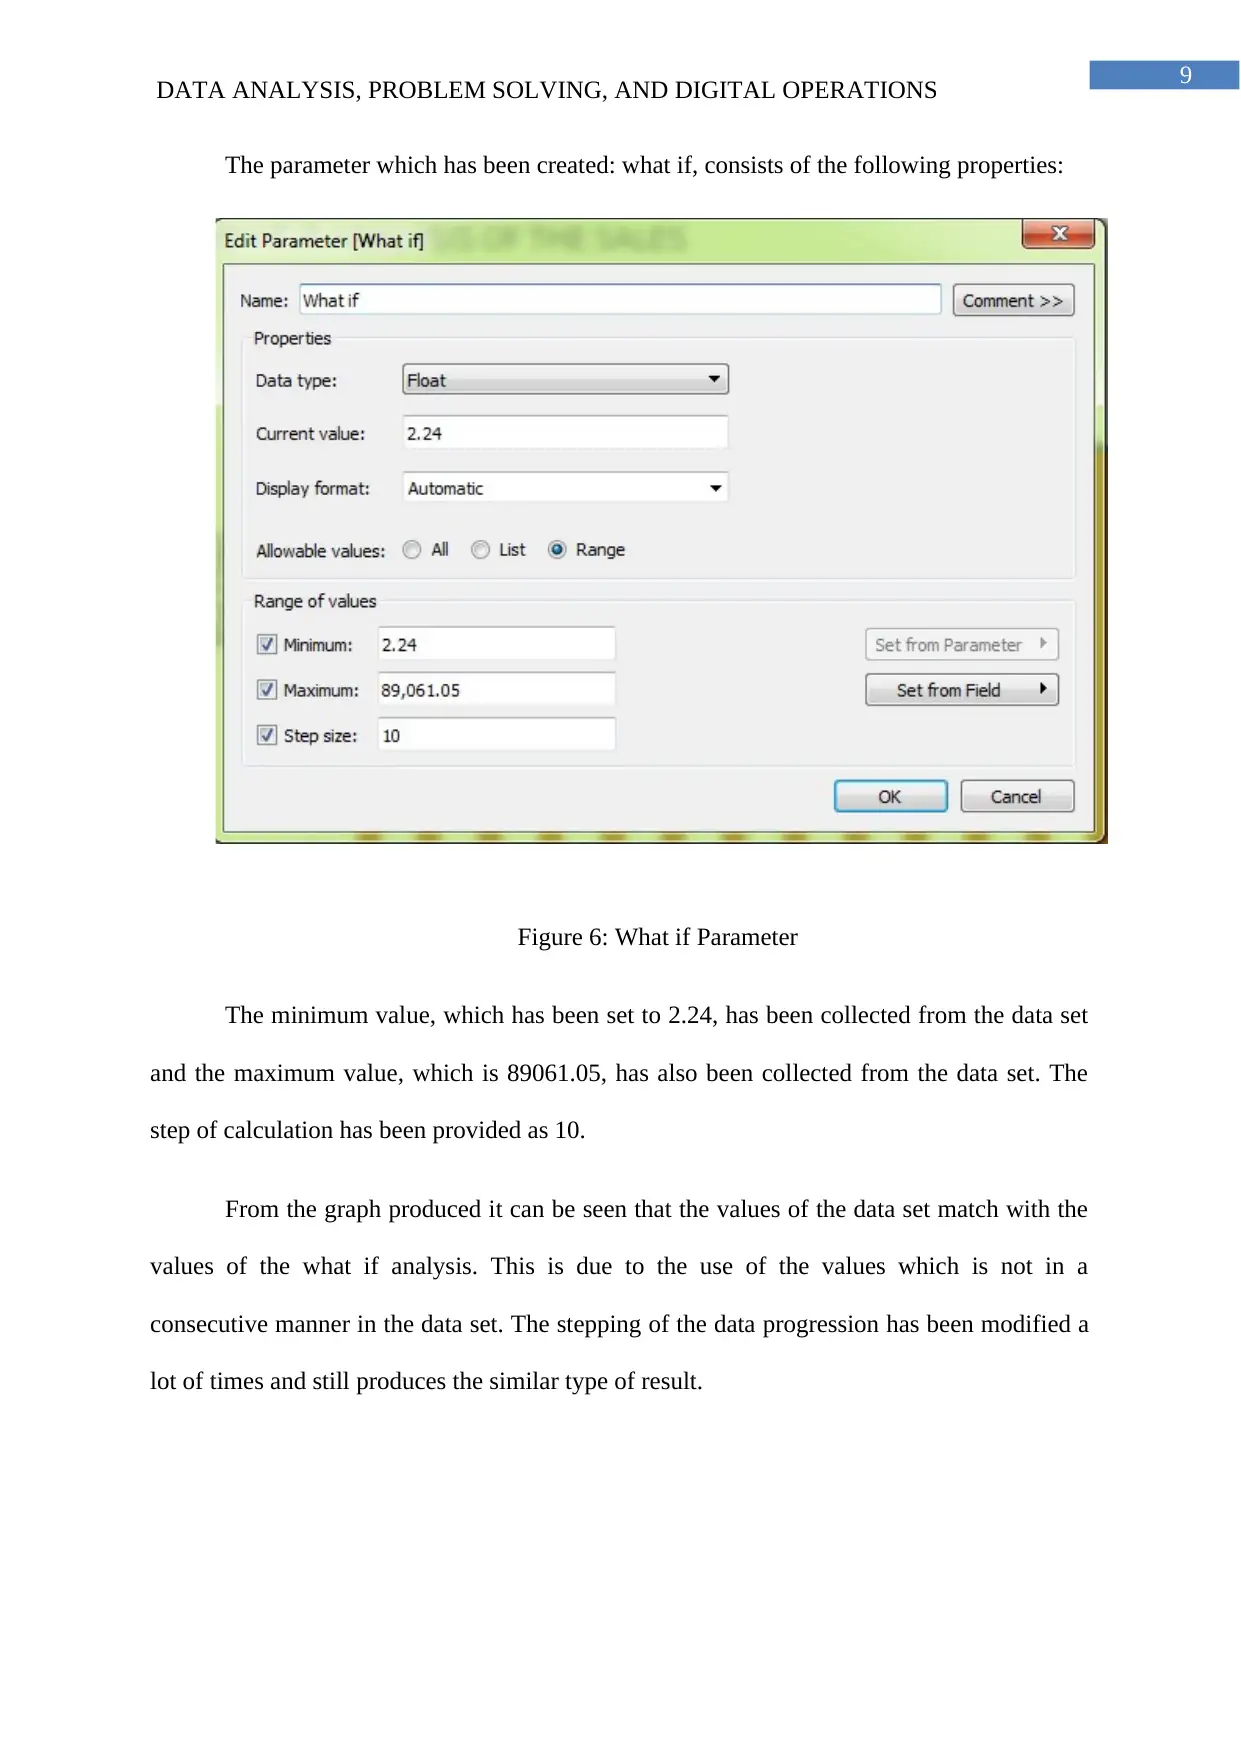
The parameter which has been created: what if, consists of the following properties:
Figure 6: What if Parameter
The minimum value, which has been set to 2.24, has been collected from the data set
and the maximum value, which is 89061.05, has also been collected from the data set. The
step of calculation has been provided as 10.
From the graph produced it can be seen that the values of the data set match with the
values of the what if analysis. This is due to the use of the values which is not in a
consecutive manner in the data set. The stepping of the data progression has been modified a
lot of times and still produces the similar type of result.
DATA ANALYSIS, PROBLEM SOLVING, AND DIGITAL OPERATIONS
The parameter which has been created: what if, consists of the following properties:
Figure 6: What if Parameter
The minimum value, which has been set to 2.24, has been collected from the data set
and the maximum value, which is 89061.05, has also been collected from the data set. The
step of calculation has been provided as 10.
From the graph produced it can be seen that the values of the data set match with the
values of the what if analysis. This is due to the use of the values which is not in a
consecutive manner in the data set. The stepping of the data progression has been modified a
lot of times and still produces the similar type of result.
Paraphrase This Document
Need a fresh take? Get an instant paraphrase of this document with our AI Paraphraser
10
DATA ANALYSIS, PROBLEM SOLVING, AND DIGITAL OPERATIONS
Conclusion
To conclude this report, it can be said that the report has been compiled with the full
follow up of the criteria’s and the process that is to be followed for the completion of the
report. From the analysis of the data set, it can be concluded that the data provides a detailed
insight on the retail organization. The sale procedures and the mode of operations of the retail
organization can be understood and analyzed form the data set that has been provided for the
analysis of the report. The current mode of operation of the retail organization has been found
that they mainly target the customer section of the highest possible sale number. The sale of
the product in the category of the office supplies show that they target the main users of the
office supplies along with the technology that is being sold by them. The other major insight
can be found that the retail organization is starting to sale out all the products in the furniture
department to clear out their store. This can be determined from the fact that the value of
profit for the year 2012 has reached to a negative value. Apart from all these, the analysis of
the data provides a helpful insight on the working procedure of the retail organization.
11
DATA ANALYSIS, PROBLEM SOLVING, AND DIGITAL OPERATIONS
Bibliography
Chang, V., 2014. The business intelligence as a service in the cloud. Future Generation
Computer Systems, 37, pp.512-534.
Fan, S., Lau, R.Y. and Zhao, J.L., 2015. Demystifying big data analytics for business
intelligence through the lens of marketing mix. Big Data Research, 2(1), pp.28-32.
George, J., Kumar, V. and Kumar, S., 2015. Data Warehouse Design Considerations for a
Healthcare Business Intelligence System. In World Congress on Engineering.
Isik, Ö., Jones, M.C. and Sidorova, A., 2013. Business intelligence success: The roles of BI
capabilities and decision environments. Information & Management, 50(1), pp.13-23.
Kimball, R., Ross, M., Mundy, J. and Thornthwaite, W., 2015. The Kimball Group Reader:
Relentlessly Practical Tools for Data Warehousing and Business Intelligence Remastered
Collection. John Wiley & Sons.
Laudon, K.C. and Laudon, J.P., 2015. Management Information Systems: Managing the
Digital Firm Plus MyMISLab with Pearson eText--Access Card Package. Prentice Hall Press.
Laursen, G.H. and Thorlund, J., 2016. Business analytics for managers: Taking business
intelligence beyond reporting. John Wiley & Sons.
Petermann, A., Junghanns, M., Müller, R. and Rahm, E., 2014. Graph-based data integration
and business intelligence with BIIIG. Proceedings of the VLDB Endowment, 7(13), pp.1577-
1580.
Richards, G., Yeoh, W., Chong, A.Y.L. and Popovič, A., 2017. Business Intelligence
Effectiveness and Corporate Performance Management: An Empirical Analysis. Journal of
Computer Information Systems, pp.1-9.
Sauter, V.L., 2014. Decision support systems for business intelligence. John Wiley & Sons.
⊘ This is a preview!⊘
Do you want full access?
Subscribe today to unlock all pages.
Trusted by 1+ million students worldwide
1 out of 13
Related Documents


Your All-in-One AI-Powered Toolkit for Academic Success.
+13062052269
info@desklib.com
Available 24*7 on WhatsApp / Email
![[object Object]](/_next/static/media/star-bottom.7253800d.svg)
Unlock your academic potential
Copyright © 2020–2026 A2Z Services. All Rights Reserved. Developed and managed by ZUCOL.