BUS0002: Report on Data Analysis and British Airways Financials
VerifiedAdded on 2023/01/18
|14
|3670
|54
Report
AI Summary
This report delves into the application of information and data analysis in organizational decision-making. It begins by comparing qualitative and quantitative data, horizontal and vertical analysis, and statistical versus big data. The report emphasizes the importance of data quality in financial statements, highlighting its impact on decision-making, compliance, and productivity. The second part of the report presents a case study of British Airways, analyzing its fleet composition, evaluating its financial performance using ratios like ROCE, ROE, and the current ratio, and discussing associated risk factors. The analysis reveals insights into British Airways' financial health and operational efficiency, providing a comprehensive overview of its performance and the factors influencing it.
BUS0002 Using
Information
Information
Paraphrase This Document
Need a fresh take? Get an instant paraphrase of this document with our AI Paraphraser
Contents
INTRODUCTION...........................................................................................................................1
Assessment Part 1............................................................................................................................1
Comparison..................................................................................................................................1
Explaining ‘data quality’ and its importance in financial statements..........................................2
Assessment Part 2............................................................................................................................3
Analysis the fleet table.................................................................................................................3
Evaluating performance of British Airways Group using ratios.................................................5
Discussing risk factors.................................................................................................................7
Commenting on British Airways’ revenue..................................................................................8
CONCLUSION................................................................................................................................9
REFERENCES..............................................................................................................................11

⊘ This is a preview!⊘
Do you want full access?
Subscribe today to unlock all pages.
Trusted by 1+ million students worldwide
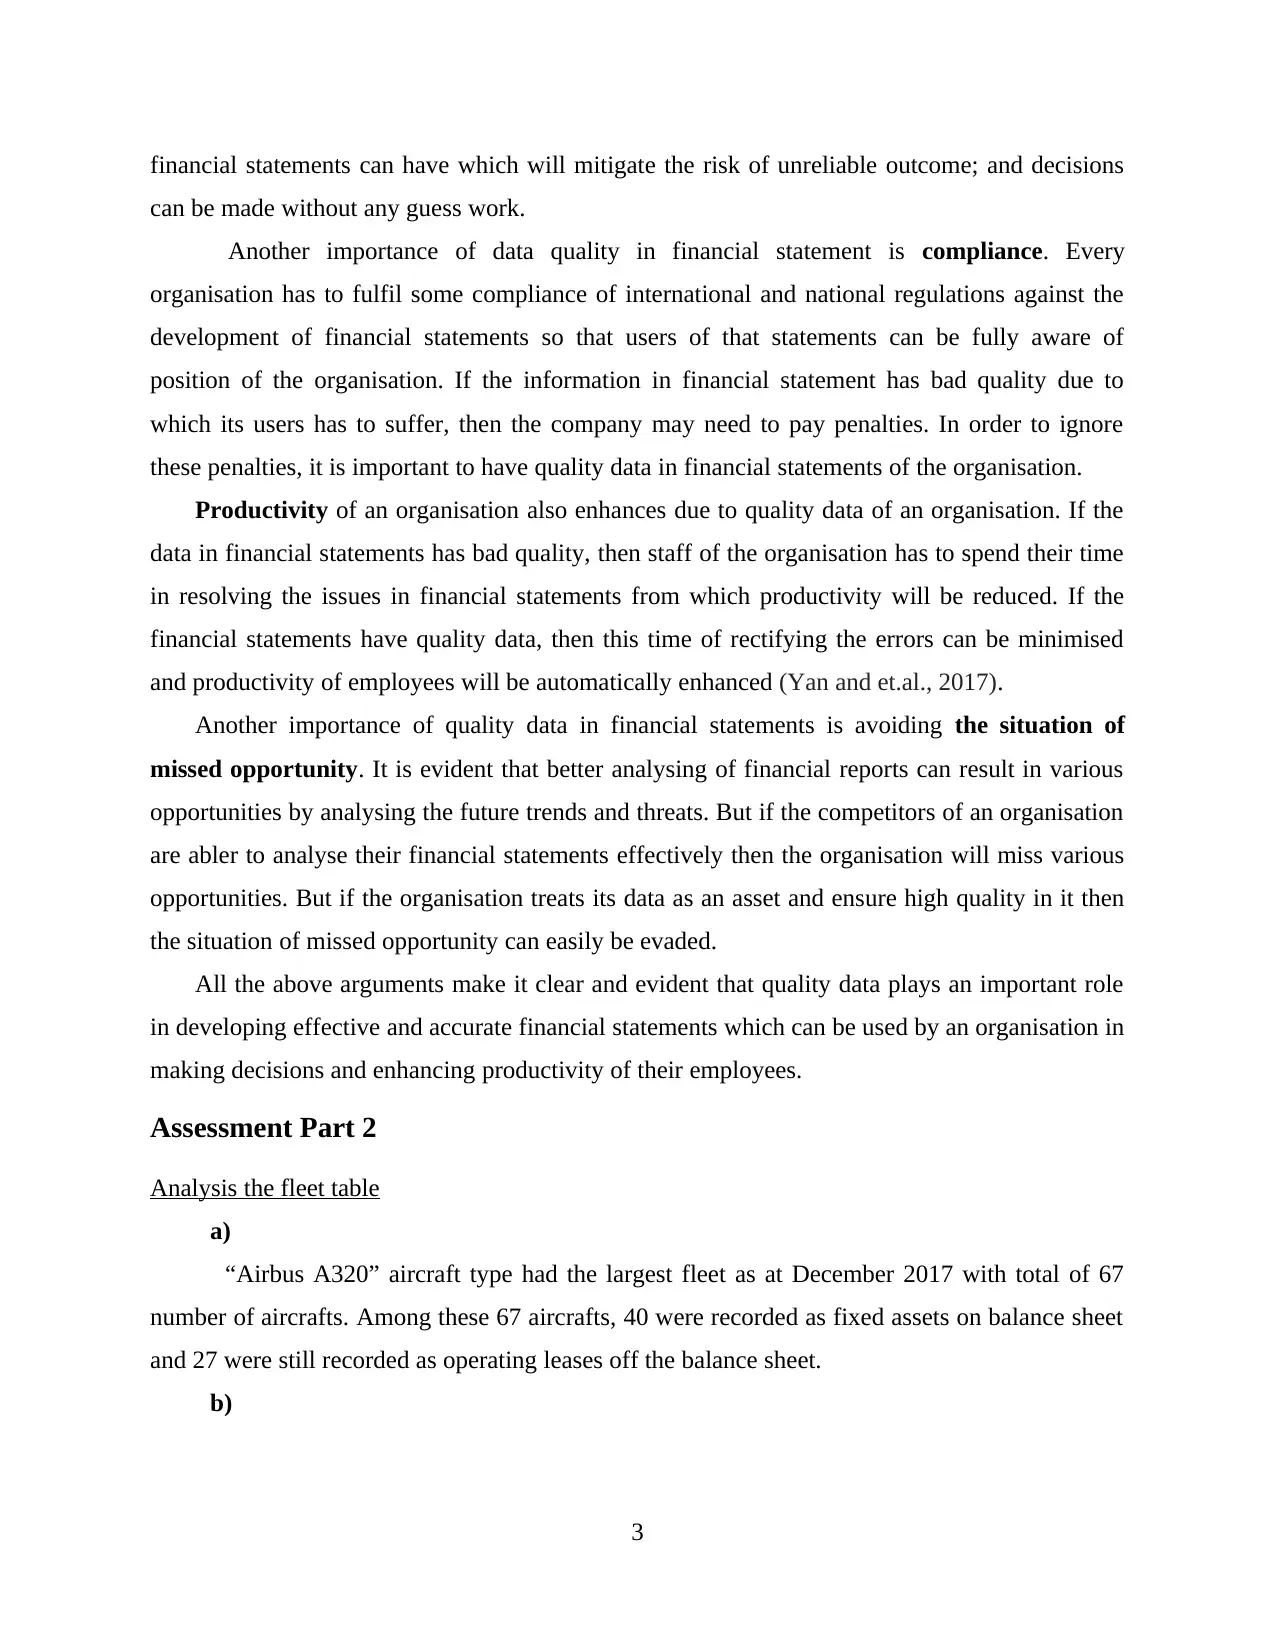
INTRODUCTION
Using information is a process of using the data whether raw or processed to analyse its
elements in order to get desired results (Bloom and et.al., 2017). It is a concept in which assessor
or investigator uses the data available to develop conclusions (Bzdok, Altman and Krzywinski,
2018). Main aim of this report is to investigate various types of data and their applications in
making various organisational decisions. The present report is classified into two sections. The
first section will compare various statistical theories which are quantitative and qualitative,
horizontal and vertical analysis and statistical and big data. Besides which concept of data
quality is also assessed along with its importance. In the second section of the report, a case
study of British airways is assessed in order to evaluate its financial performance.
Assessment Part 1
Comparison
a) Qualitative and Quantitative data
Qualitative data is the information about features and qualities which cannot be measured
and is collected with the aim of understanding human behaviour (Chevalier and Kashyap, 2019).
This type of data is collected by an investigator through observations and interviews which is
further analysed using thematic analysis. This data follows a subjective approach by which
unstructured data is collected to get the outcome of high level of understanding. The only
drawback in this data is that it is collected against a small sample of representatives.
On the other hand, quantitative is the information about the quantities which can be both
measured and presented numerically (Koutras, Koutras and Yalcin, 2016). In case of quantitative
data, accuracy level is comparatively high as it is structurally collected from a large number of
representatives. An investigator uses objective approach (surveys) to collect this type of data
which is further analysed using statistical methods of descriptive and inferential statistics. This
data is limited due to its complexity of methods which requires statistical skills.
b) Horizontal and Vertical Analysis (under the subject of trend analysis)
Horizontal analysis is a technique to analyse the trend in financial statements of organisation
by comparing current year statements from historical statements. These financial statements
usually include income statement, balance sheet and cash flow statement (Nisar, Prabhakar and
Strakova, 2019). Under this technique, a financial statement is analysed in which one year is
1
Paraphrase This Document
Need a fresh take? Get an instant paraphrase of this document with our AI Paraphraser

considered as a base and then all other years are compared to that base year in order to analyse
the trend of increase and decrease. By using this technique, factors such as seasonality and
others can be determined due to which trends of financial statement are changing. This technique
is often used to manipulate the results in order to make the current year revenue better due to
which this technique is not suitable for analysing the growth but sure is useful for analysing
trend.
On the contrary, vertical analysis is the technique of trend analysis in which evaluation is
done of a single year (time period) only. Under this technique, an element of the financial
statement is considered as a base and then all other elements of the statement are compared to
that base. For example, revenue of the income statement is considered as base (100%) and then
other elements such as cost of goods sold and expenses are compared to that base in order to
analyse the trend of increase and decrease.
c) Statistical and Big data
Statistical data is a structured data which is first collected and then presented using statistics
techniques of descriptive and inferential statistics. This type of data is easy to understand and
conclude. This data helps in easy analysing the results (Puri and Sengupta, 2018) (Venkatesan,
2019).
Big data refers to the immense volume of data which is unstructured and hard to analyse to
conclude any results. This data is collected over a large period of time and it is important to
analyse this kind of data before getting any insights.
Explaining ‘data quality’ and its importance in financial statements
Data quality is the concept of controlling the planning and implementation of quality
management techniques on the data in order to ensure suitability of the data. A data is considered
of high quality, if it fits for the intended purpose of use (Walker, Michailov and Trukhanov,
2019).
To develop financial statements, it is important to have a quality data so that effective and
accurate financial statements can be developed. There are various arguments which can reflect
the importance of data quality in financial statements. These arguments are:
If the data in financial statements of high quality, then organisation can make effective
decisions. The better the data quality in financial statements is, the more confidence can users of
2
financial statements can have which will mitigate the risk of unreliable outcome; and decisions
can be made without any guess work.
Another importance of data quality in financial statement is compliance. Every
organisation has to fulfil some compliance of international and national regulations against the
development of financial statements so that users of that statements can be fully aware of
position of the organisation. If the information in financial statement has bad quality due to
which its users has to suffer, then the company may need to pay penalties. In order to ignore
these penalties, it is important to have quality data in financial statements of the organisation.
Productivity of an organisation also enhances due to quality data of an organisation. If the
data in financial statements has bad quality, then staff of the organisation has to spend their time
in resolving the issues in financial statements from which productivity will be reduced. If the
financial statements have quality data, then this time of rectifying the errors can be minimised
and productivity of employees will be automatically enhanced (Yan and et.al., 2017).
Another importance of quality data in financial statements is avoiding the situation of
missed opportunity. It is evident that better analysing of financial reports can result in various
opportunities by analysing the future trends and threats. But if the competitors of an organisation
are abler to analyse their financial statements effectively then the organisation will miss various
opportunities. But if the organisation treats its data as an asset and ensure high quality in it then
the situation of missed opportunity can easily be evaded.
All the above arguments make it clear and evident that quality data plays an important role
in developing effective and accurate financial statements which can be used by an organisation in
making decisions and enhancing productivity of their employees.
Assessment Part 2
Analysis the fleet table
a)
“Airbus A320” aircraft type had the largest fleet as at December 2017 with total of 67
number of aircrafts. Among these 67 aircrafts, 40 were recorded as fixed assets on balance sheet
and 27 were still recorded as operating leases off the balance sheet.
b)
3
⊘ This is a preview!⊘
Do you want full access?
Subscribe today to unlock all pages.
Trusted by 1+ million students worldwide
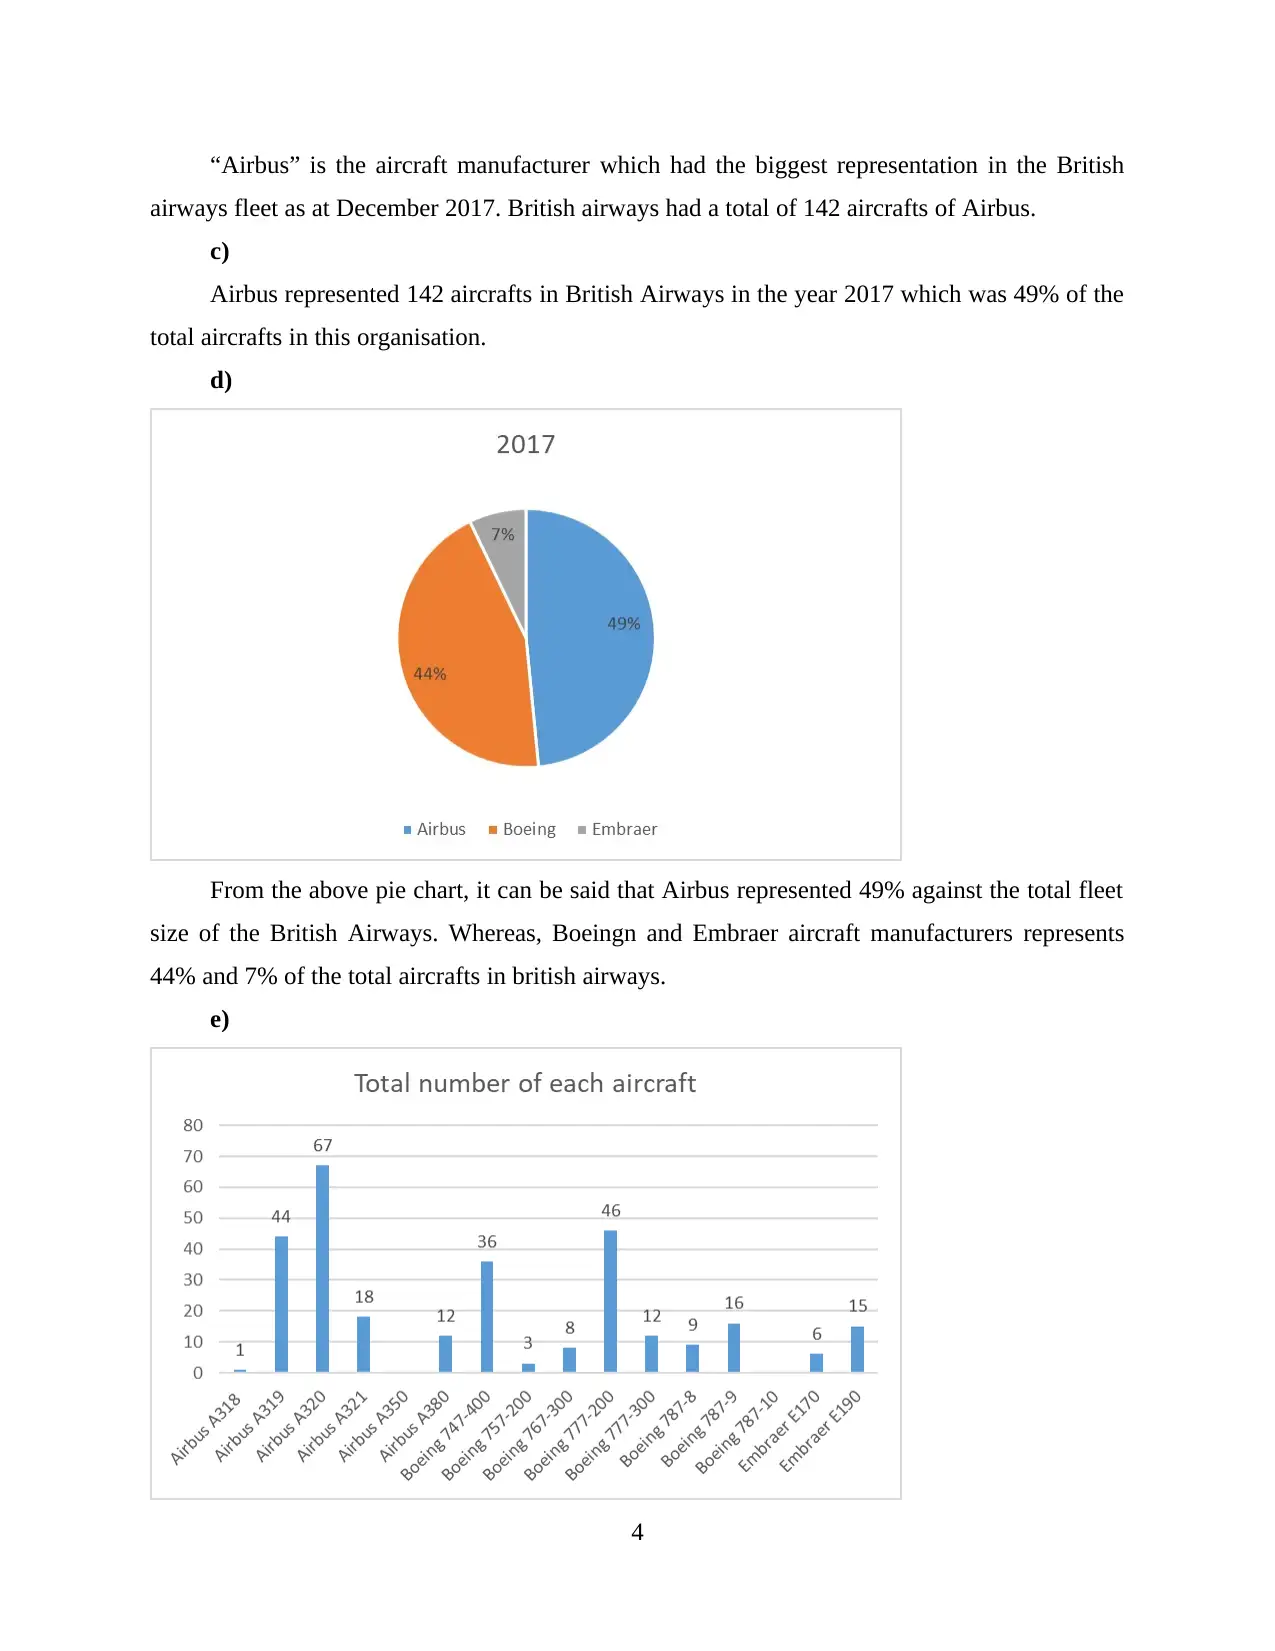
“Airbus” is the aircraft manufacturer which had the biggest representation in the British
airways fleet as at December 2017. British airways had a total of 142 aircrafts of Airbus.
c)
Airbus represented 142 aircrafts in British Airways in the year 2017 which was 49% of the
total aircrafts in this organisation.
d)
From the above pie chart, it can be said that Airbus represented 49% against the total fleet
size of the British Airways. Whereas, Boeingn and Embraer aircraft manufacturers represents
44% and 7% of the total aircrafts in british airways.
e)
4
Paraphrase This Document
Need a fresh take? Get an instant paraphrase of this document with our AI Paraphraser
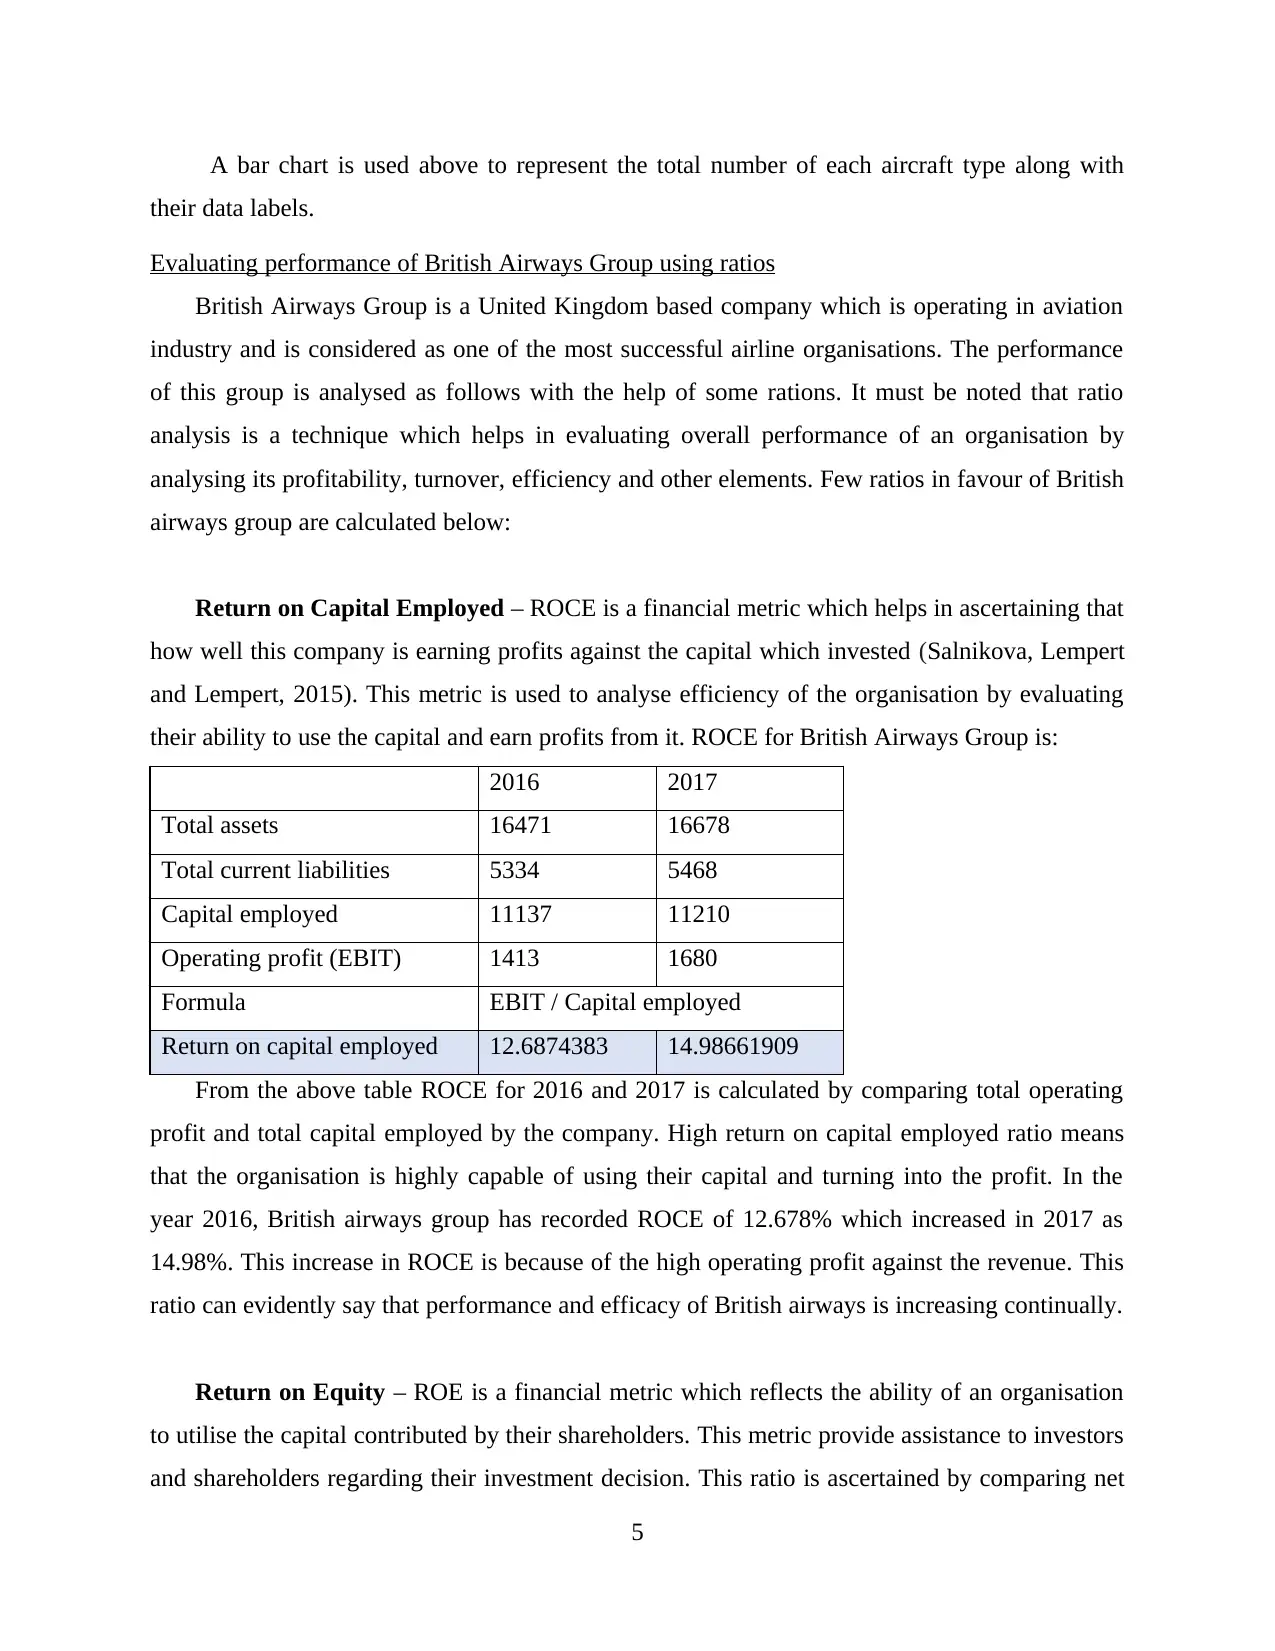
A bar chart is used above to represent the total number of each aircraft type along with
their data labels.
Evaluating performance of British Airways Group using ratios
British Airways Group is a United Kingdom based company which is operating in aviation
industry and is considered as one of the most successful airline organisations. The performance
of this group is analysed as follows with the help of some rations. It must be noted that ratio
analysis is a technique which helps in evaluating overall performance of an organisation by
analysing its profitability, turnover, efficiency and other elements. Few ratios in favour of British
airways group are calculated below:
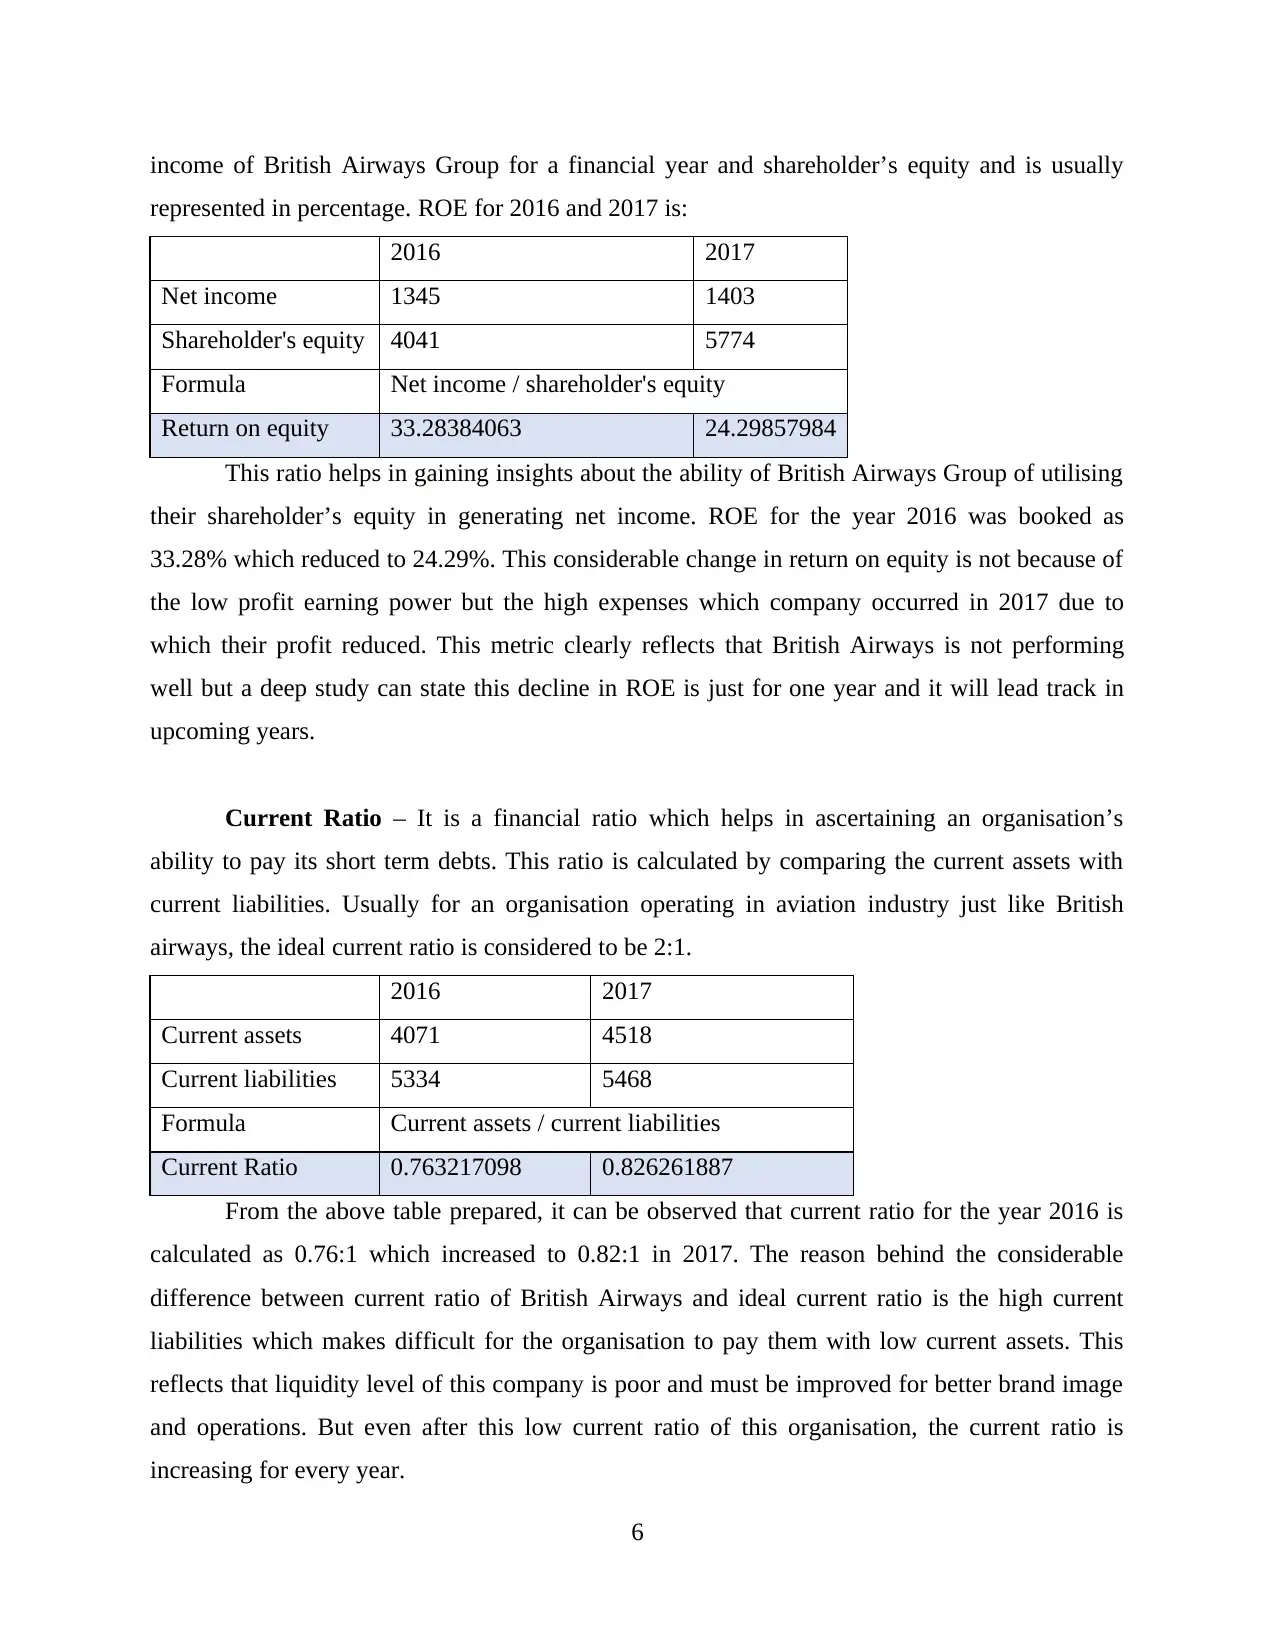
Return on Capital Employed – ROCE is a financial metric which helps in ascertaining that
how well this company is earning profits against the capital which invested (Salnikova, Lempert
and Lempert, 2015). This metric is used to analyse efficiency of the organisation by evaluating
their ability to use the capital and earn profits from it. ROCE for British Airways Group is:
2016 2017
Total assets 16471 16678
Total current liabilities 5334 5468
Capital employed 11137 11210
Operating profit (EBIT) 1413 1680
Formula EBIT / Capital employed
Return on capital employed 12.6874383 14.98661909
From the above table ROCE for 2016 and 2017 is calculated by comparing total operating
profit and total capital employed by the company. High return on capital employed ratio means
that the organisation is highly capable of using their capital and turning into the profit. In the
year 2016, British airways group has recorded ROCE of 12.678% which increased in 2017 as
14.98%. This increase in ROCE is because of the high operating profit against the revenue. This
ratio can evidently say that performance and efficacy of British airways is increasing continually.
Return on Equity – ROE is a financial metric which reflects the ability of an organisation
to utilise the capital contributed by their shareholders. This metric provide assistance to investors
and shareholders regarding their investment decision. This ratio is ascertained by comparing net
5
their data labels.
Evaluating performance of British Airways Group using ratios
British Airways Group is a United Kingdom based company which is operating in aviation
industry and is considered as one of the most successful airline organisations. The performance
of this group is analysed as follows with the help of some rations. It must be noted that ratio
analysis is a technique which helps in evaluating overall performance of an organisation by
analysing its profitability, turnover, efficiency and other elements. Few ratios in favour of British
airways group are calculated below:
Return on Capital Employed – ROCE is a financial metric which helps in ascertaining that
how well this company is earning profits against the capital which invested (Salnikova, Lempert
and Lempert, 2015). This metric is used to analyse efficiency of the organisation by evaluating
their ability to use the capital and earn profits from it. ROCE for British Airways Group is:
2016 2017
Total assets 16471 16678
Total current liabilities 5334 5468
Capital employed 11137 11210
Operating profit (EBIT) 1413 1680
Formula EBIT / Capital employed
Return on capital employed 12.6874383 14.98661909
From the above table ROCE for 2016 and 2017 is calculated by comparing total operating
profit and total capital employed by the company. High return on capital employed ratio means
that the organisation is highly capable of using their capital and turning into the profit. In the
year 2016, British airways group has recorded ROCE of 12.678% which increased in 2017 as
14.98%. This increase in ROCE is because of the high operating profit against the revenue. This
ratio can evidently say that performance and efficacy of British airways is increasing continually.
Return on Equity – ROE is a financial metric which reflects the ability of an organisation
to utilise the capital contributed by their shareholders. This metric provide assistance to investors
and shareholders regarding their investment decision. This ratio is ascertained by comparing net
5
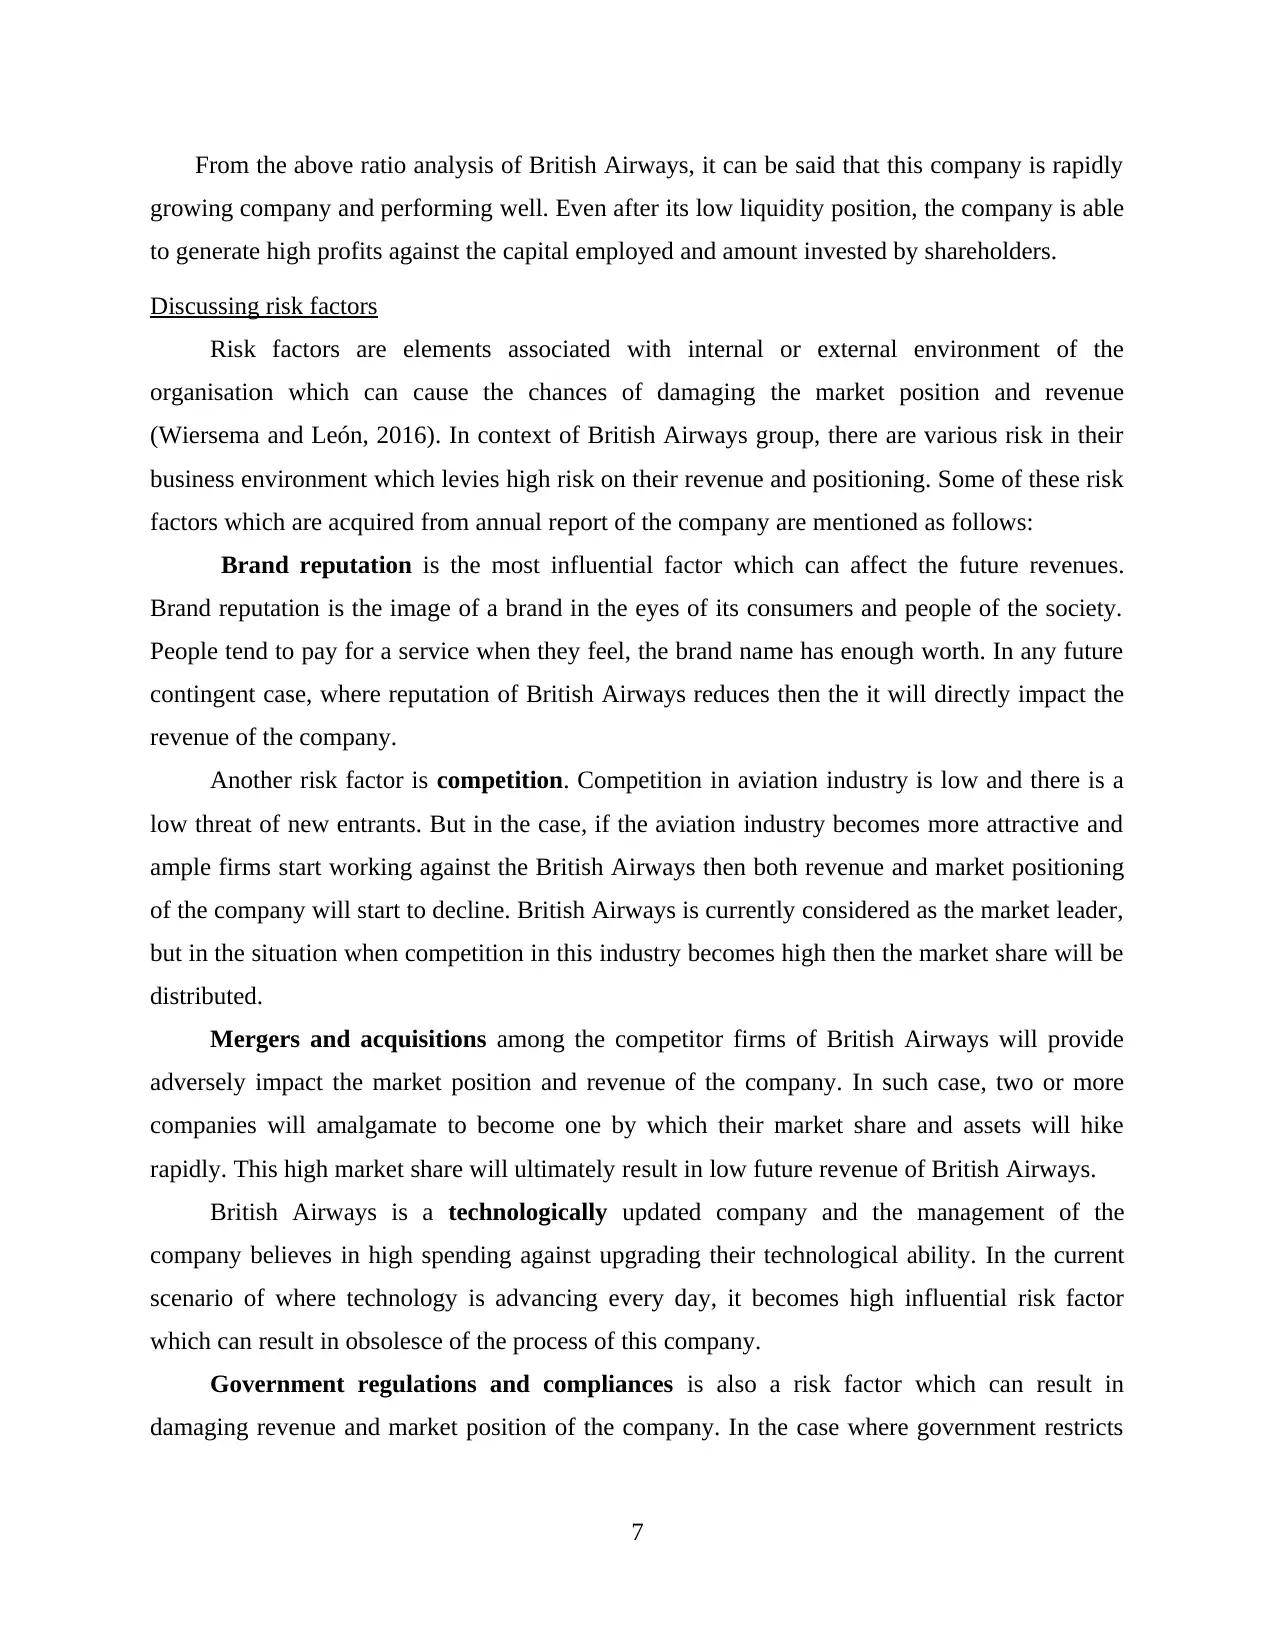
income of British Airways Group for a financial year and shareholder’s equity and is usually
represented in percentage. ROE for 2016 and 2017 is:
2016 2017
Net income 1345 1403
Shareholder's equity 4041 5774
Formula Net income / shareholder's equity
Return on equity 33.28384063 24.29857984
This ratio helps in gaining insights about the ability of British Airways Group of utilising
their shareholder’s equity in generating net income. ROE for the year 2016 was booked as
33.28% which reduced to 24.29%. This considerable change in return on equity is not because of
the low profit earning power but the high expenses which company occurred in 2017 due to
which their profit reduced. This metric clearly reflects that British Airways is not performing
well but a deep study can state this decline in ROE is just for one year and it will lead track in
upcoming years.
Current Ratio – It is a financial ratio which helps in ascertaining an organisation’s
ability to pay its short term debts. This ratio is calculated by comparing the current assets with
current liabilities. Usually for an organisation operating in aviation industry just like British
airways, the ideal current ratio is considered to be 2:1.
2016 2017
Current assets 4071 4518
Current liabilities 5334 5468
Formula Current assets / current liabilities
Current Ratio 0.763217098 0.826261887
From the above table prepared, it can be observed that current ratio for the year 2016 is
calculated as 0.76:1 which increased to 0.82:1 in 2017. The reason behind the considerable
difference between current ratio of British Airways and ideal current ratio is the high current
liabilities which makes difficult for the organisation to pay them with low current assets. This
reflects that liquidity level of this company is poor and must be improved for better brand image
and operations. But even after this low current ratio of this organisation, the current ratio is
increasing for every year.
6
⊘ This is a preview!⊘
Do you want full access?
Subscribe today to unlock all pages.
Trusted by 1+ million students worldwide
From the above ratio analysis of British Airways, it can be said that this company is rapidly
growing company and performing well. Even after its low liquidity position, the company is able
to generate high profits against the capital employed and amount invested by shareholders.
Discussing risk factors
Risk factors are elements associated with internal or external environment of the
organisation which can cause the chances of damaging the market position and revenue
(Wiersema and León, 2016). In context of British Airways group, there are various risk in their
business environment which levies high risk on their revenue and positioning. Some of these risk
factors which are acquired from annual report of the company are mentioned as follows:
Brand reputation is the most influential factor which can affect the future revenues.
Brand reputation is the image of a brand in the eyes of its consumers and people of the society.
People tend to pay for a service when they feel, the brand name has enough worth. In any future
contingent case, where reputation of British Airways reduces then the it will directly impact the
revenue of the company.
Another risk factor is competition. Competition in aviation industry is low and there is a
low threat of new entrants. But in the case, if the aviation industry becomes more attractive and
ample firms start working against the British Airways then both revenue and market positioning
of the company will start to decline. British Airways is currently considered as the market leader,
but in the situation when competition in this industry becomes high then the market share will be
distributed.
Mergers and acquisitions among the competitor firms of British Airways will provide
adversely impact the market position and revenue of the company. In such case, two or more
companies will amalgamate to become one by which their market share and assets will hike
rapidly. This high market share will ultimately result in low future revenue of British Airways.
British Airways is a technologically updated company and the management of the
company believes in high spending against upgrading their technological ability. In the current
scenario of where technology is advancing every day, it becomes high influential risk factor
which can result in obsolesce of the process of this company.
Government regulations and compliances is also a risk factor which can result in
damaging revenue and market position of the company. In the case where government restricts
7
Paraphrase This Document
Need a fresh take? Get an instant paraphrase of this document with our AI Paraphraser
operations of the companies operating in aviation industry in future, will directly impact the
market position and strategies of British Airways.
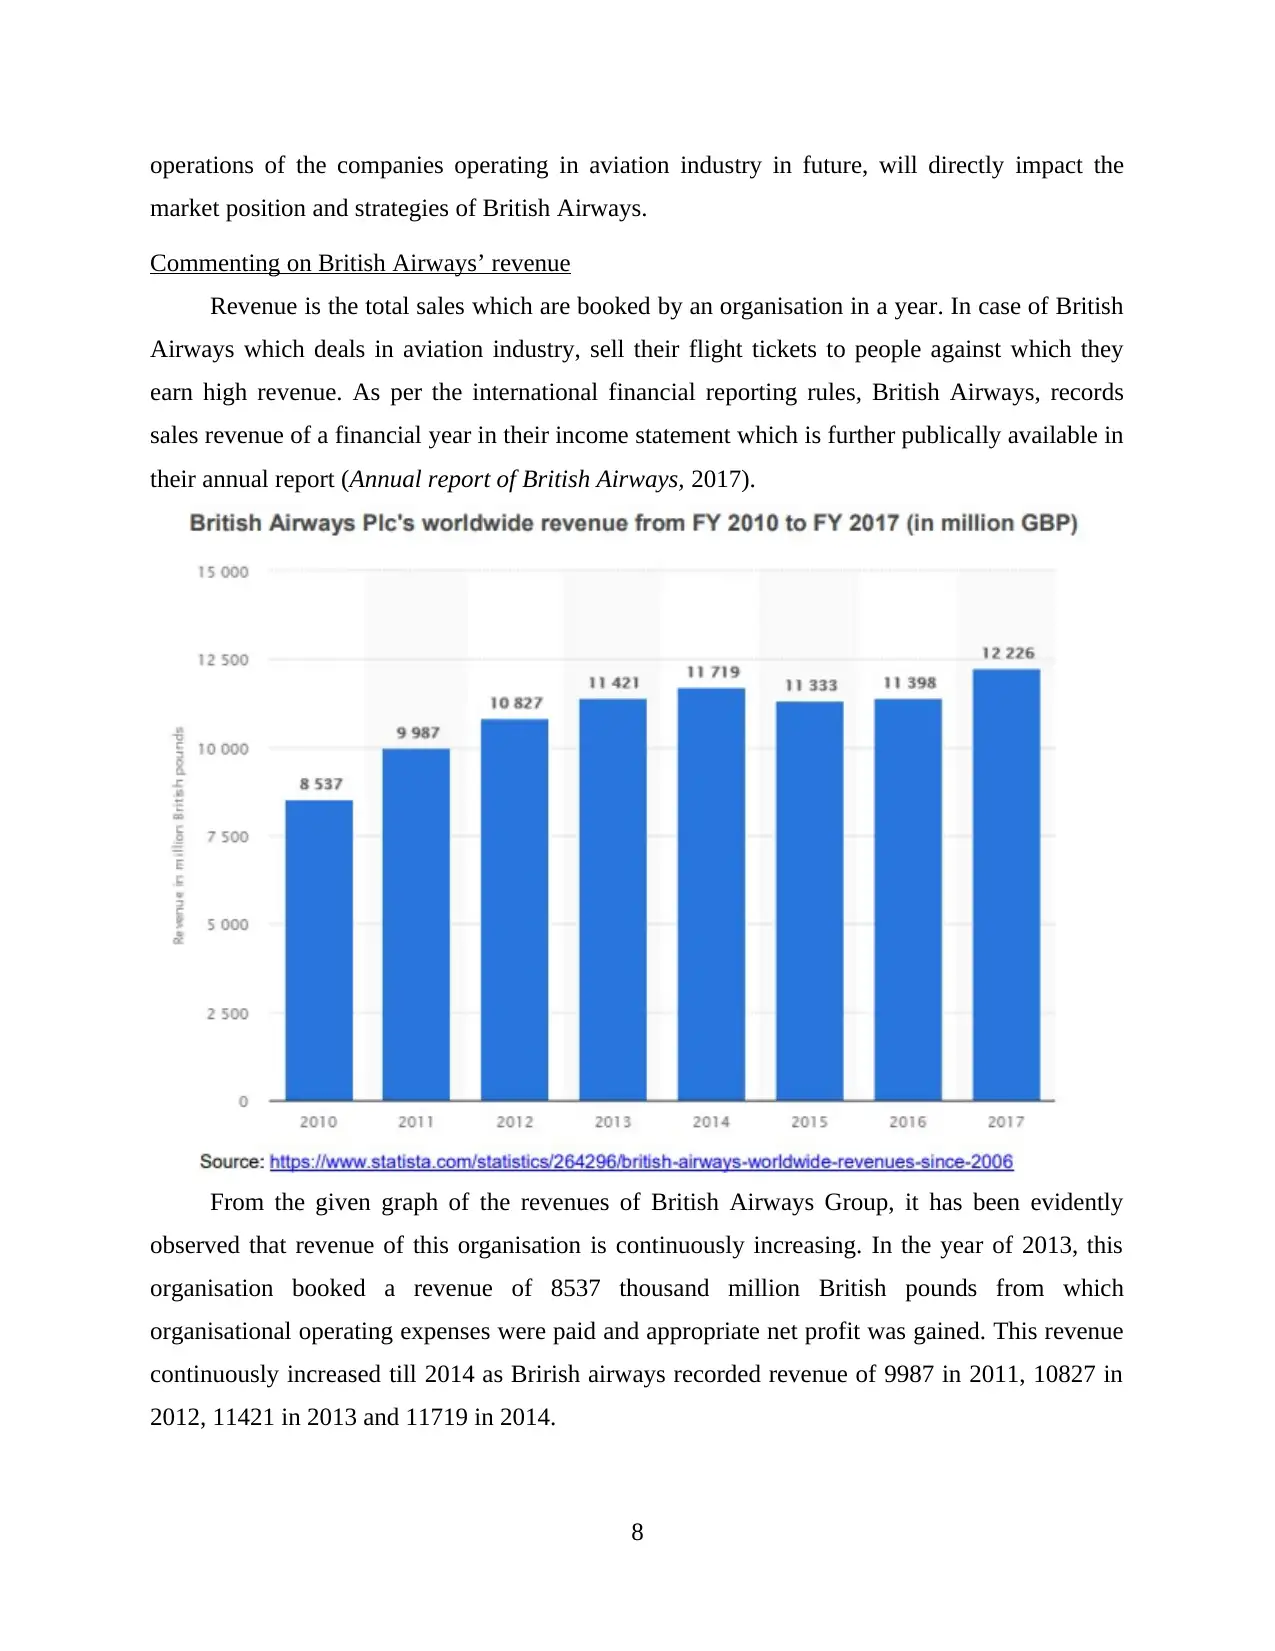
Commenting on British Airways’ revenue
Revenue is the total sales which are booked by an organisation in a year. In case of British
Airways which deals in aviation industry, sell their flight tickets to people against which they
earn high revenue. As per the international financial reporting rules, British Airways, records
sales revenue of a financial year in their income statement which is further publically available in
their annual report (Annual report of British Airways, 2017).
From the given graph of the revenues of British Airways Group, it has been evidently
observed that revenue of this organisation is continuously increasing. In the year of 2013, this
organisation booked a revenue of 8537 thousand million British pounds from which
organisational operating expenses were paid and appropriate net profit was gained. This revenue
continuously increased till 2014 as Brirish airways recorded revenue of 9987 in 2011, 10827 in
2012, 11421 in 2013 and 11719 in 2014.
8
market position and strategies of British Airways.
Commenting on British Airways’ revenue
Revenue is the total sales which are booked by an organisation in a year. In case of British
Airways which deals in aviation industry, sell their flight tickets to people against which they
earn high revenue. As per the international financial reporting rules, British Airways, records
sales revenue of a financial year in their income statement which is further publically available in
their annual report (Annual report of British Airways, 2017).
From the given graph of the revenues of British Airways Group, it has been evidently
observed that revenue of this organisation is continuously increasing. In the year of 2013, this
organisation booked a revenue of 8537 thousand million British pounds from which
organisational operating expenses were paid and appropriate net profit was gained. This revenue
continuously increased till 2014 as Brirish airways recorded revenue of 9987 in 2011, 10827 in
2012, 11421 in 2013 and 11719 in 2014.
8
After 2014, the revenue of British Airways slightly lost the flow and resulted in decreased
revenue as 11333 in 2015. The reason behind this decreased revenue was the ample operating
expenses which were occurred in this year in order to effectively market the brand name. In next
year, revenue of this company was back at its track and then keep on increasing till date. The
revenue recorded in 2016 was 11398 million British pounds which increased in 2017 as 12226
million British pounds.
Years 2013 2014 2015 2016 2017
Revenue 11421 11719 11333 11398 12226
Mean 11619.4
Standard deviation 370.2327646
In order to effectively analyse the pattern and trend of revenue in British Airways, the mean
and standard deviation of revenue of 5 years is also analysed. The mean is the average value of
all the frequencies. The mean represents the average revenue which British Airways has booked
in the interval of five years. From 2013 to 2017, the mean value of revenue of this company is
11619.4. This means average revenue of this company 11619 thousand million British pounds.
Besides this, standard deviation of this company is recoded as 370 which means their error
margin of the booked revenue is 370 thousand million British pounds. In the context of statistics,
standard deviation is the measure of the amount which can variate from the set of values. This
measure is calculated using the number of observations and determined mean. From this it can be
said that standard deviation in regard to British Airways reflects that this company can earn an
addition of 370 thousand million pounds. But this standard error goes both ways which means,
this amount can be either included or reduced from the net revenue of this company.
CONCLUSION
From the above report, it has been concluded that using information from statements and
records is important to get desired results. From the above report, it has been found that data is
usually of two types which is qualitative and quantitative. Both this types of data are analysed
through its unique techniques by which data is statistically presented so that results of the
hypothesis can be determined. The above report is well structured by which it has been observed
that data of organisation can be used to analyse its financial performance and stability. From the
above report, financial stability of British Airways Group is analysed from which it is concluded
that despite of low liquidity ability of the company, the growth margin if this company is high
9
⊘ This is a preview!⊘
Do you want full access?
Subscribe today to unlock all pages.
Trusted by 1+ million students worldwide
1 out of 14
Related Documents


Your All-in-One AI-Powered Toolkit for Academic Success.
+13062052269
info@desklib.com
Available 24*7 on WhatsApp / Email
![[object Object]](/_next/static/media/star-bottom.7253800d.svg)
Unlock your academic potential
Copyright © 2020–2026 A2Z Services. All Rights Reserved. Developed and managed by ZUCOL.