MITS6002 Assignment 1: Data Analysis of Red Wine Quality
VerifiedAdded on 2022/09/14
|14
|998
|14
Presentation
AI Summary
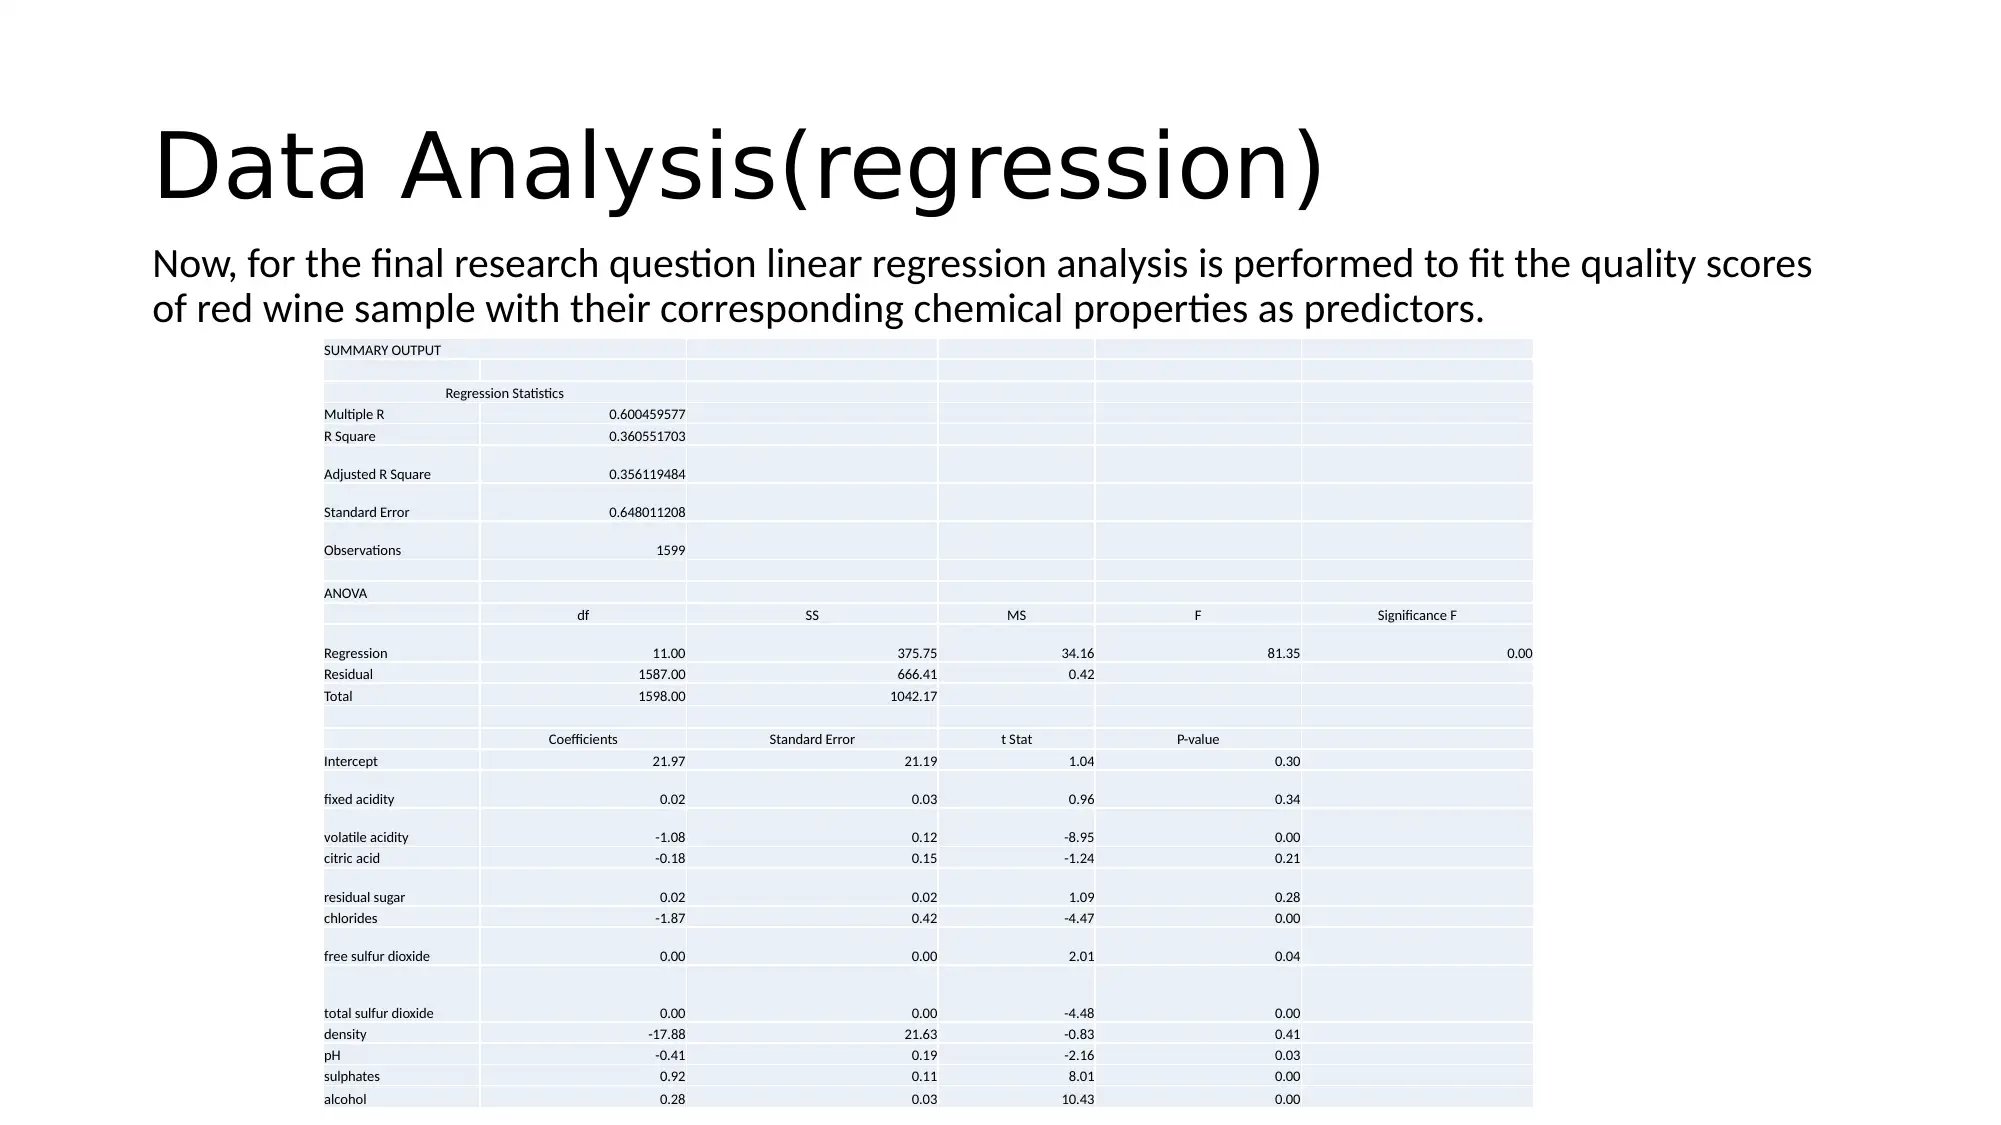
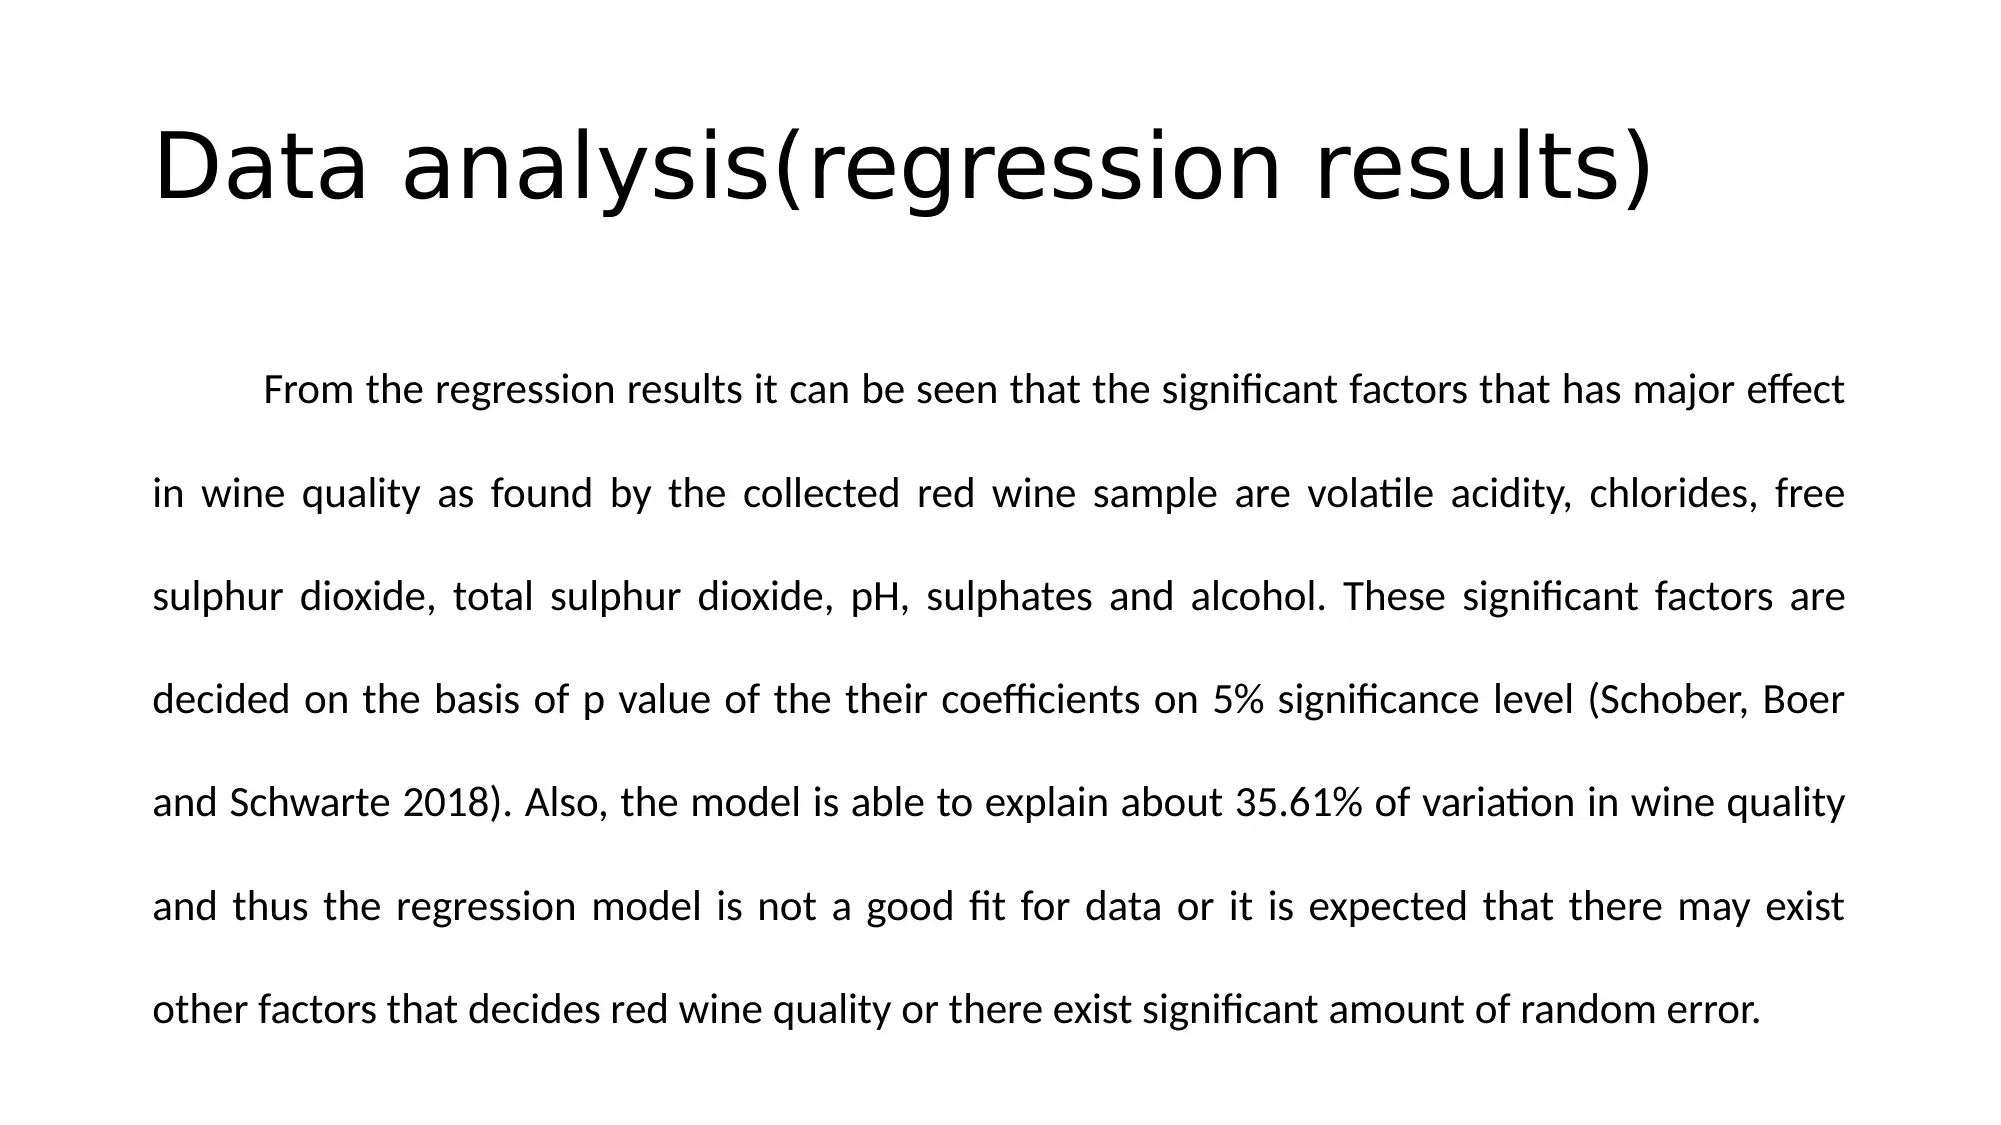
This presentation analyzes a red wine dataset obtained from the UCI Machine Learning Repository to explore the relationship between its chemical properties and quality. The study investigates the distribution of various attributes like pH levels, alcohol content, and sulphates, using visualizations like histograms and pie charts. Further analysis employs linear regression to identify significant factors affecting wine quality, such as volatile acidity, chlorides, and sulphates, and their impact on the wine quality score. The findings suggest that the model explains a portion of the variance in wine quality, while also acknowledging potential limitations due to the dataset's specific origin and the possibility of other influential factors not included in the analysis. The conclusion successfully addresses the research objectives, providing insights into the characteristics and dependencies of red wine attributes.

Introduction:
In this particular research data analysis techniques are used to find information of chemical
properties of red wine and how those properties express the quality of the red wine is attempted to be
explored. Red wine is one of the most popular wine which is consumed by a large proportion of people
around the world. Sometimes it is also prescribed by doctors to take red wine in day for a suitable
proportion as it helps to maintain good heart health, prevents brain damage after stroke, prevents breast
and colon cancer and has many more health benefits. Thus in this research a specific red wine sample is
collected from UCI machine learning website that was originally collected from the brand Vinho Verde in
the north side of Portugal and then important findings about red wine is explored by means of data
analysis.
Secure Best Marks with AI Grader
Need help grading? Try our AI Grader for instant feedback on your assignments.

Dataset information
The dataset contains a total of 12 attributes with 1599 instances with no missing values as given by the following variable names.
1. fixed acidity
2. volatile acidity
3. citric acid
4. residual sugar
5. chlorides
6. free sulphur dioxide
7. total sulphur dioxide
8. density
9. pH
10. sulphates
11. alcohol
12. quality (score between 0 and 10)
All the attributes have real values obtained by physiochemical testing of the red wines as done by Cortez and others. A detail
description of the variables can be found in UCI website (Archive.ics.uci.edu. 2020).

Research questions
The research questions are formed to understand the distribution of
selective attributes of red wines as given below.
1) Distribution of quality scores of the red wine sample
2) Distribution of pH levels of the red wine sample
3) Distribution of alcohol in red wine sample
4) Distribution of sulphates in red wine sample

Research questions
In addition to the research questions relating to distribution of different
attributes of wine, further, two research questions are formed as
1) Relationship between fixed acidity percentage and the pH value of
the red wines
2) Significant factors or variables that express wine quality.
In addition to the research questions relating to distribution of different
attributes of wine, further, two research questions are formed as
1) Relationship between fixed acidity percentage and the pH value of
the red wines
2) Significant factors or variables that express wine quality.
Secure Best Marks with AI Grader
Need help grading? Try our AI Grader for instant feedback on your assignments.

Data analysis
Now, for answering the research questions different visualizations and statistical methods are used.
However, at first the descriptive statistics of all the variables are presented as given below.
Measure fixed acidity volatile acidity citric acid residual sugar chlorides free sulfur dioxide total sulfur dioxide density pH sulphates alcohol quality
Mean 8.319637273 0.527820513 0.27097561 2.538805503 0.087467 15.87492183 46.46779237 0.996747 3.311113 0.658149 10.42298 5.636023
Standard Error0.043541017 0.004477892 0.004871551 0.035259222 0.001177 0.261585683 0.822640227 4.72E-05 0.003861 0.004239 0.02665 0.020196
Median 7.9 0.52 0.26 2.2 0.079 14 38 0.99675 3.31 0.62 10.2 6
Mode 7.2 0.6 0 2 0.08 6 28 0.9972 3.3 0.6 9.5 5
Standard Deviation1.741096318 0.179059704 0.194801137 1.40992806 0.047065 10.46015697 32.89532448 0.001887 0.154386 0.169507 1.065668 0.807569
Sample Variance3.031416389 0.032062378 0.037947483 1.987897133 0.002215 109.4148838 1082.102373 3.56E-06 0.023835 0.028733 1.135647 0.652168
Kurtosis 1.132143398 1.22554225 -0.788997515 28.61759542 41.71579 2.023562046 3.809824488 0.934079 0.806943 11.72025 0.200029 0.296708
Skewness 0.982751441 0.671592572 0.318337295 4.540655426 5.680347 1.250567293 1.515531258 0.071288 0.193683 2.428672 0.860829 0.217802
Range 11.3 1.46 1 14.6 0.599 71 283 0.01362 1.27 1.67 6.5 5
Minimum 4.6 0.12 0 0.9 0.012 1 6 0.99007 2.74 0.33 8.4 3
Maximum 15.9 1.58 1 15.5 0.611 72 289 1.00369 4.01 2 14.9 8
Sum 13303.1 843.985 433.29 4059.55 139.859 25384 74302 1593.798 5294.47 1052.38 16666.35 9012
Count 1599 1599 1599 1599 1599 1599 1599 1599 1599 1599 1599 1599

Data analysis(visualizations)
Now, for answering the first research question the frequency distribution of quality scores are
presented by the following histogram.
From the histogram it can be seen that the red wine quality on an average is very close to 5-6 as
most of the red wines falls in these two categories. Thus the red wine quality can be considered
average as 5-6 indicates average score in a scale of 10.
0 1 2 3 4 5 6 7 8 9 10
0
100
200
300
400
500
600
700
800
Frequency Distribution of red wine quality score
Quality class
Frequency

Data analysis(visualizations)
Distribution of pH levels:
The pie chart indicates maximum percentage which is about 98% of total of red wine have pH value
between 1 and 2 or it can be concluded that most of the red wine are very much acidic.
2%
98%
0%
Pie chart of frequency of ph level
0 to 1 more than 1 to 2 more than 2 to 3
more than 3 to 4 more than 4 to 5
Paraphrase This Document
Need a fresh take? Get an instant paraphrase of this document with our AI Paraphraser

Data analysis(visualizations)
Distribution of alcohol range:
The distribution shows that maximum red wines have alcohol percentage
9 to 10 and the number reduces gradually as the alcohol range reduces
(Morrill 2017). Thus red wines cannot be considered as highly alcoholic.
8 to 9 more than 9
to 10
more than 10
to 11
more than 11
to 12
more than 12
to 13
more than 13
to 14
more than 14
to 15
0
100
200
300
400
500
600
700
800
Frequency distribution of alcohol range
Alcohol range
Frequency

Data analysis(visualizations)
Distribution of sulphates range:
From the above bar chart it is evident that sulphates proportion is in
between 0.5 to 1 for maximum number of red wine and the sulphate is
high 1 to 2 for very less number of red wines.
0 to 0.5 0.5 to 1 1 to 1.5 1.5 to 2
0
200
400
600
800
1000
1200
1400
1600
Bar chart of sulphates range
Axis Title
Axis Title

Data analysis(visualizations)
Relationship between fixed acidity and pH level of red wines:
From the scatterplot a slight downward tendency of pH level is
observed for increased fixed acidity percentage of red wines. This is
expected because as the acidity increase pH value goes close to zero.
4 6 8 10 12 14 16 18
0
0.5
1
1.5
2
2.5
3
3.5
4
4.5
Scatterplot
Fixed acidity
pH levels
Secure Best Marks with AI Grader
Need help grading? Try our AI Grader for instant feedback on your assignments.

Data Analysis(regression)
Now, for the final research question linear regression analysis is performed to fit the quality scores
of red wine sample with their corresponding chemical properties as predictors.
SUMMARY OUTPUT
Regression Statistics
Multiple R 0.600459577
R Square 0.360551703
Adjusted R Square 0.356119484
Standard Error 0.648011208
Observations 1599
ANOVA
df SS MS F Significance F
Regression 11.00 375.75 34.16 81.35 0.00
Residual 1587.00 666.41 0.42
Total 1598.00 1042.17
Coefficients Standard Error t Stat P-value
Intercept 21.97 21.19 1.04 0.30
fixed acidity 0.02 0.03 0.96 0.34
volatile acidity -1.08 0.12 -8.95 0.00
citric acid -0.18 0.15 -1.24 0.21
residual sugar 0.02 0.02 1.09 0.28
chlorides -1.87 0.42 -4.47 0.00
free sulfur dioxide 0.00 0.00 2.01 0.04
total sulfur dioxide 0.00 0.00 -4.48 0.00
density -17.88 21.63 -0.83 0.41
pH -0.41 0.19 -2.16 0.03
sulphates 0.92 0.11 8.01 0.00
alcohol 0.28 0.03 10.43 0.00

Data analysis(regression results)
From the regression results it can be seen that the significant factors that has major effect
in wine quality as found by the collected red wine sample are volatile acidity, chlorides, free
sulphur dioxide, total sulphur dioxide, pH, sulphates and alcohol. These significant factors are
decided on the basis of p value of the their coefficients on 5% significance level (Schober, Boer
and Schwarte 2018). Also, the model is able to explain about 35.61% of variation in wine quality
and thus the regression model is not a good fit for data or it is expected that there may exist
other factors that decides red wine quality or there exist significant amount of random error.

Conclusion
Hence, in conclusion it can be stated that all the research objectives of the
project has been successfully met as the distributions of different chemical attributes
of red wine and dependency between useful attributes are found with satisfactory
results. However, the sample used in this research contains only red wines from the
region of Portugal of a specific brand and thus the results may not be suitable to
express properties of red wine distributed on a global basis.
Paraphrase This Document
Need a fresh take? Get an instant paraphrase of this document with our AI Paraphraser

References
• Schober, P., Boer, C. and Schwarte, L.A., 2018. Correlation coefficients:
appropriate use and interpretation. Anesthesia & Analgesia, 126(5),
pp.1763-1768.
• Morrill, R., 2017. Breaking the Bar Chart Why Chart Types Are Holding
Us Back and How Metaphors Can Help (Doctoral dissertation,
Northeastern University).
• Archive.ics.uci.edu. 2020. UCI Machine Learning Repository: Wine
Quality Data Set. [online] Available at:
<http://archive.ics.uci.edu/ml/datasets/Wine+Quality> [Accessed 7
April 2020].
1 out of 14

Your All-in-One AI-Powered Toolkit for Academic Success.
+13062052269
info@desklib.com
Available 24*7 on WhatsApp / Email
Unlock your academic potential
© 2024 | Zucol Services PVT LTD | All rights reserved.