Data Science Assessment 1: Analysis of Iris Dataset - COIT12209

Verified

Added on  2023/01/19

|18
|2019
|80
Homework Assignment
AI Summary
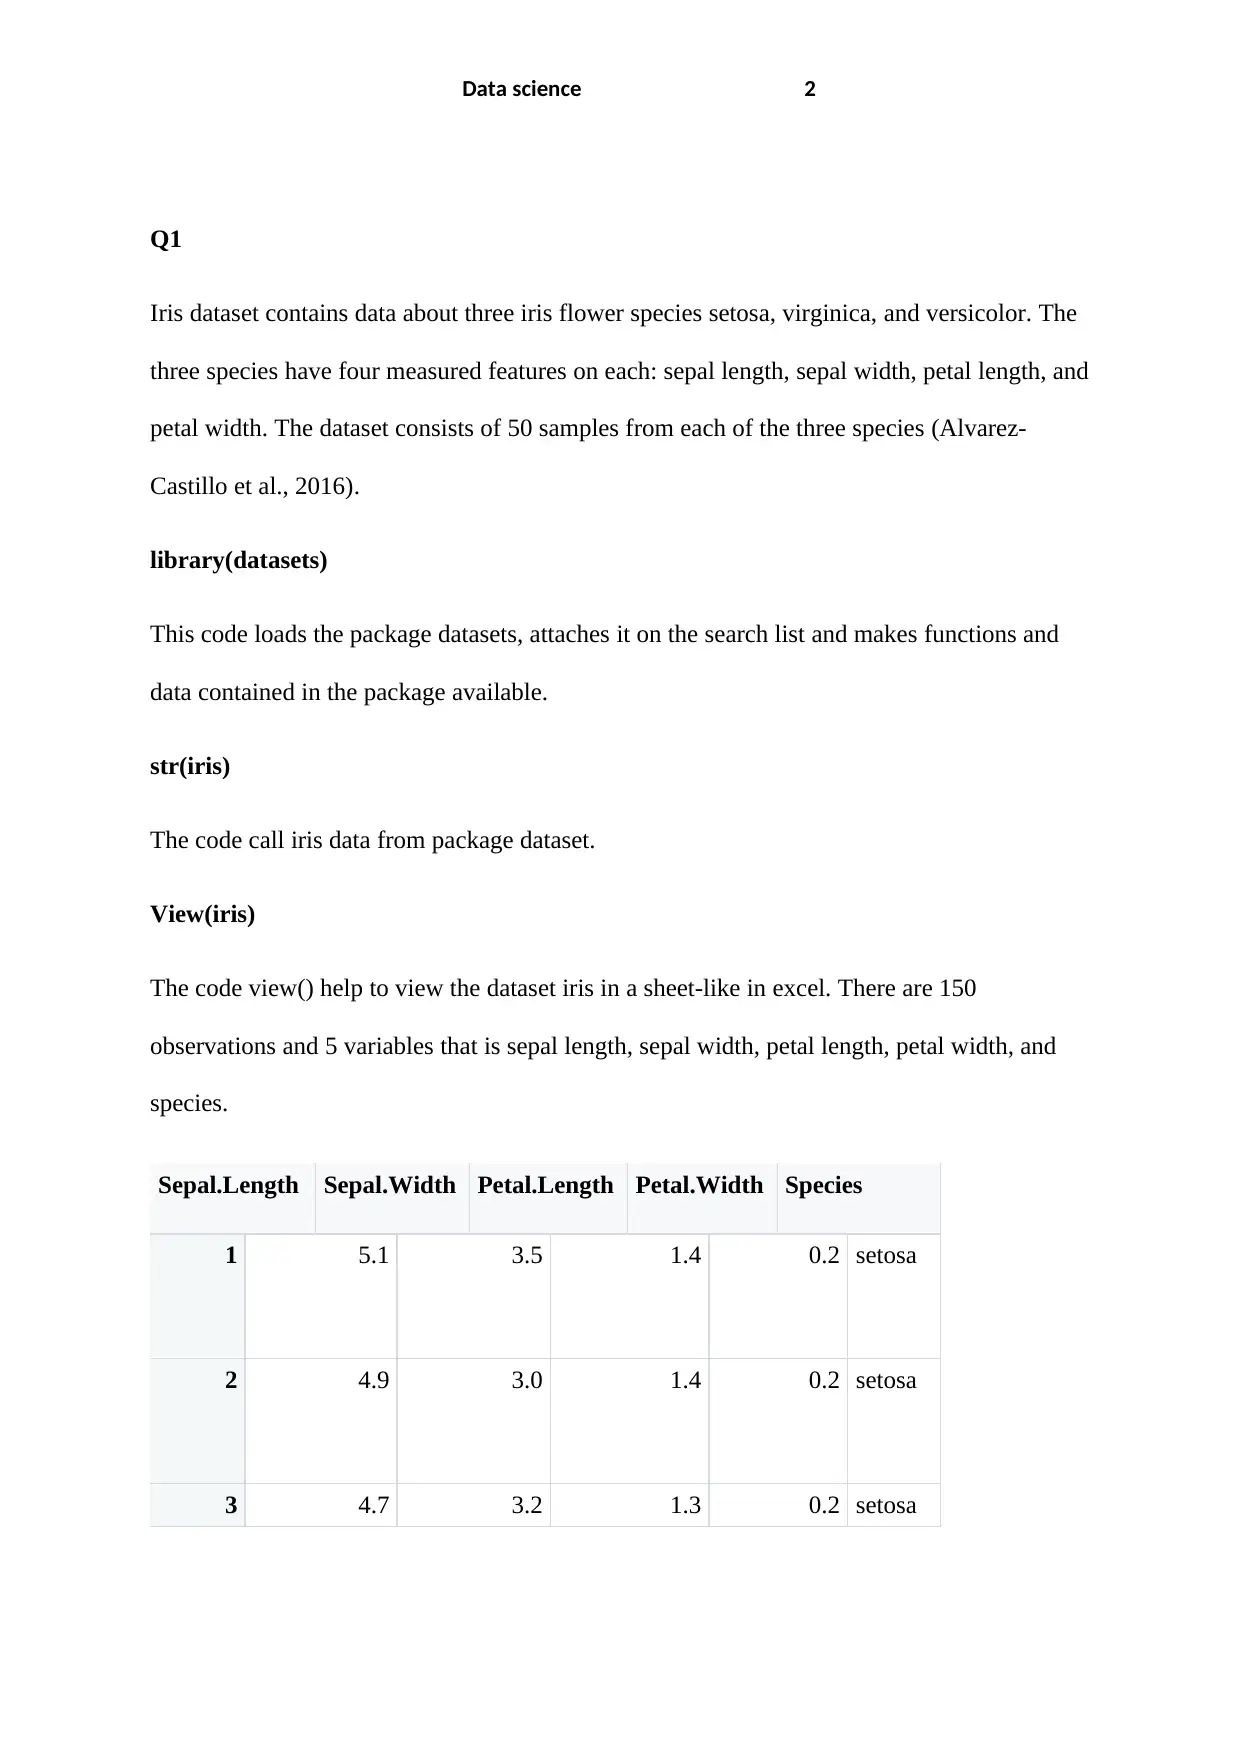
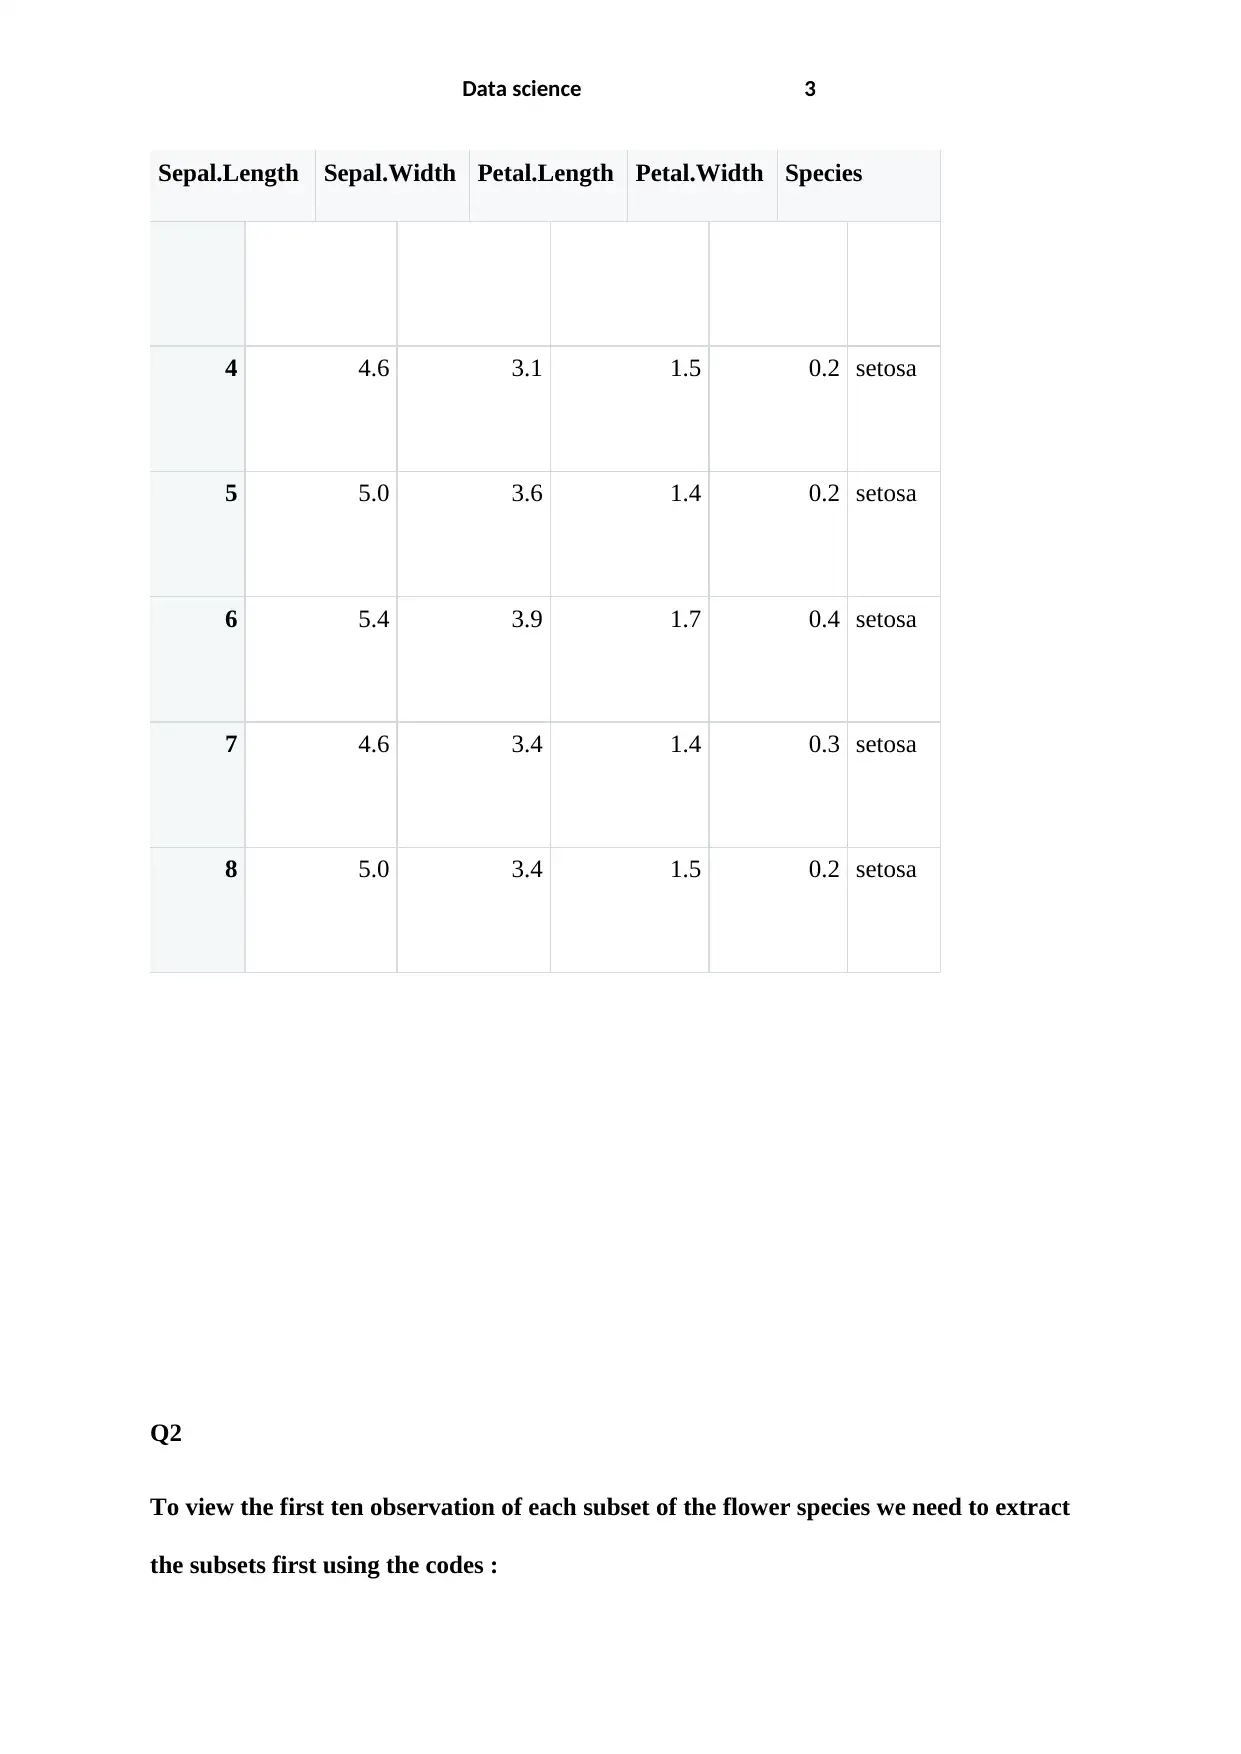
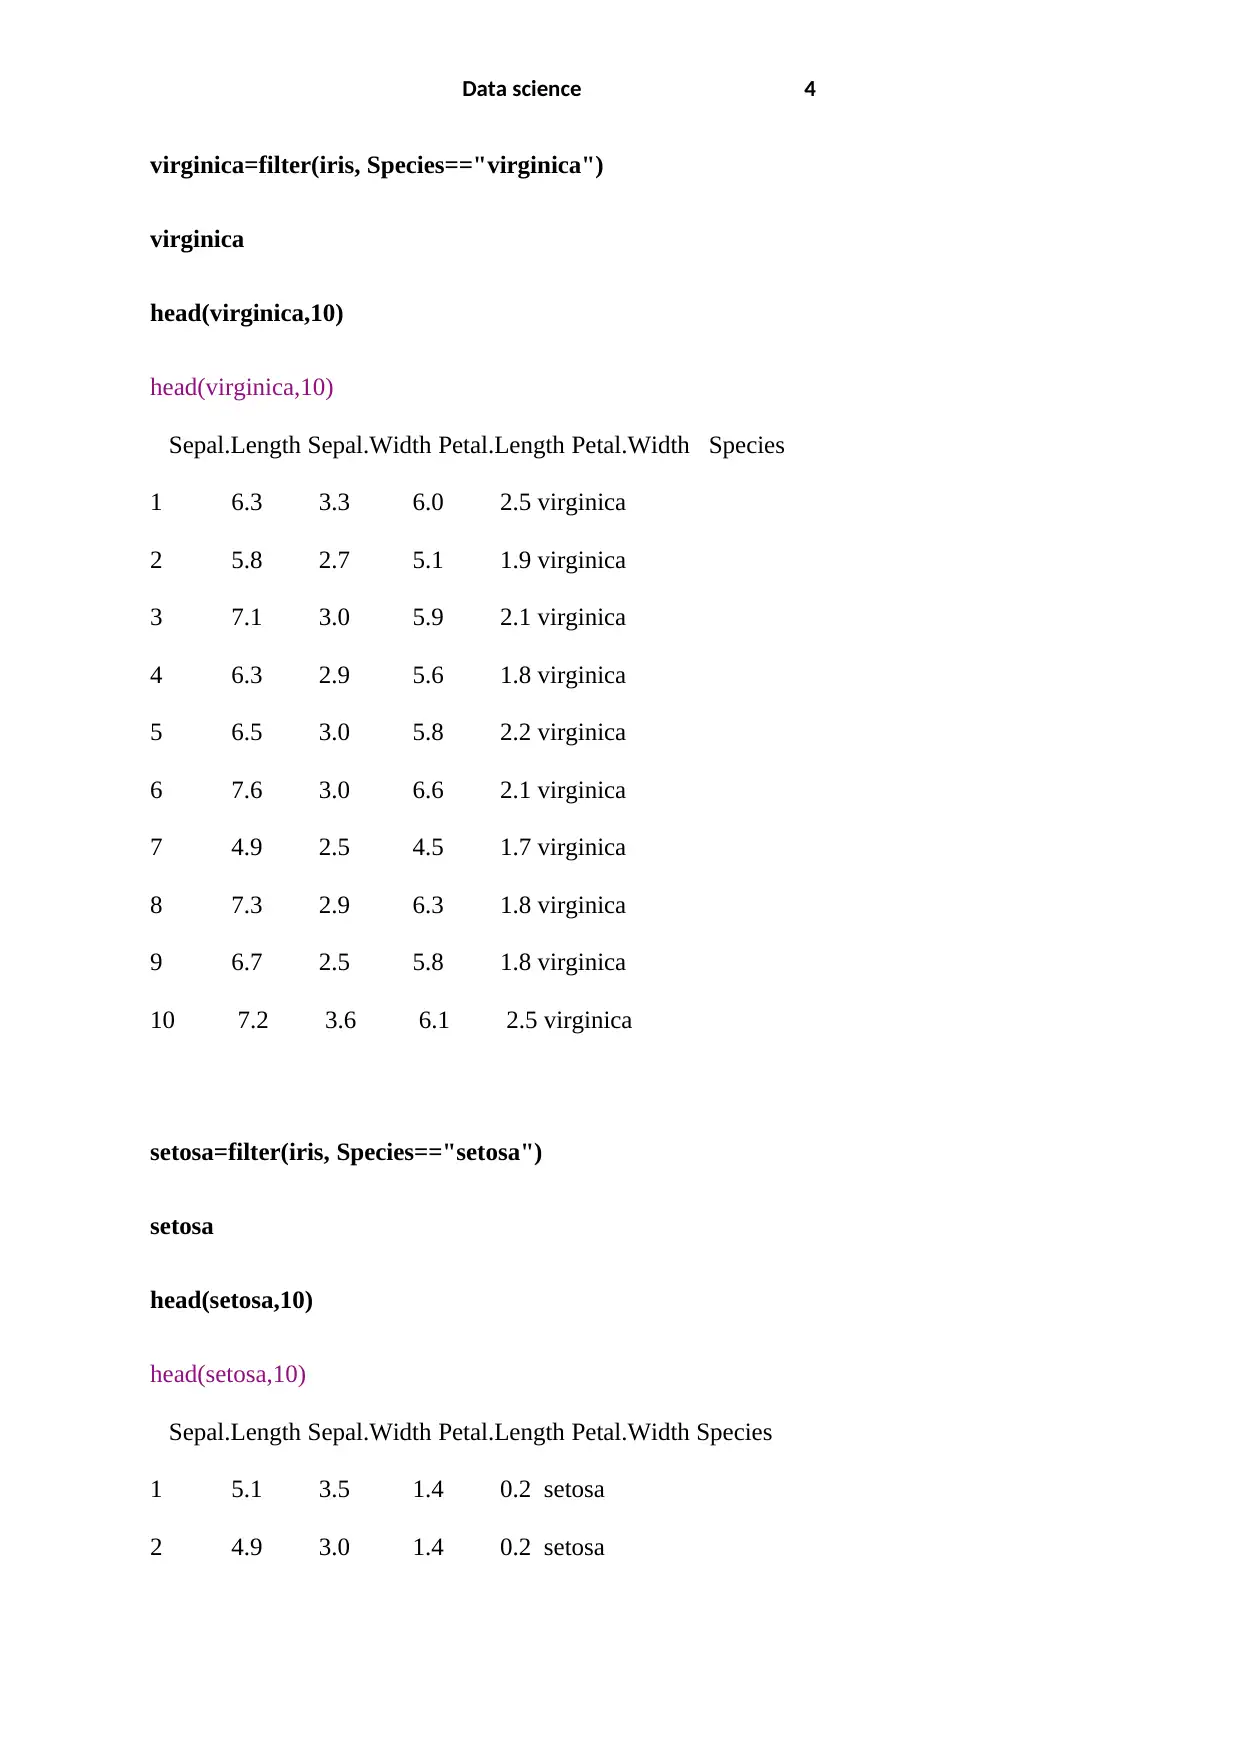
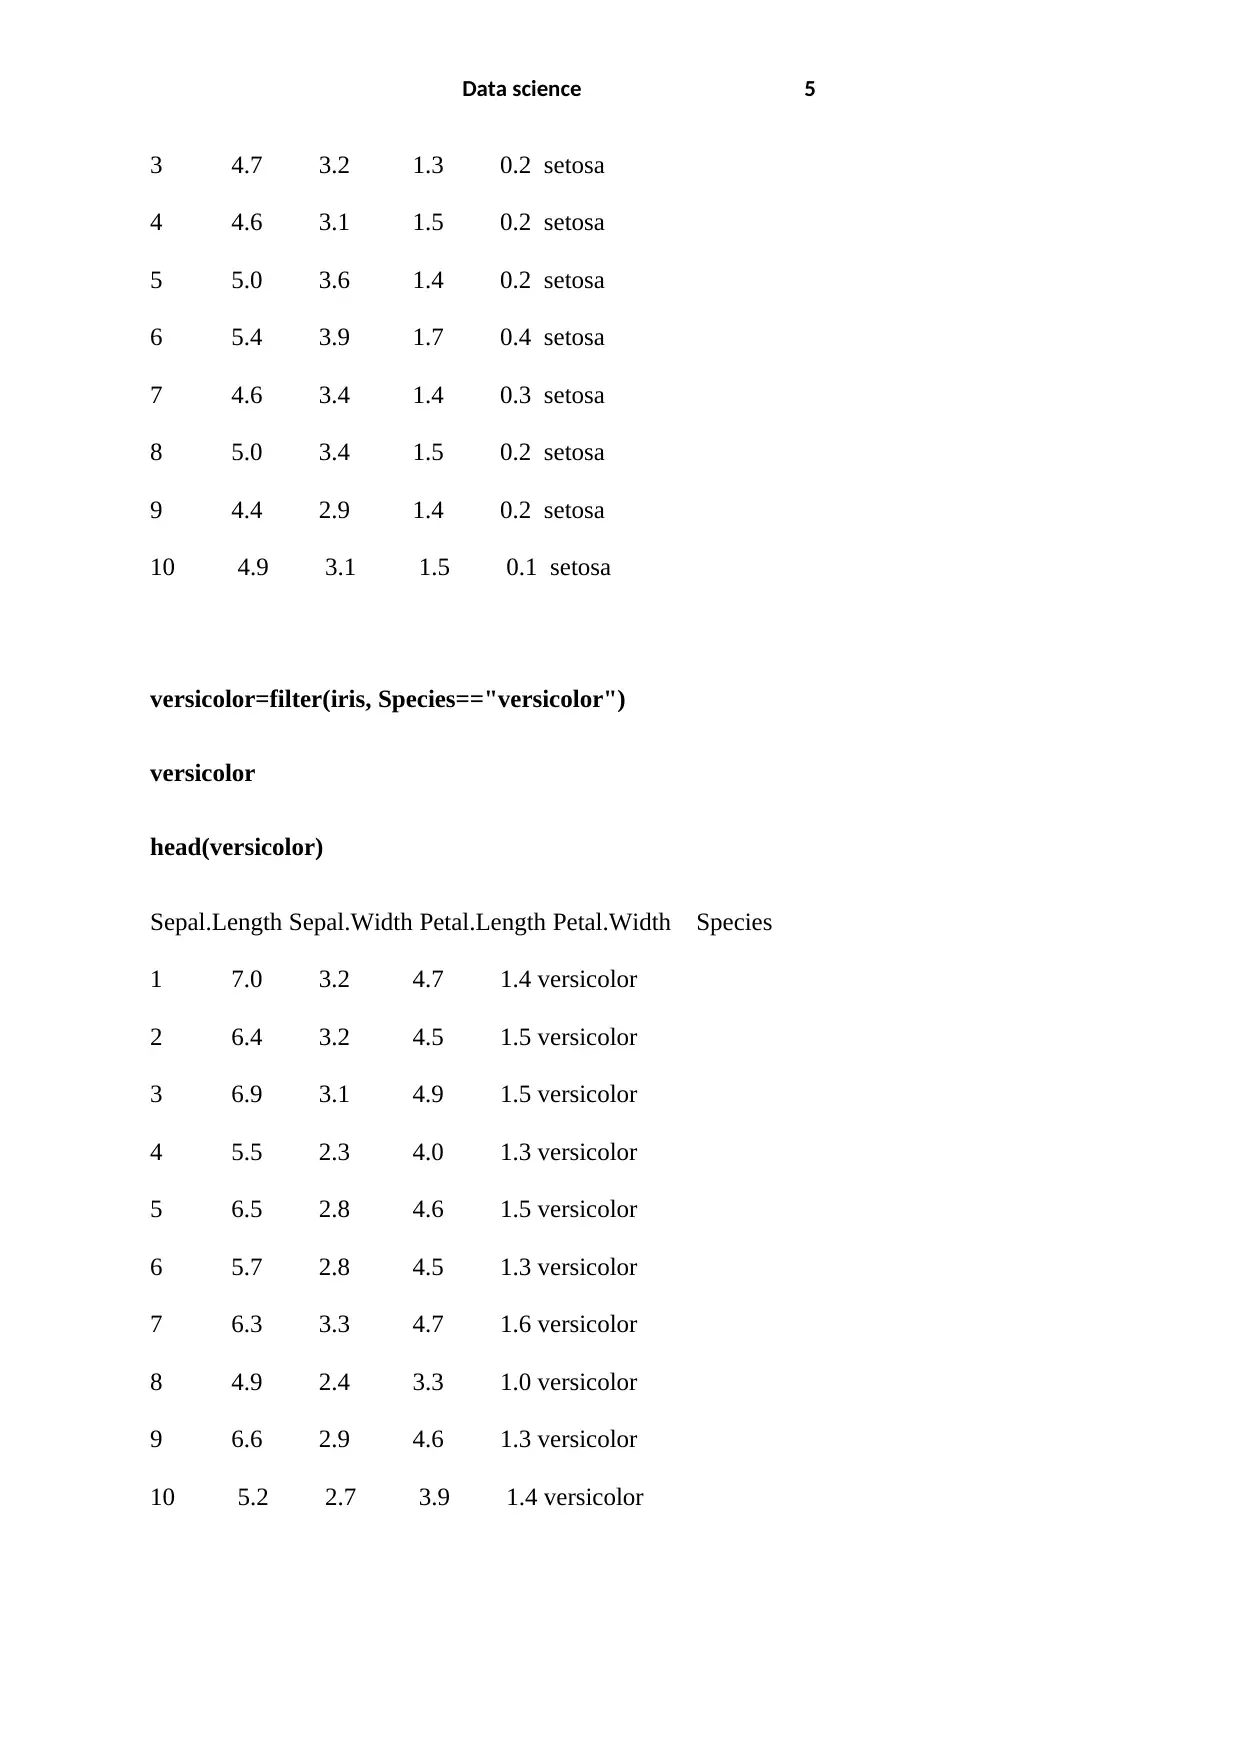
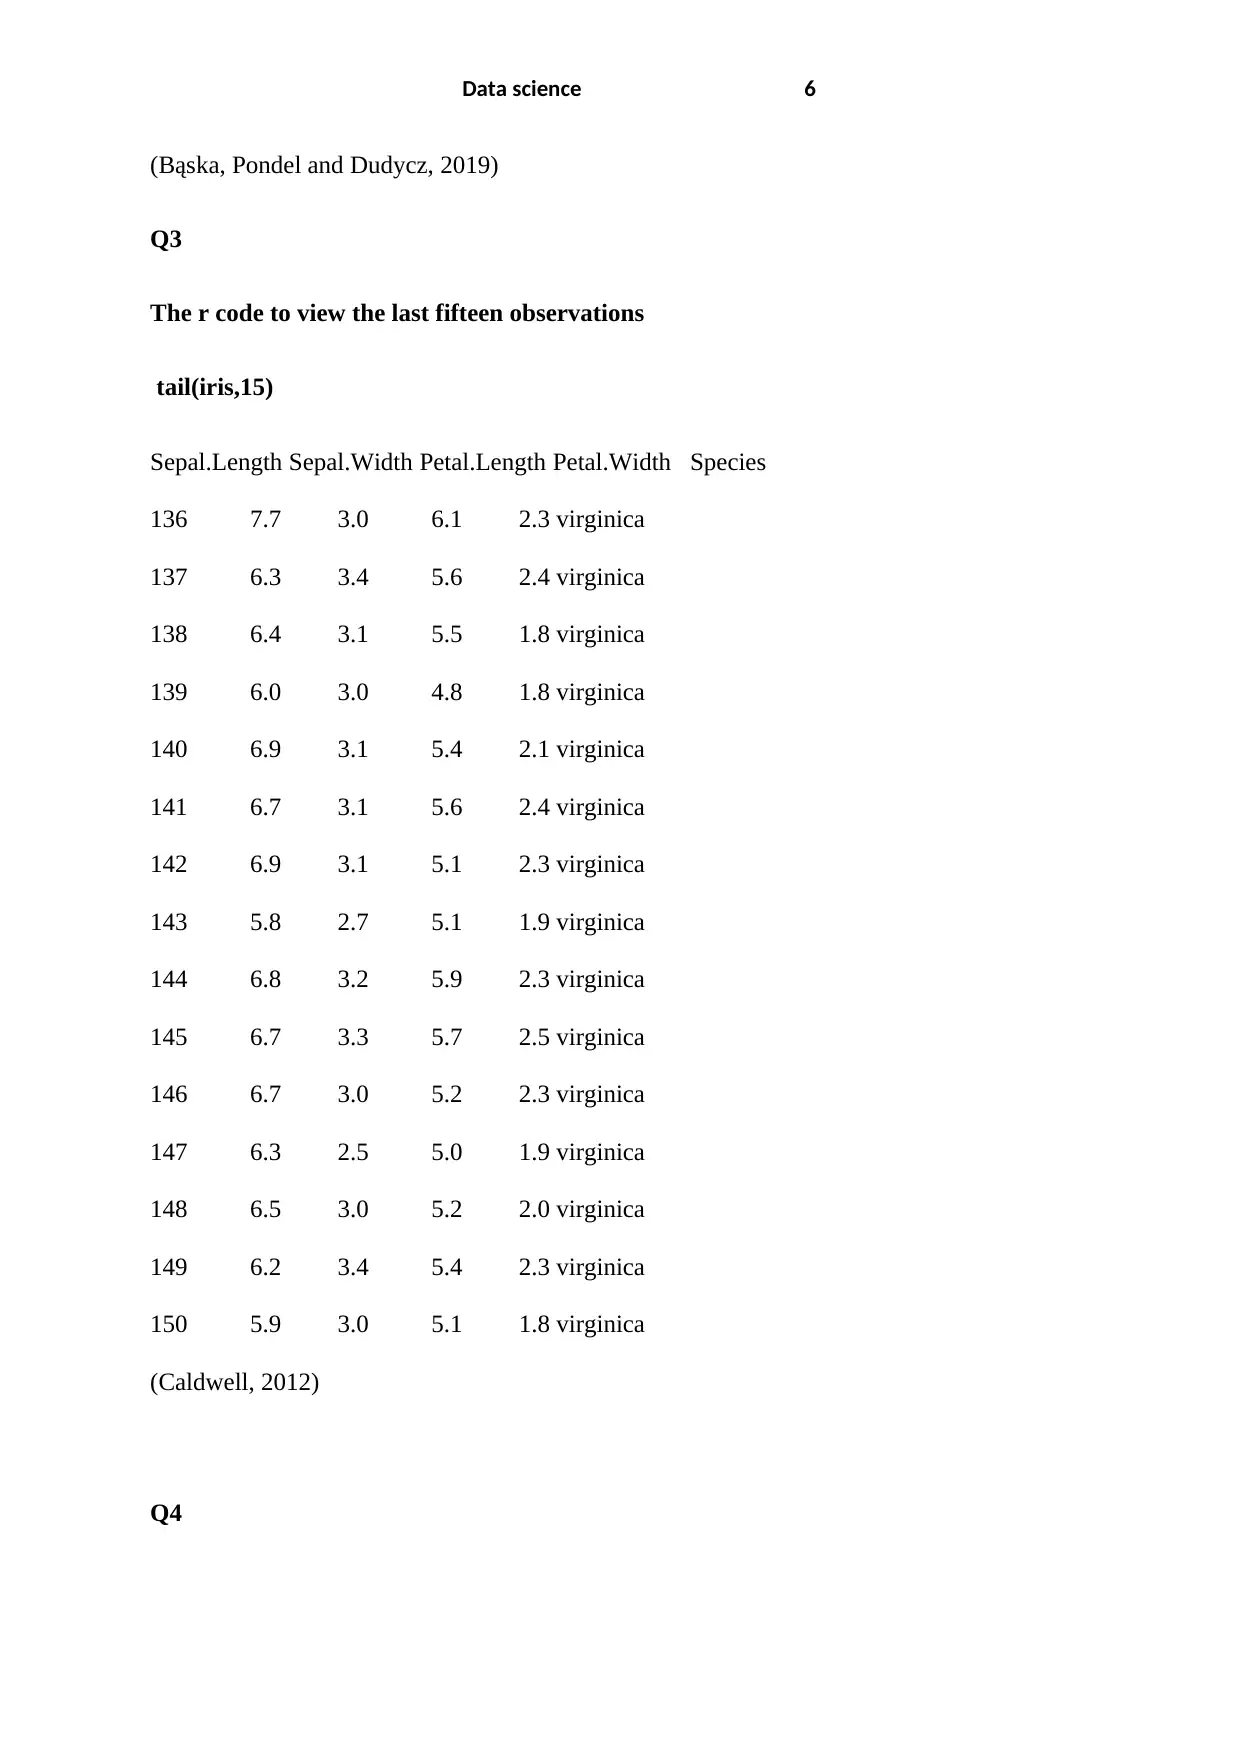
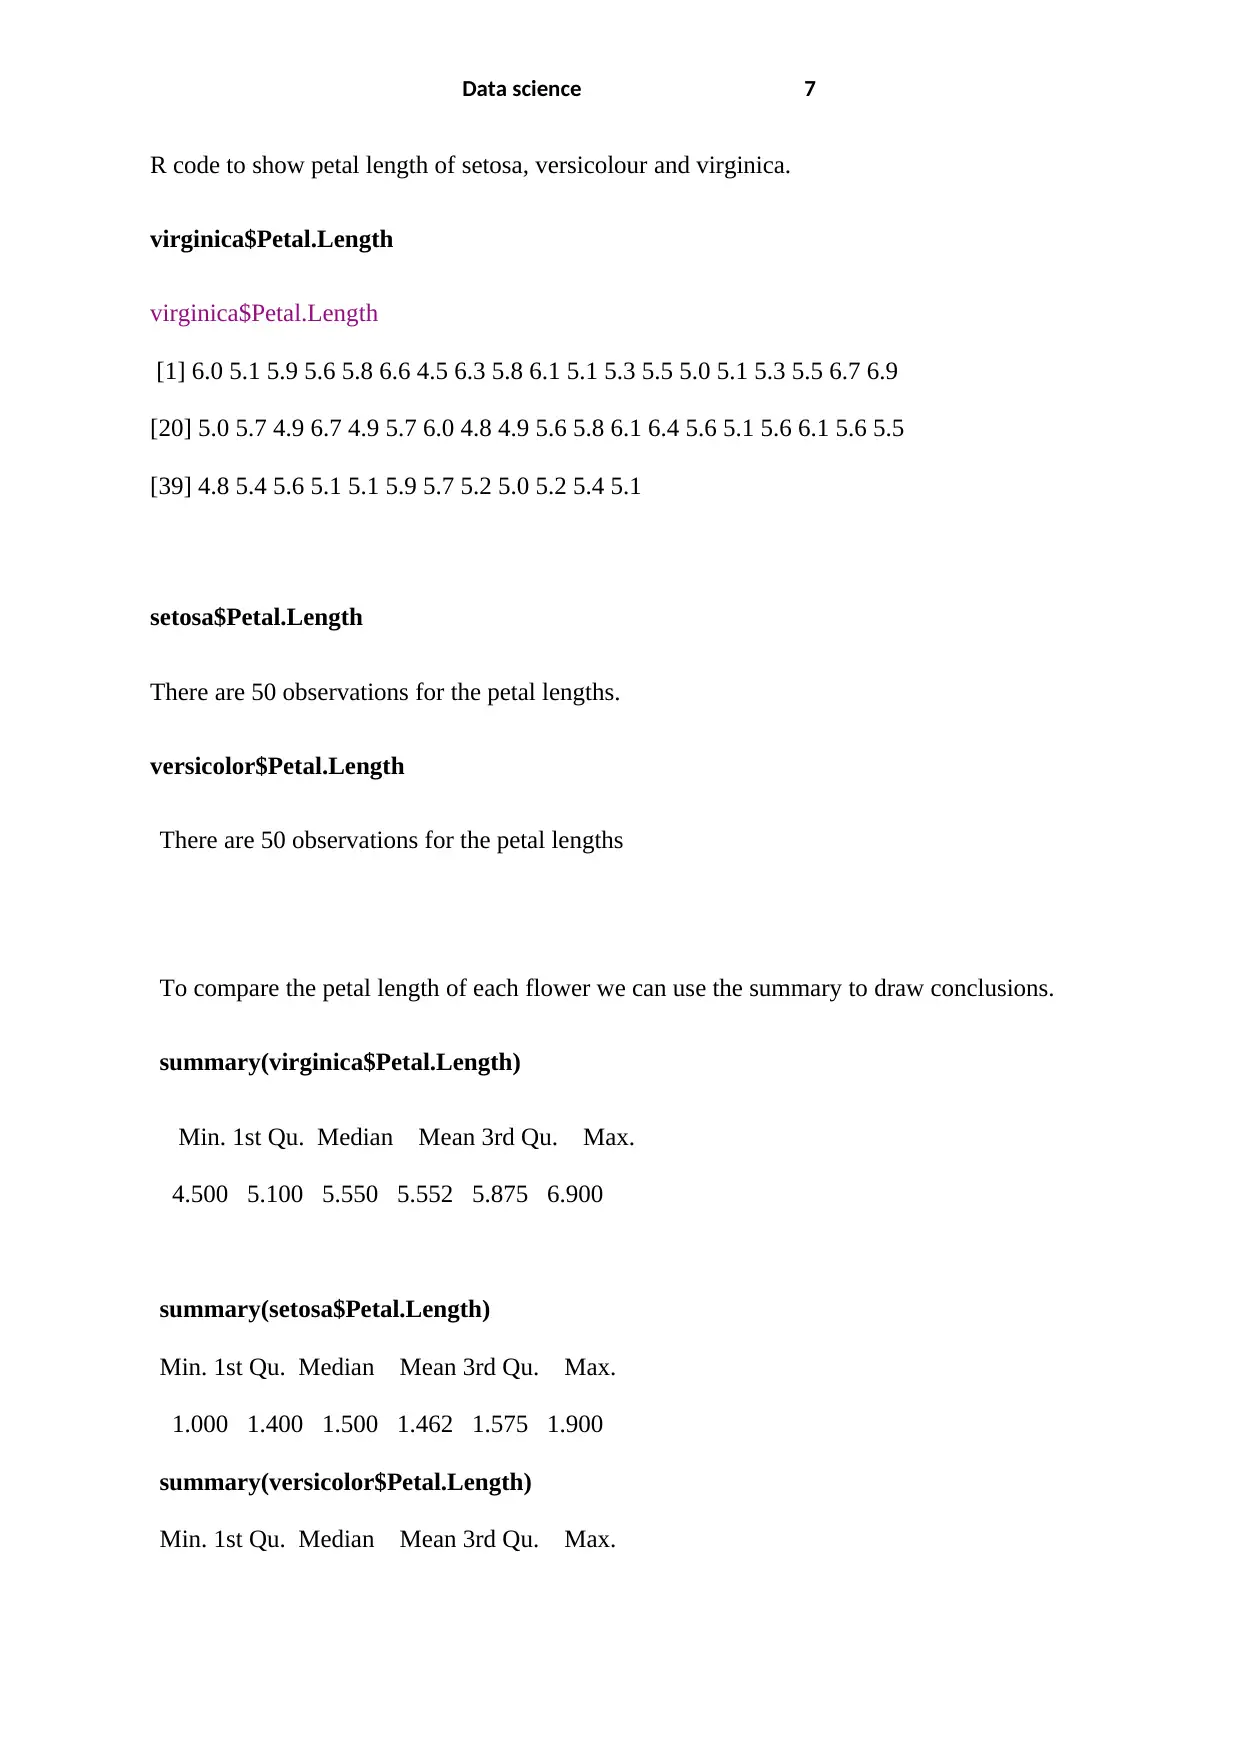
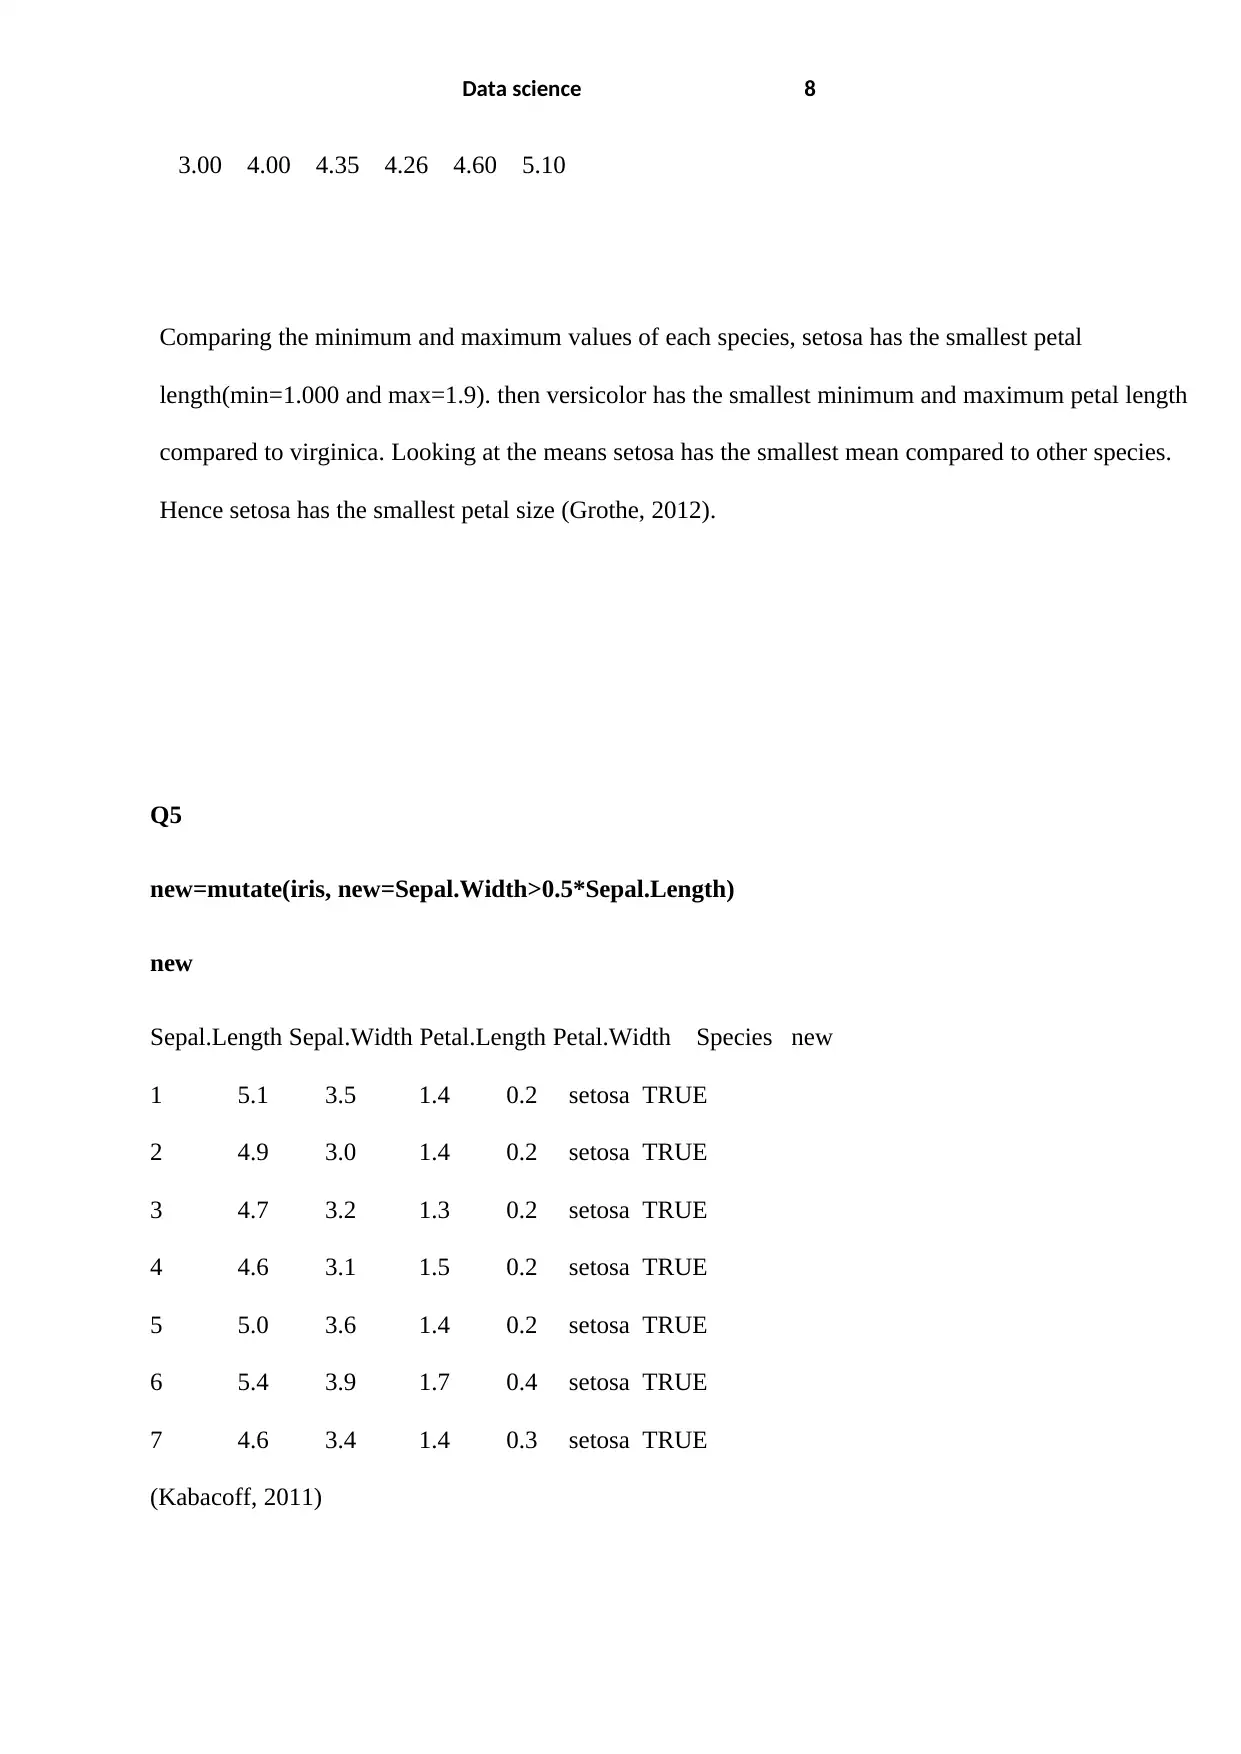
This data science assignment, completed by a student, focuses on the analysis of the Iris dataset using the R programming language. The assignment involves loading the dataset, exploring its structure, and performing various data manipulations and visualizations. The student extracts subsets of the data based on flower species (setosa, virginica, and versicolor) and examines the first ten observations of each. The assignment includes R code to view the last fifteen observations, calculate and compare petal lengths across different species using summary statistics. The student utilizes the `mutate` function to create a new variable based on sepal measurements and generates boxplots and histograms to visualize data distributions. Additionally, the assignment includes scatter plots and correlation matrices to explore relationships between variables, providing insights into the characteristics of each Iris species. References to relevant research papers are also included to support the analysis. This assignment demonstrates the student's ability to apply data science principles to analyze and interpret a real-world dataset.
Document Page
Data science 1
by [Student Name]
Data Science
Tutor: [Tutor Name]
[Institutional Affliliation]
[Department]
[Date]
tabler-icon-diamond-filled.svg

Paraphrase This Document

Need a fresh take? Get an instant paraphrase of this document with our AI Paraphraser
Document Page
Data science 2
Q1
Iris dataset contains data about three iris flower species setosa, virginica, and versicolor. The
three species have four measured features on each: sepal length, sepal width, petal length, and
petal width. The dataset consists of 50 samples from each of the three species (Alvarez-
Castillo et al., 2016).
library(datasets)
This code loads the package datasets, attaches it on the search list and makes functions and
data contained in the package available.
str(iris)
The code call iris data from package dataset.
View(iris)
The code view() help to view the dataset iris in a sheet-like in excel. There are 150
observations and 5 variables that is sepal length, sepal width, petal length, petal width, and
species.
Sepal.Length Sepal.Width Petal.Length Petal.Width Species
1 5.1 3.5 1.4 0.2 setosa
2 4.9 3.0 1.4 0.2 setosa
3 4.7 3.2 1.3 0.2 setosa
Document Page
Data science 3
Sepal.Length Sepal.Width Petal.Length Petal.Width Species
4 4.6 3.1 1.5 0.2 setosa
5 5.0 3.6 1.4 0.2 setosa
6 5.4 3.9 1.7 0.4 setosa
7 4.6 3.4 1.4 0.3 setosa
8 5.0 3.4 1.5 0.2 setosa
Q2
To view the first ten observation of each subset of the flower species we need to extract
the subsets first using the codes :
Document Page
Data science 4
virginica=filter(iris, Species=="virginica")
virginica
head(virginica,10)
head(virginica,10)
Sepal.Length Sepal.Width Petal.Length Petal.Width Species
1 6.3 3.3 6.0 2.5 virginica
2 5.8 2.7 5.1 1.9 virginica
3 7.1 3.0 5.9 2.1 virginica
4 6.3 2.9 5.6 1.8 virginica
5 6.5 3.0 5.8 2.2 virginica
6 7.6 3.0 6.6 2.1 virginica
7 4.9 2.5 4.5 1.7 virginica
8 7.3 2.9 6.3 1.8 virginica
9 6.7 2.5 5.8 1.8 virginica
10 7.2 3.6 6.1 2.5 virginica
setosa=filter(iris, Species=="setosa")
setosa
head(setosa,10)
head(setosa,10)
Sepal.Length Sepal.Width Petal.Length Petal.Width Species
1 5.1 3.5 1.4 0.2 setosa
2 4.9 3.0 1.4 0.2 setosa
tabler-icon-diamond-filled.svg

Paraphrase This Document

Need a fresh take? Get an instant paraphrase of this document with our AI Paraphraser
Document Page
Data science 5
3 4.7 3.2 1.3 0.2 setosa
4 4.6 3.1 1.5 0.2 setosa
5 5.0 3.6 1.4 0.2 setosa
6 5.4 3.9 1.7 0.4 setosa
7 4.6 3.4 1.4 0.3 setosa
8 5.0 3.4 1.5 0.2 setosa
9 4.4 2.9 1.4 0.2 setosa
10 4.9 3.1 1.5 0.1 setosa
versicolor=filter(iris, Species=="versicolor")
versicolor
head(versicolor)
Sepal.Length Sepal.Width Petal.Length Petal.Width Species
1 7.0 3.2 4.7 1.4 versicolor
2 6.4 3.2 4.5 1.5 versicolor
3 6.9 3.1 4.9 1.5 versicolor
4 5.5 2.3 4.0 1.3 versicolor
5 6.5 2.8 4.6 1.5 versicolor
6 5.7 2.8 4.5 1.3 versicolor
7 6.3 3.3 4.7 1.6 versicolor
8 4.9 2.4 3.3 1.0 versicolor
9 6.6 2.9 4.6 1.3 versicolor
10 5.2 2.7 3.9 1.4 versicolor
Document Page
Data science 6
(BÄ…ska, Pondel and Dudycz, 2019)
Q3
The r code to view the last fifteen observations
tail(iris,15)
Sepal.Length Sepal.Width Petal.Length Petal.Width Species
136 7.7 3.0 6.1 2.3 virginica
137 6.3 3.4 5.6 2.4 virginica
138 6.4 3.1 5.5 1.8 virginica
139 6.0 3.0 4.8 1.8 virginica
140 6.9 3.1 5.4 2.1 virginica
141 6.7 3.1 5.6 2.4 virginica
142 6.9 3.1 5.1 2.3 virginica
143 5.8 2.7 5.1 1.9 virginica
144 6.8 3.2 5.9 2.3 virginica
145 6.7 3.3 5.7 2.5 virginica
146 6.7 3.0 5.2 2.3 virginica
147 6.3 2.5 5.0 1.9 virginica
148 6.5 3.0 5.2 2.0 virginica
149 6.2 3.4 5.4 2.3 virginica
150 5.9 3.0 5.1 1.8 virginica
(Caldwell, 2012)
Q4
Document Page
Data science 7
R code to show petal length of setosa, versicolour and virginica.
virginica$Petal.Length
[1] 6.0 5.1 5.9 5.6 5.8 6.6 4.5 6.3 5.8 6.1 5.1 5.3 5.5 5.0 5.1 5.3 5.5 6.7 6.9
[20] 5.0 5.7 4.9 6.7 4.9 5.7 6.0 4.8 4.9 5.6 5.8 6.1 6.4 5.6 5.1 5.6 6.1 5.6 5.5
[39] 4.8 5.4 5.6 5.1 5.1 5.9 5.7 5.2 5.0 5.2 5.4 5.1
setosa$Petal.Length
There are 50 observations for the petal lengths.
versicolor$Petal.Length
There are 50 observations for the petal lengths
To compare the petal length of each flower we can use the summary to draw conclusions.
summary(virginica$Petal.Length)
Min. 1st Qu. Median Mean 3rd Qu. Max.
4.500 5.100 5.550 5.552 5.875 6.900
summary(setosa$Petal.Length)
Min. 1st Qu. Median Mean 3rd Qu. Max.
1.000 1.400 1.500 1.462 1.575 1.900
summary(versicolor$Petal.Length)
Min. 1st Qu. Median Mean 3rd Qu. Max.
tabler-icon-diamond-filled.svg

Paraphrase This Document

Need a fresh take? Get an instant paraphrase of this document with our AI Paraphraser
Document Page
Data science 8
3.00 4.00 4.35 4.26 4.60 5.10
Comparing the minimum and maximum values of each species, setosa has the smallest petal
length(min=1.000 and max=1.9). then versicolor has the smallest minimum and maximum petal length
compared to virginica. Looking at the means setosa has the smallest mean compared to other species.
Hence setosa has the smallest petal size (Grothe, 2012).
Q5
new=mutate(iris, new=Sepal.Width>0.5*Sepal.Length)
new
Sepal.Length Sepal.Width Petal.Length Petal.Width Species new
1 5.1 3.5 1.4 0.2 setosa TRUE
2 4.9 3.0 1.4 0.2 setosa TRUE
3 4.7 3.2 1.3 0.2 setosa TRUE
4 4.6 3.1 1.5 0.2 setosa TRUE
5 5.0 3.6 1.4 0.2 setosa TRUE
6 5.4 3.9 1.7 0.4 setosa TRUE
7 4.6 3.4 1.4 0.3 setosa TRUE
(Kabacoff, 2011)
Document Page
Data science 9
Q6
summary(iris)
Sepal.Length Sepal.Width Petal.Length Petal.Width
Min. :4.300 Min. :2.000 Min. :1.000 Min. :0.100
1st Qu.:5.100 1st Qu.:2.800 1st Qu.:1.600 1st Qu.:0.300
Median :5.800 Median :3.000 Median :4.350 Median :1.300
Mean :5.843 Mean :3.057 Mean :3.758 Mean :1.199
3rd Qu.:6.400 3rd Qu.:3.300 3rd Qu.:5.100 3rd Qu.:1.800
Max. :7.900 Max. :4.400 Max. :6.900 Max. :2.500
Species
setosa :50
versicolor:50
virginica :50
The median for each measurement is different.
The summary shows the lowest and highest values, the first and the third quartile.
There is a slight
difference between
means and
medians.
Boxplot(iris)
Document Page
Data science 10
Maximum value excluding outliers
Upper quartile, 25% of observations are above
Median, 50% of observations are lower and upper
Lower quartile 25% of observations are below
The outliers, value that are outside the interquartile
(Kabir et al., 2018)
Q7
boxplot(versicolor[,1:4], main="Versicolor")
boxplot(setosa[,1:4], main="Setosa")
boxplot(virginica[,1:4], main="Virginica")
tabler-icon-diamond-filled.svg

Paraphrase This Document

Need a fresh take? Get an instant paraphrase of this document with our AI Paraphraser
Document Page
Data science 11
The box plot shows that setosa have low petal lengths when compared with other species. It
also has large sepal widths compared to other species (Chan and Kogan, 2016). Versicolor
and virginica have similar measurements. Versicolor has smaller petal length and petal width
compared with virginica. Hence, it is concluded that the flower species have a unique
measurement (Rojas, 2015).
Q8
attach(iris)
hist(Petal.Length)
Document Page
Data science 12
Q9
ggplot(iris, aes(x=Sepal.Width, y=Sepal.Length)) + geom_point()
There is a no correlation between sepal length and sepal width, change values of sepal width
does not affect sepal length (Tomat et al., 2019).
chevron_up_icon
1 out of 18
circle_padding
hide_on_mobile
zoom_out_icon
[object Object]