Data Science Project: Credit Application Analysis, Regression Models

Verified

Added on  2023/06/04

|9
|994
|298
Project
AI Summary
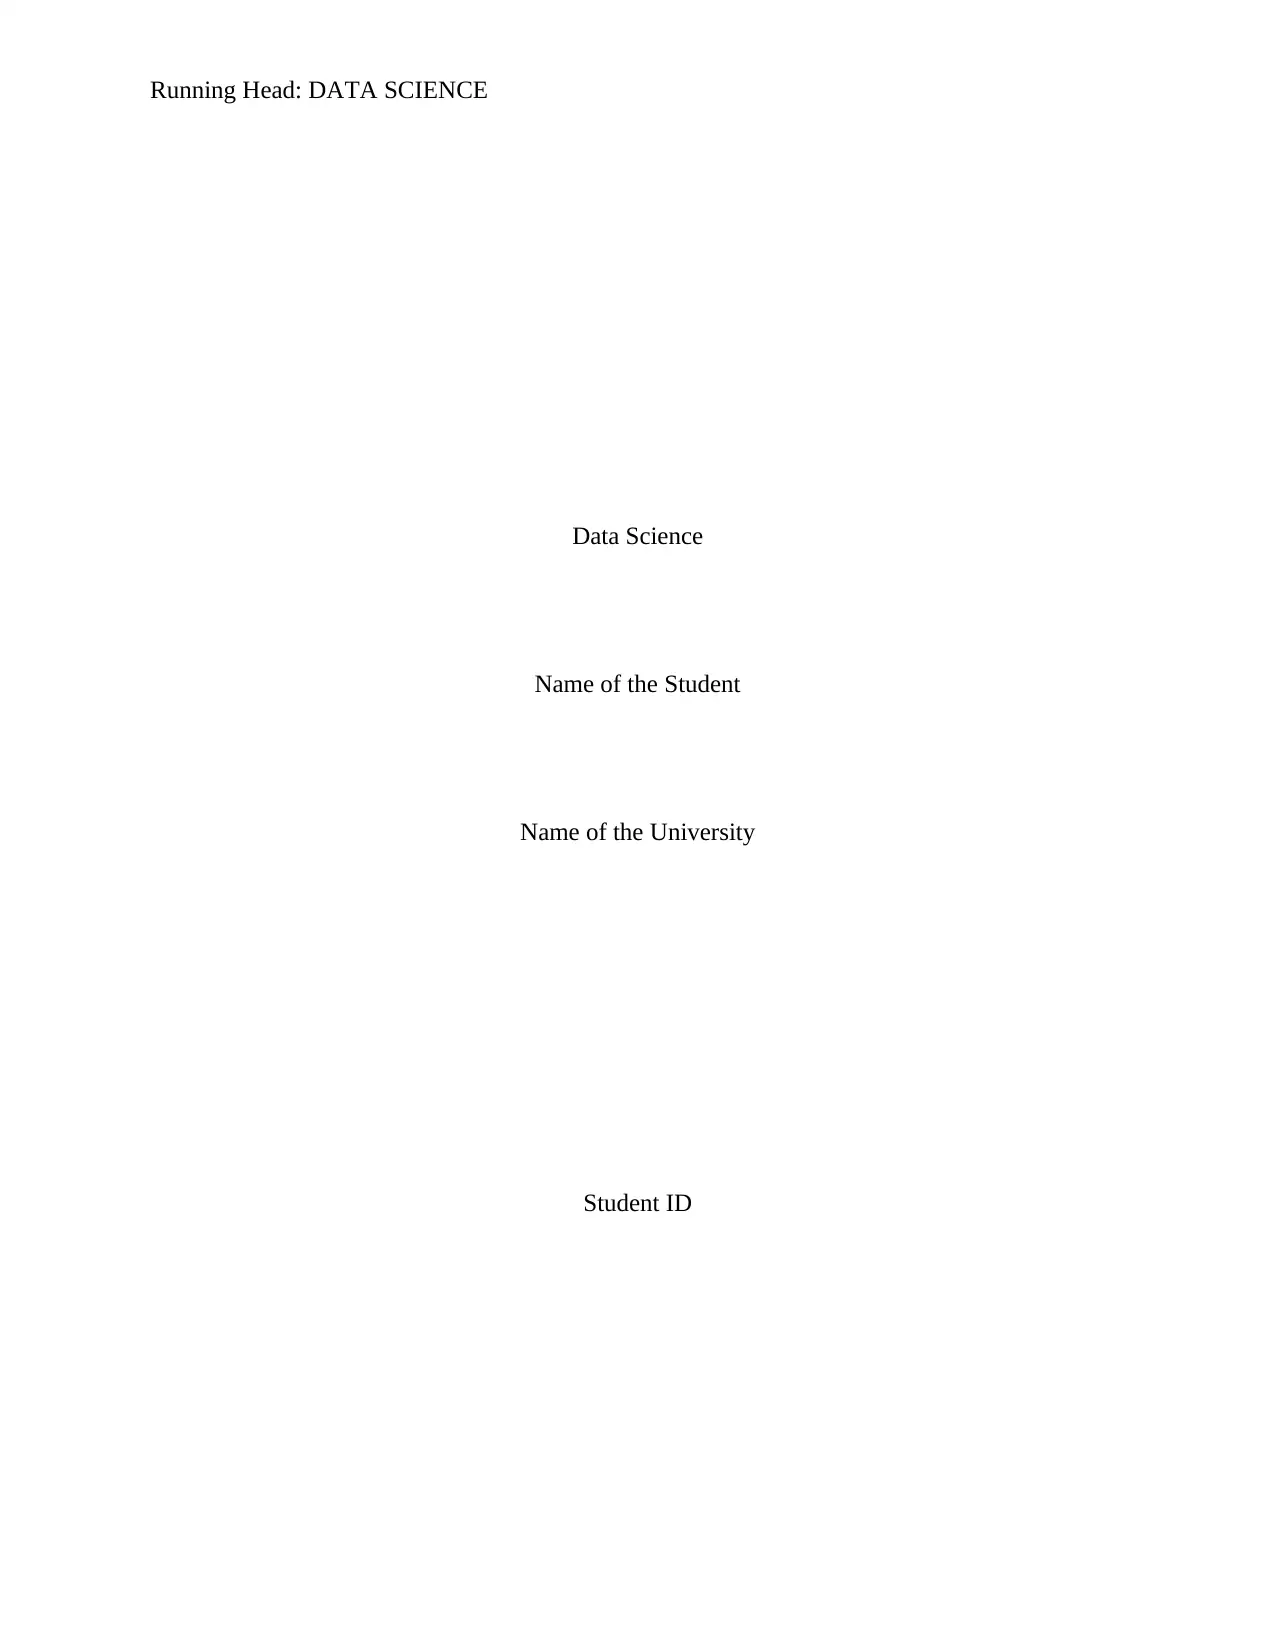
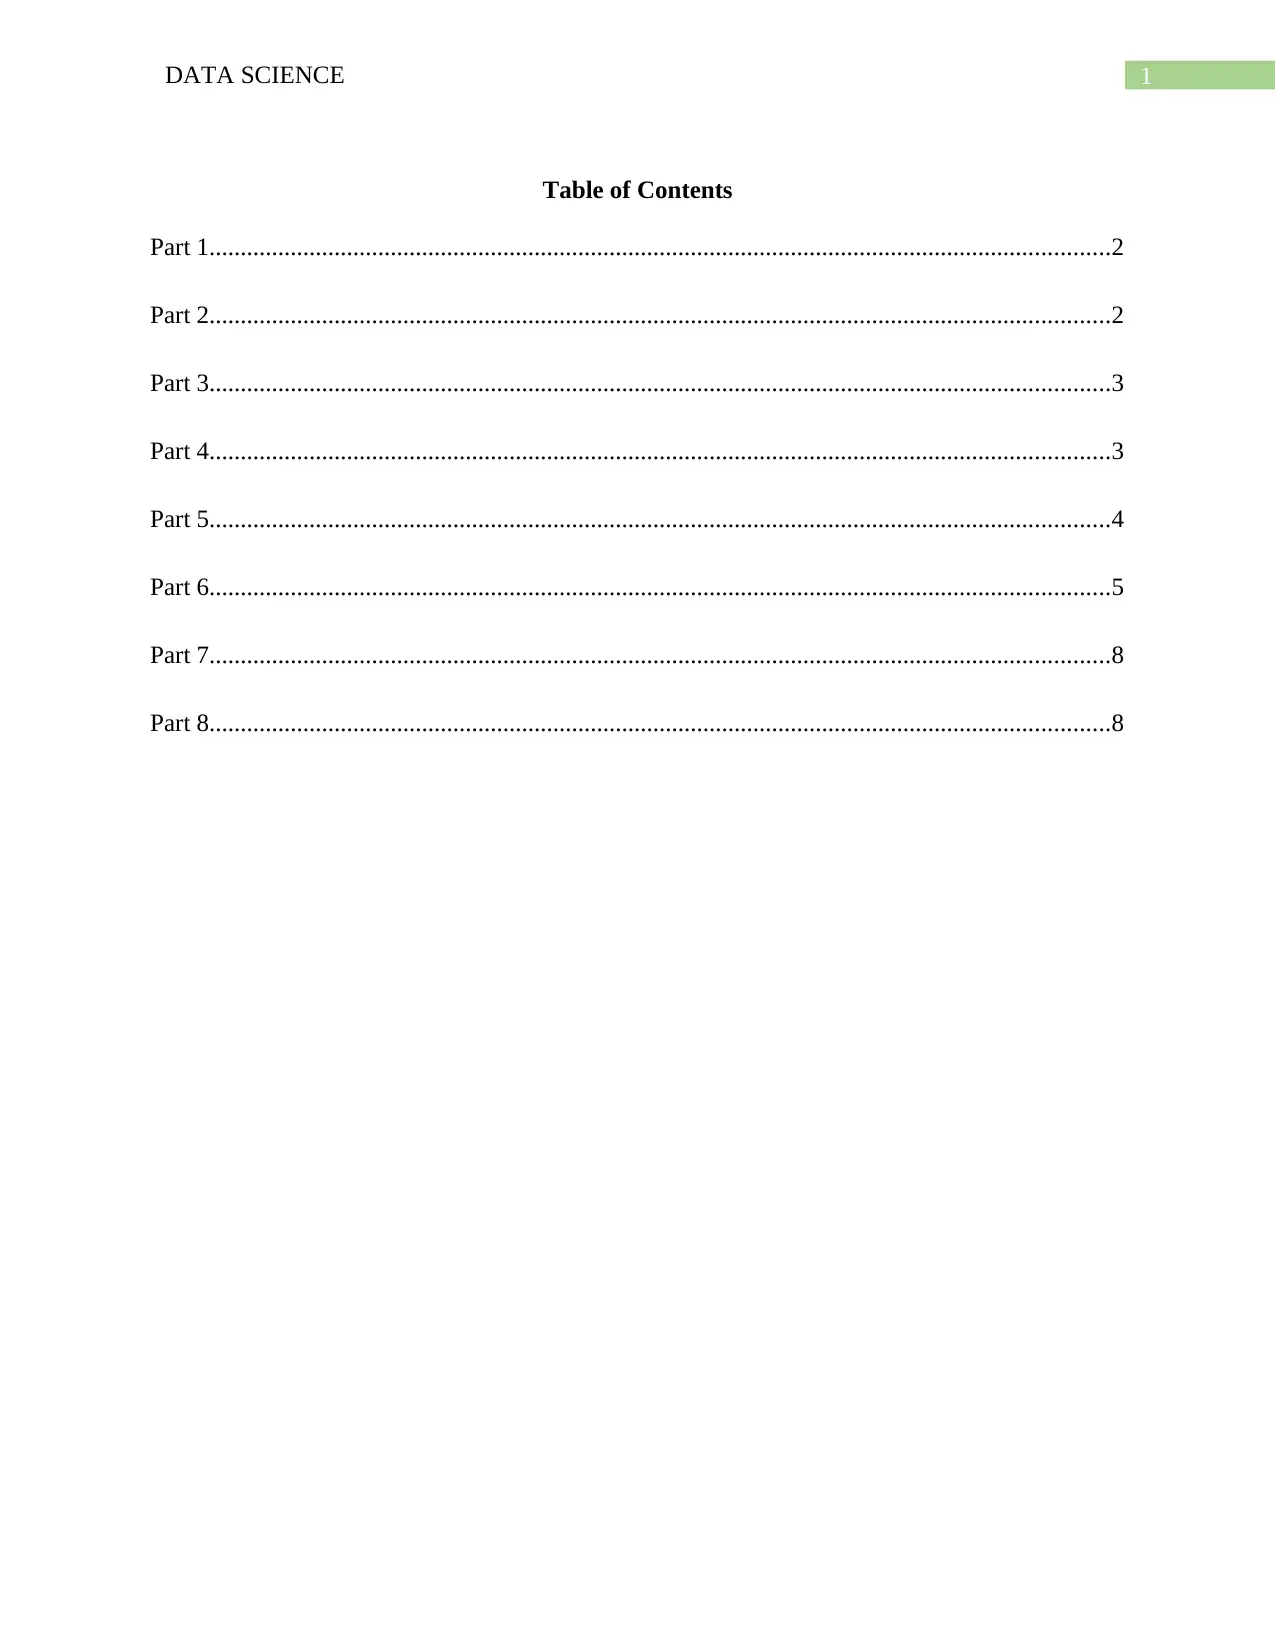
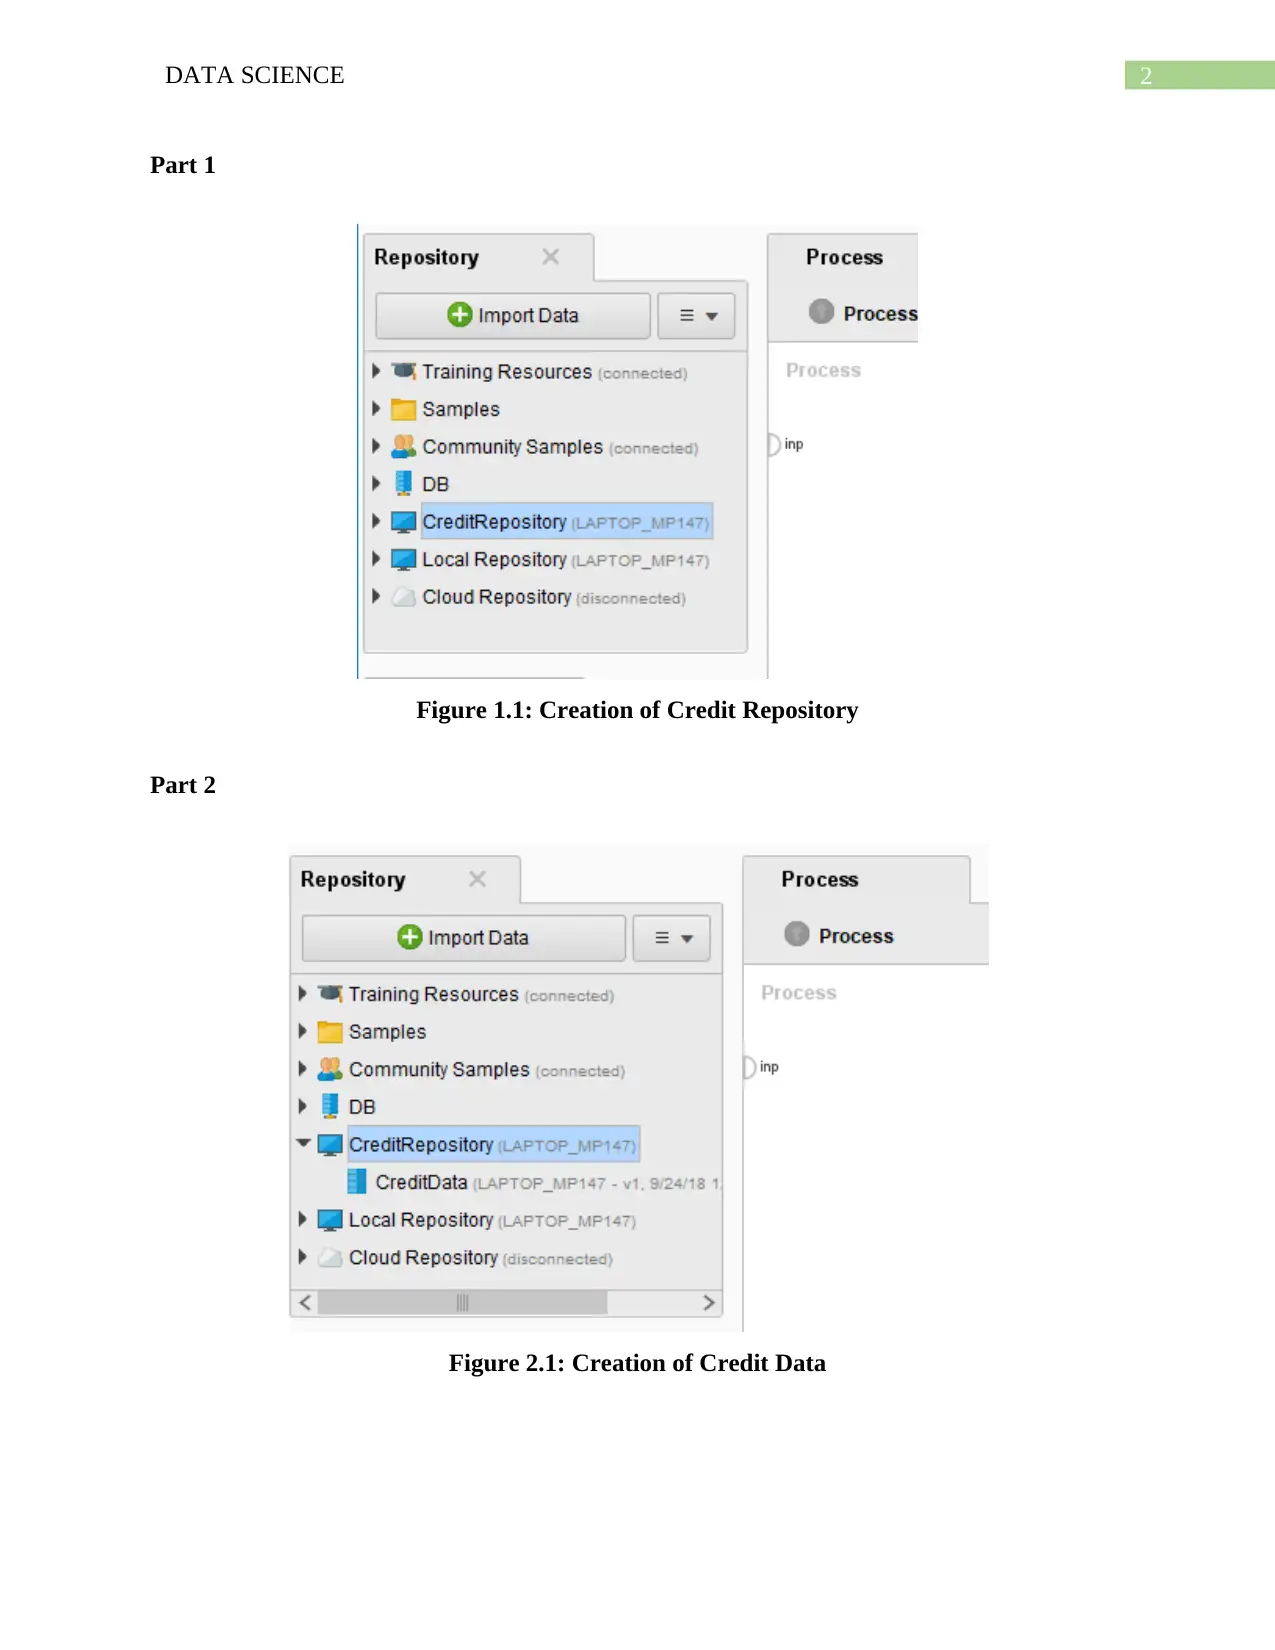
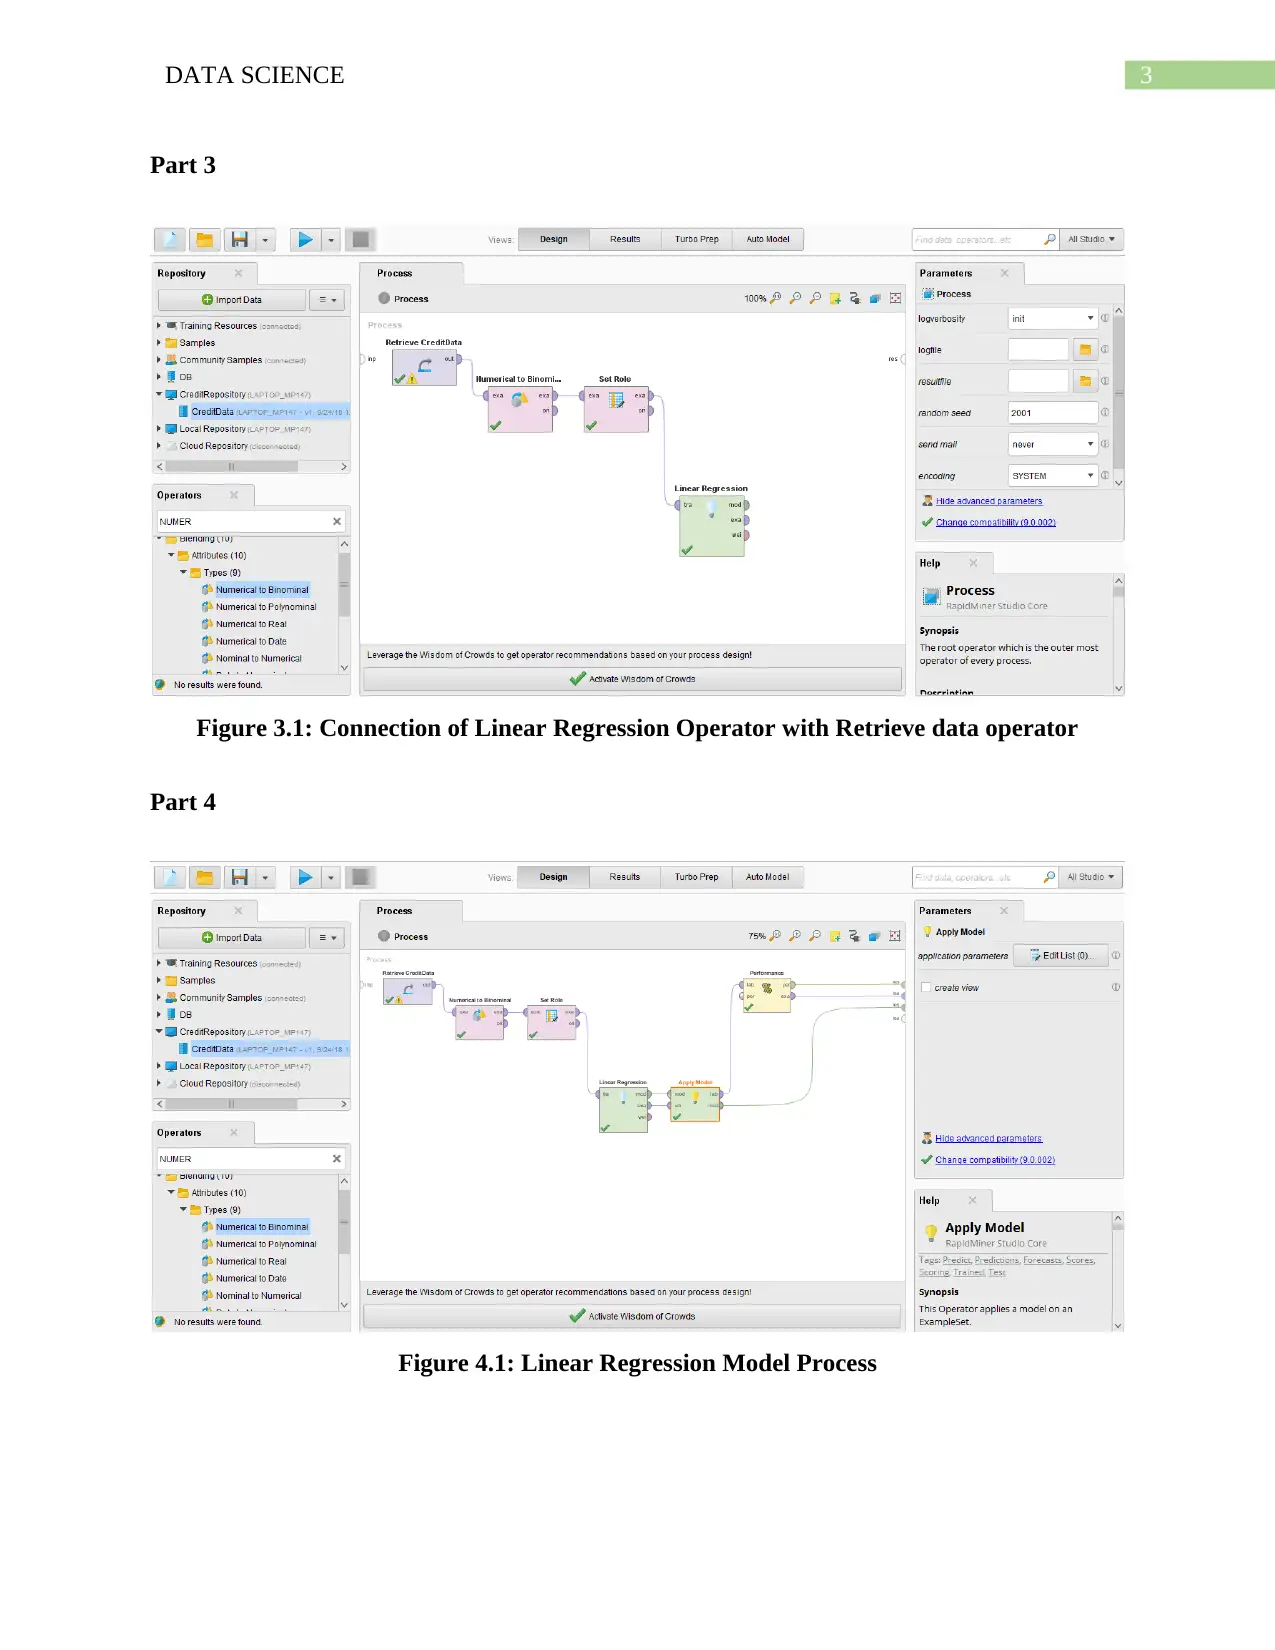
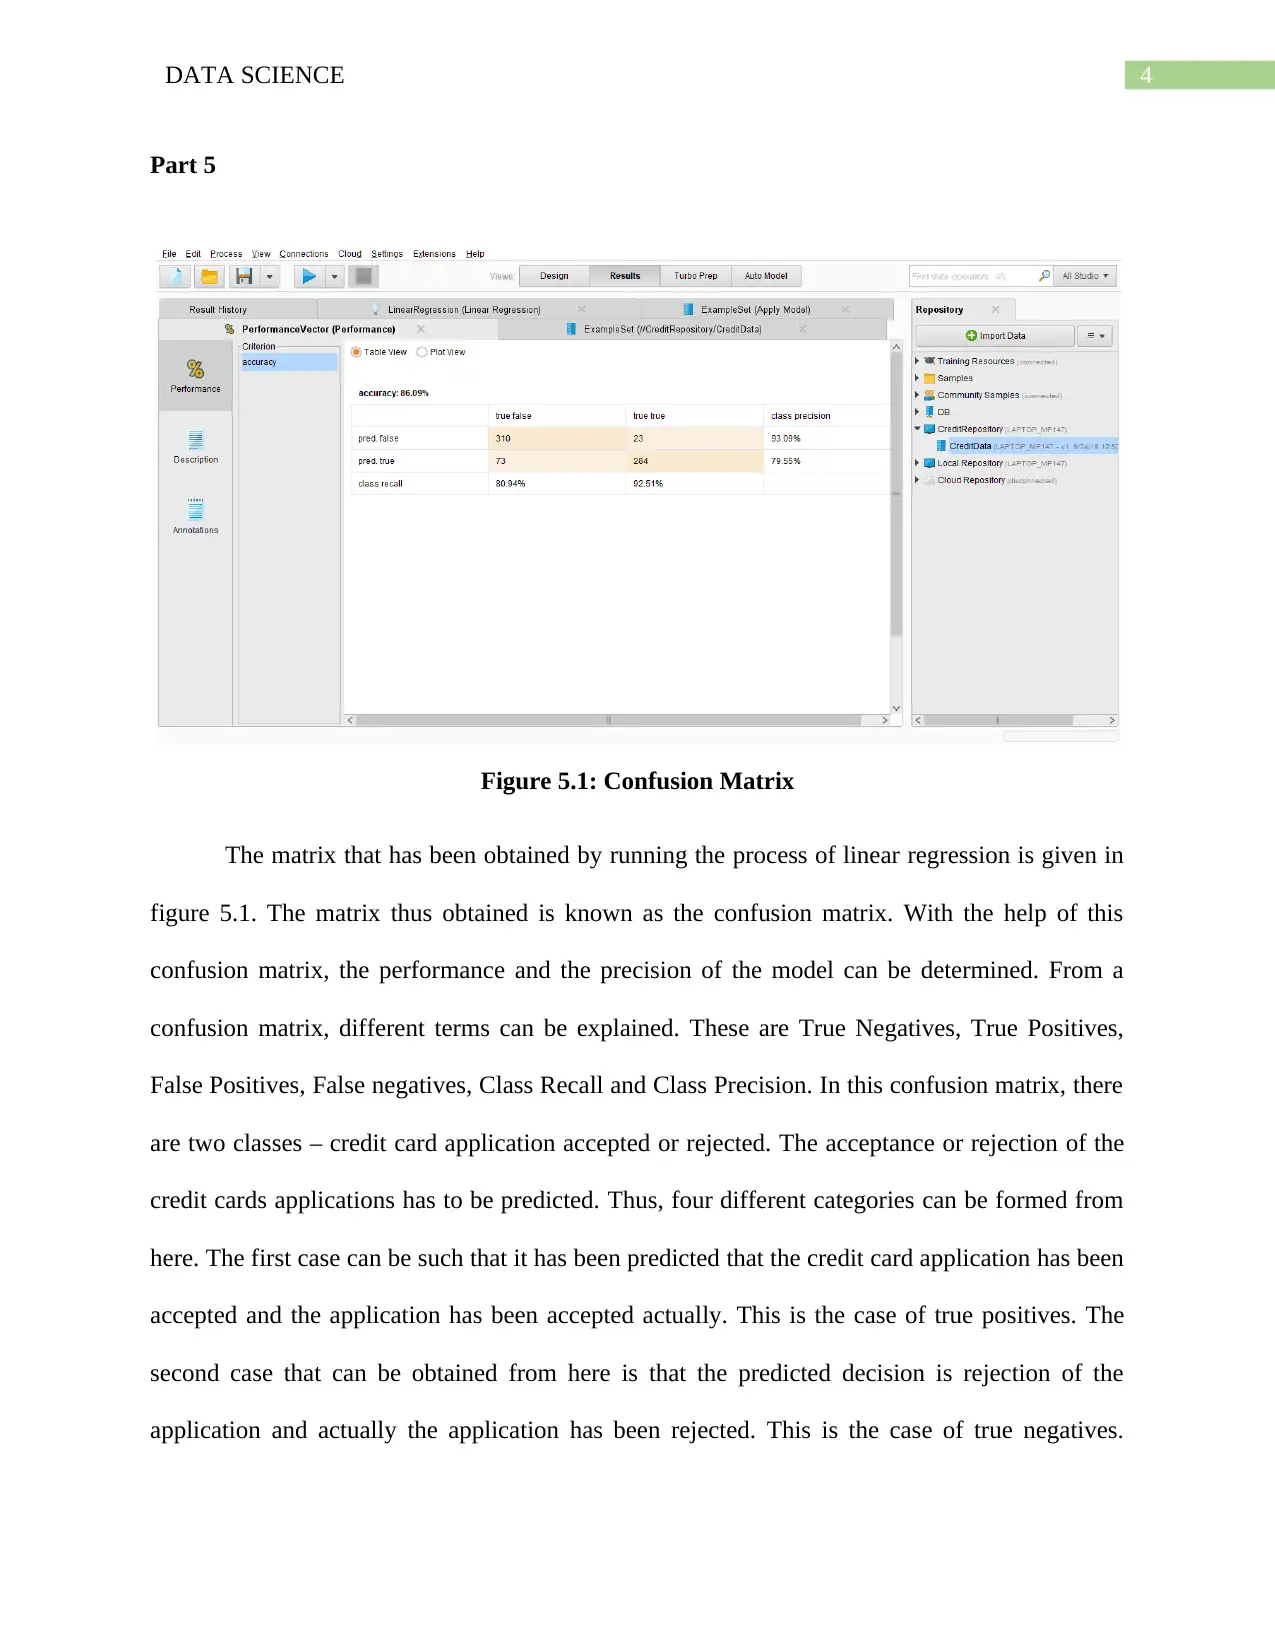
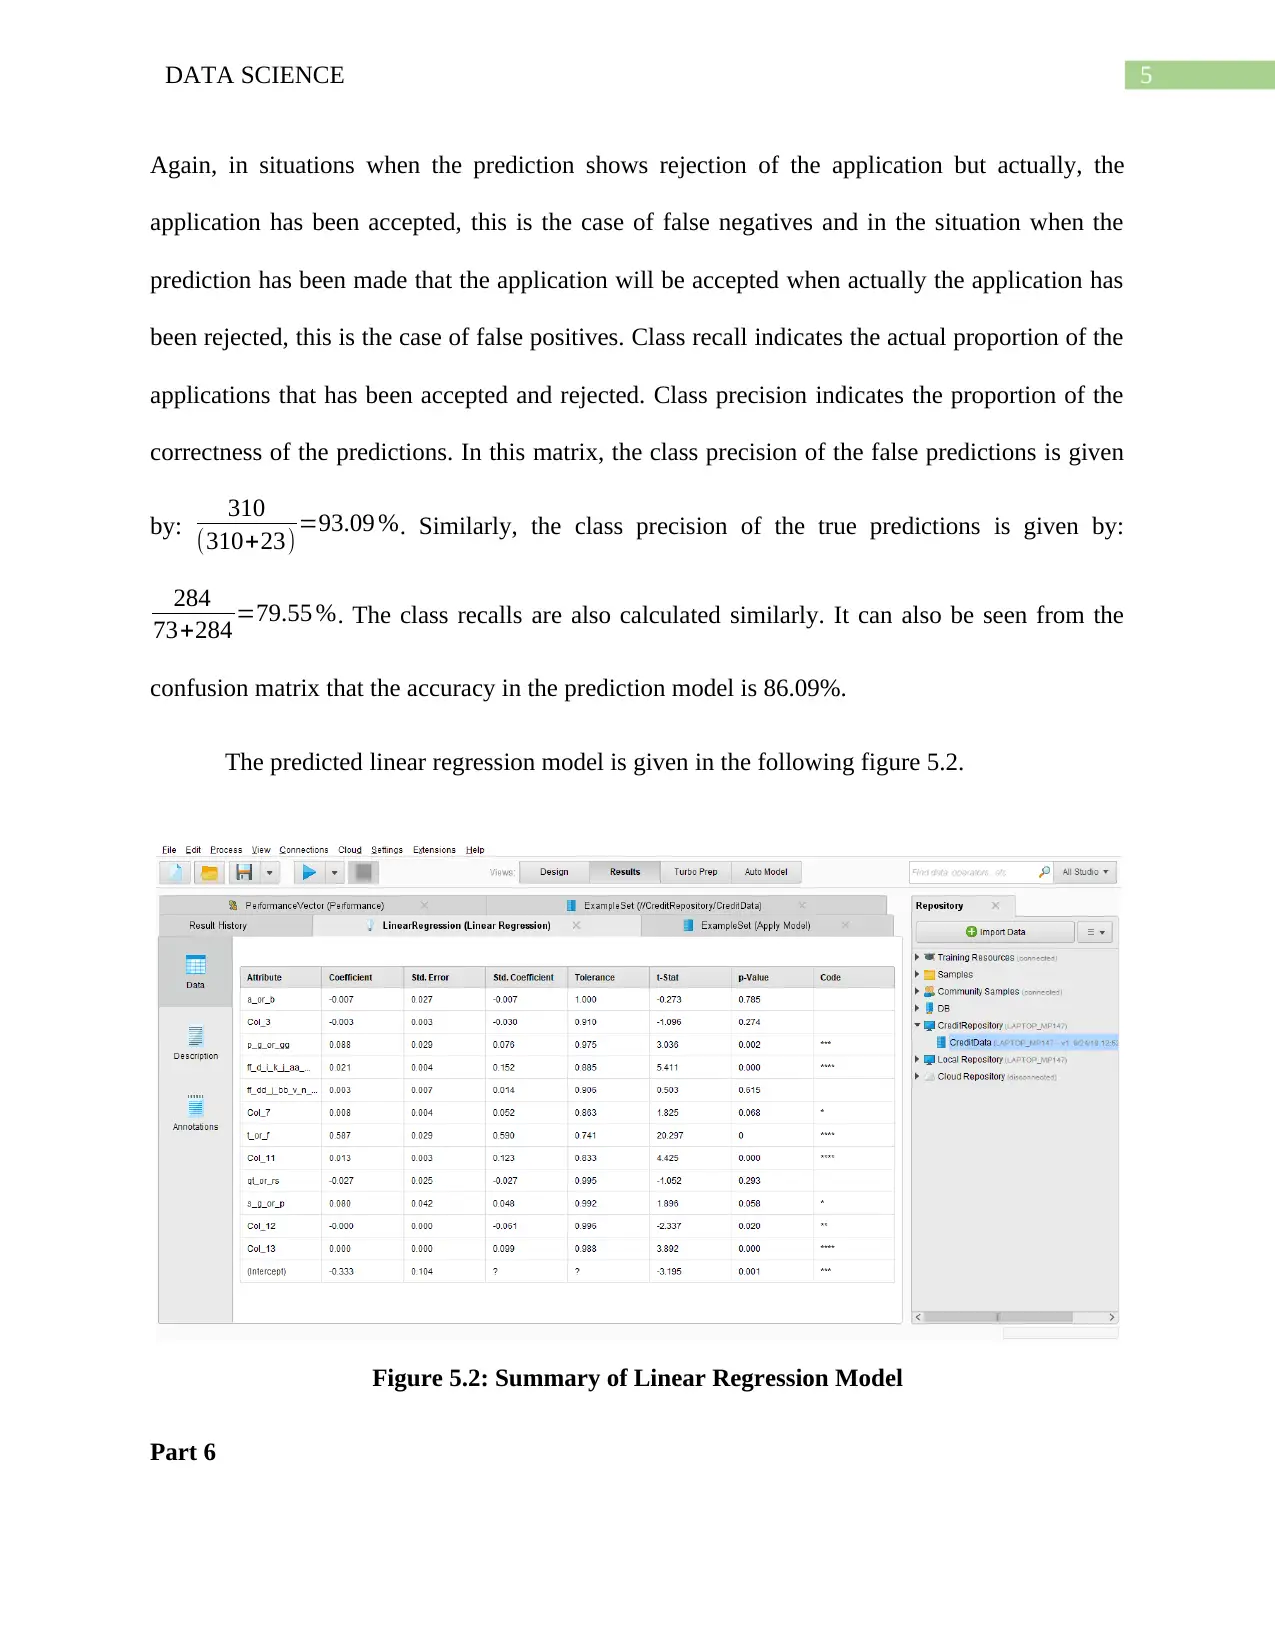
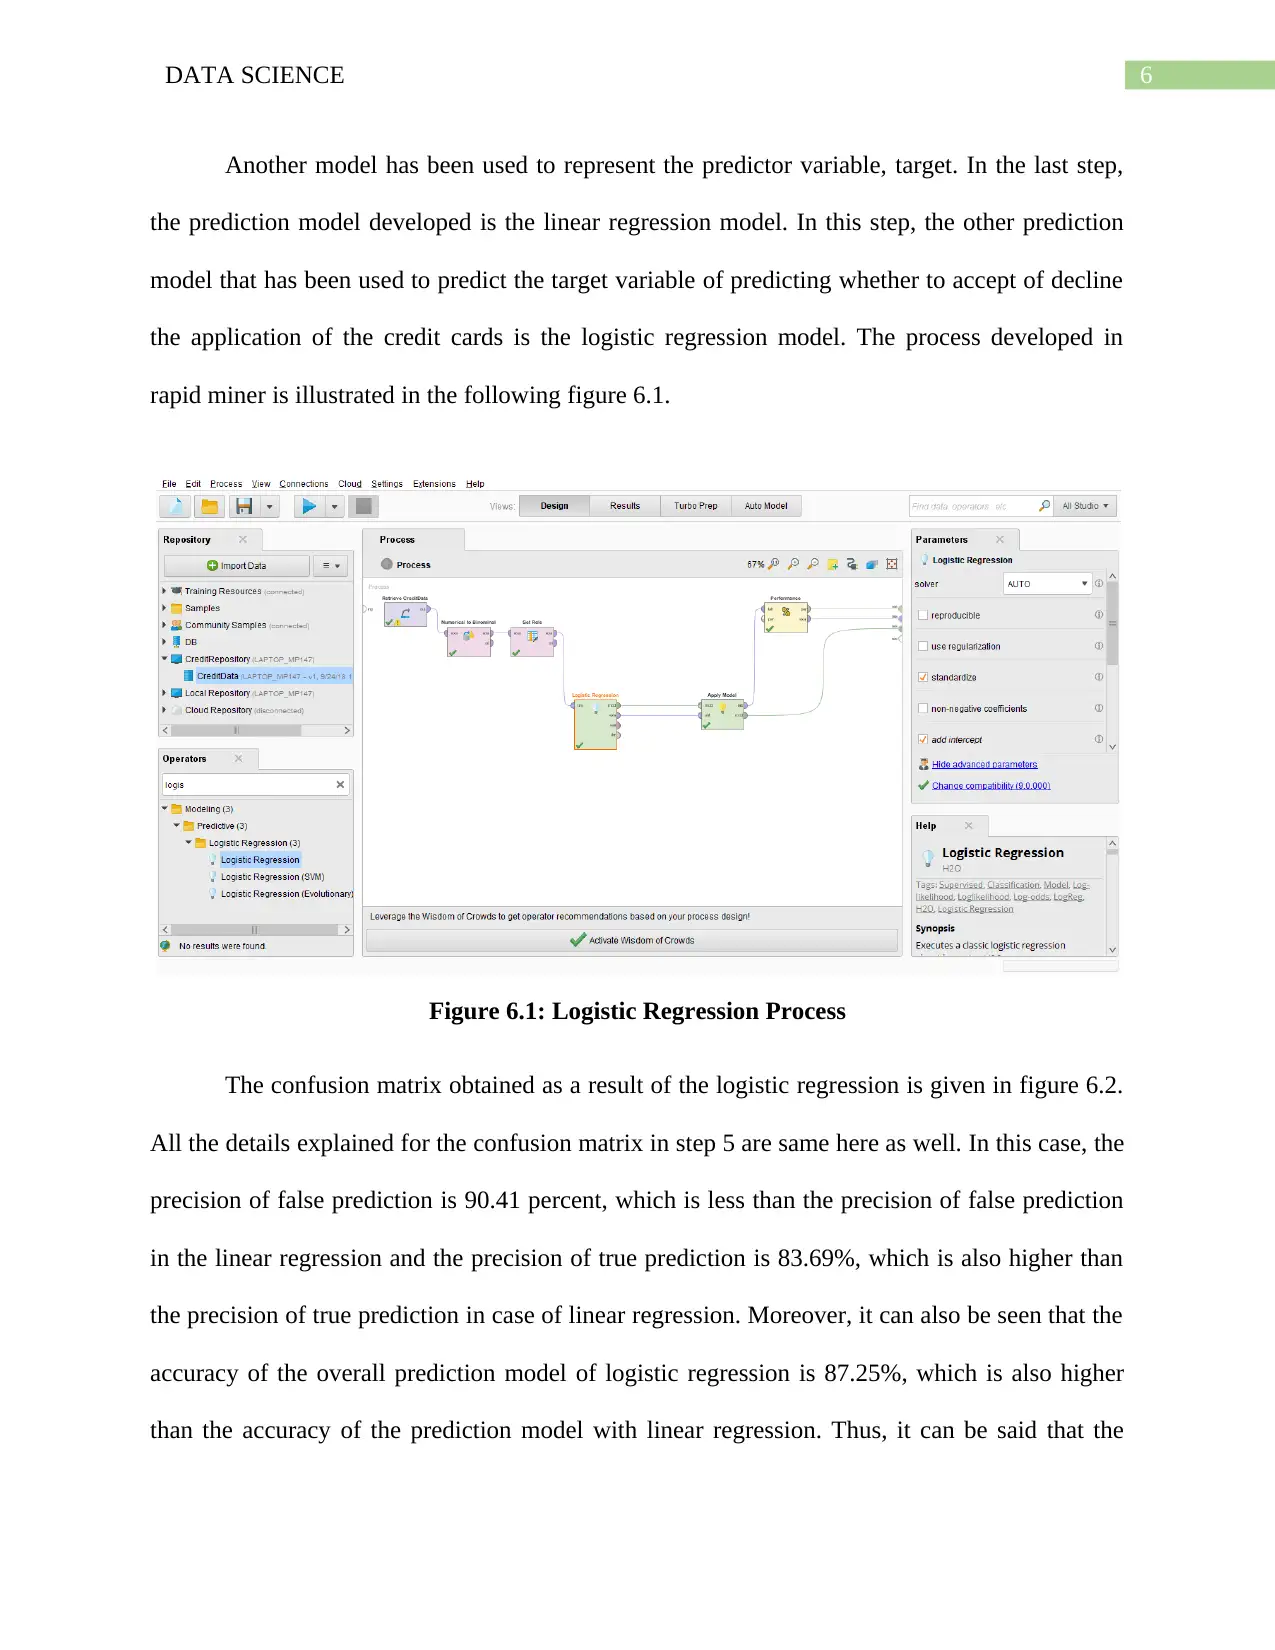
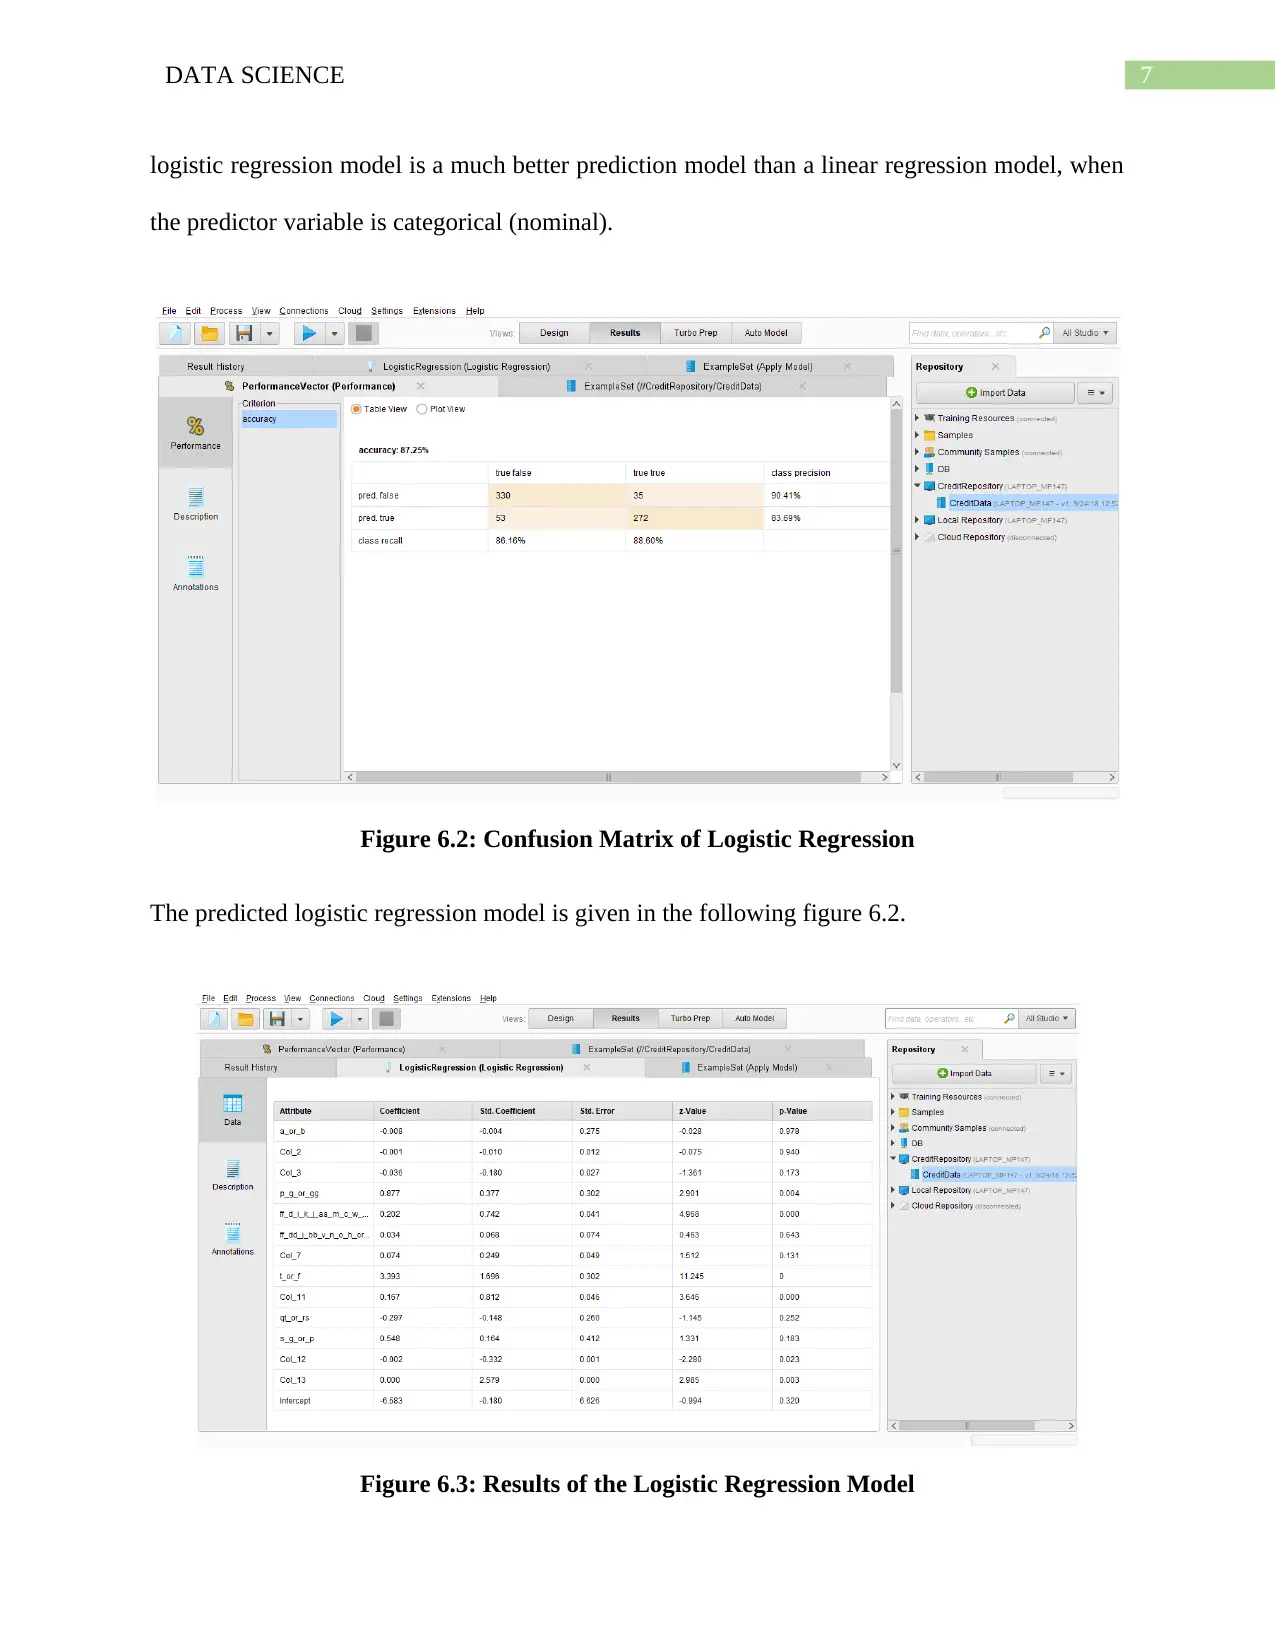
This data science project examines credit application analysis using RapidMiner. The project begins with the creation of a credit repository and dataset, followed by the implementation of linear regression to predict credit application acceptance or rejection. The project includes a detailed analysis of the confusion matrix to evaluate model performance, including calculations of class precision, recall, and overall accuracy. Subsequently, the project transitions to logistic regression, comparing its performance against linear regression, and highlighting its advantages when dealing with categorical predictor variables. The project also addresses the handling of missing data through imputation techniques and concludes with a discussion on data preprocessing steps, such as setting variable roles and transforming data formats, to improve model accuracy.
Document Page
Running Head: DATA SCIENCE
Data Science
Name of the Student
Name of the University
Student ID
tabler-icon-diamond-filled.svg

Paraphrase This Document

Need a fresh take? Get an instant paraphrase of this document with our AI Paraphraser
Document Page
1DATA SCIENCE
Table of Contents
Part 1................................................................................................................................................2
Part 2................................................................................................................................................2
Part 3................................................................................................................................................3
Part 4................................................................................................................................................3
Part 5................................................................................................................................................4
Part 6................................................................................................................................................5
Part 7................................................................................................................................................8
Part 8................................................................................................................................................8
Document Page
2DATA SCIENCE
Part 1
Figure 1.1: Creation of Credit Repository
Part 2
Figure 2.1: Creation of Credit Data
Document Page
3DATA SCIENCE
Part 3
Figure 3.1: Connection of Linear Regression Operator with Retrieve data operator
Part 4
Figure 4.1: Linear Regression Model Process
tabler-icon-diamond-filled.svg

Paraphrase This Document

Need a fresh take? Get an instant paraphrase of this document with our AI Paraphraser
Document Page
4DATA SCIENCE
Part 5
Figure 5.1: Confusion Matrix
The matrix that has been obtained by running the process of linear regression is given in
figure 5.1. The matrix thus obtained is known as the confusion matrix. With the help of this
confusion matrix, the performance and the precision of the model can be determined. From a
confusion matrix, different terms can be explained. These are True Negatives, True Positives,
False Positives, False negatives, Class Recall and Class Precision. In this confusion matrix, there
are two classes – credit card application accepted or rejected. The acceptance or rejection of the
credit cards applications has to be predicted. Thus, four different categories can be formed from
here. The first case can be such that it has been predicted that the credit card application has been
accepted and the application has been accepted actually. This is the case of true positives. The
second case that can be obtained from here is that the predicted decision is rejection of the
application and actually the application has been rejected. This is the case of true negatives.
Document Page
5DATA SCIENCE
Again, in situations when the prediction shows rejection of the application but actually, the
application has been accepted, this is the case of false negatives and in the situation when the
prediction has been made that the application will be accepted when actually the application has
been rejected, this is the case of false positives. Class recall indicates the actual proportion of the
applications that has been accepted and rejected. Class precision indicates the proportion of the
correctness of the predictions. In this matrix, the class precision of the false predictions is given
by: 310
(310+23) =93.09 %. Similarly, the class precision of the true predictions is given by:
284
73+284 =79.55 %. The class recalls are also calculated similarly. It can also be seen from the
confusion matrix that the accuracy in the prediction model is 86.09%.
The predicted linear regression model is given in the following figure 5.2.
Figure 5.2: Summary of Linear Regression Model
Part 6
Document Page
6DATA SCIENCE
Another model has been used to represent the predictor variable, target. In the last step,
the prediction model developed is the linear regression model. In this step, the other prediction
model that has been used to predict the target variable of predicting whether to accept of decline
the application of the credit cards is the logistic regression model. The process developed in
rapid miner is illustrated in the following figure 6.1.
Figure 6.1: Logistic Regression Process
The confusion matrix obtained as a result of the logistic regression is given in figure 6.2.
All the details explained for the confusion matrix in step 5 are same here as well. In this case, the
precision of false prediction is 90.41 percent, which is less than the precision of false prediction
in the linear regression and the precision of true prediction is 83.69%, which is also higher than
the precision of true prediction in case of linear regression. Moreover, it can also be seen that the
accuracy of the overall prediction model of logistic regression is 87.25%, which is also higher
than the accuracy of the prediction model with linear regression. Thus, it can be said that the
tabler-icon-diamond-filled.svg

Paraphrase This Document

Need a fresh take? Get an instant paraphrase of this document with our AI Paraphraser
Document Page
7DATA SCIENCE
logistic regression model is a much better prediction model than a linear regression model, when
the predictor variable is categorical (nominal).
Figure 6.2: Confusion Matrix of Logistic Regression
The predicted logistic regression model is given in the following figure 6.2.
Figure 6.3: Results of the Logistic Regression Model
Document Page
8DATA SCIENCE
Part 7
A hypothetical situation is imagined, in which a lot of entries in the variables A1, A2 and
A5 are missing. Elimination of all the missing data result in a sample size, which is so small that
it is not fit for the purpose of the research. In that case, the missing values are handled with the
help of imputation of missing values. With the help of multiple imputation feature, which is
available in Rapid Miner, the missing values can be imputed and the analysis can be conducted
with the help of the imputed missing values.
Part 8
Preprocessing of data can be conducted in RapidMiner. With the help of this pre-
processing, the data can be improved so that the model built can be more accurate. Among these
preprocessing steps, the role of the variables is set, that the variable that has to be predicted can
be specified. The values in the variable can be transformed into any other form as necessary. For
example, if a variable is given in a categorical form, it can be transformed into a numerical
variable. The missing values that are present in the data can also be imputed. All these pre-
processing are necessary for the analysis of the variables.
chevron_up_icon
1 out of 9
circle_padding
hide_on_mobile
zoom_out_icon
[object Object]