Principles of Data Science for Business: FluffyGroCo Report Analysis
VerifiedAdded on 2022/09/17
|17
|4215
|22
Report
AI Summary
This report presents an analysis of FluffyGroCo's insect infestation problem using data science techniques. The report begins with an overview of the briefing note, highlighting the challenges posed by the Crackety Crickling insect and its impact on Truffula tree plantations. It then details the data science initiative undertaken to predict and mitigate the insect invasion, including the use of Exploratory Data Analysis (EDA) and Confirmatory Data Analysis (CDA). The analysis section focuses on the use of box plots to visualize data related to infestation, rainfall, and temperature, and the report discusses the ethical and security considerations associated with big data analytics, including unfair discrimination, reinforcement of human biases, and lack of transparency. The report concludes with a discussion of the technical benefits and challenges of data science, the statistical methodologies employed, and recommendations for future steps.
Running head: PRINCIPLES OF DATA SCIENCE
Principles of Data Science
Principles of Data Science
Paraphrase This Document
Need a fresh take? Get an instant paraphrase of this document with our AI Paraphraser
PRINCIPLES OF DATA SCIENCE
Table of Contents
Assessment of FluffyGroCo’s Briefing Note.............................................................................3
Overview of Investigation..........................................................................................................4
Analysis and Results..................................................................................................................6
Ethical and Security Considerations........................................................................................11
Unfair Discrimination..........................................................................................................11
Reinforcement of Human Biases.........................................................................................11
Lack of Transparency...........................................................................................................12
Data Science in Next Steps and Potential Solution..................................................................12
Technical benefits of Data Science......................................................................................13
Challenges of Data Science..................................................................................................14
Statistics and Methodology..................................................................................................14
References................................................................................................................................17
Page 2
PRINCIPLES OF DATA SCIENCE
Assessment of FluffyGroCo’s Briefing Note
Truffula trees have the ability to bring clean air back to the Thneedville thereby providing a
renewed correlation and coming to an agreement with nature. In this regard, it can be said
that it encouraged the rise of many new Green economy businesses. This is considered as the
most successful factor of the FluffyGroCo. In the study, the challenges of the Crackety insect
influx have been addressed carefully. Crackety Cricklings generally creates a major hazard to
the Truffula tree plantations. Crackety Crickling larvae can grow at a rapid pace but at times
when the insect matures, they are unable to generate completely-developed skin. As a result
of which intense itching is caused, this has adversely affected the textile production. This is
because itching sensation is caused due to which the Crackety Cricklings rub themselves in
the Truffula leaves thereby making it hard until they are unusable in nature. Besides,
FluffyGroCo emphasizes the organic measures concerning natural balance. Hence, it can
surely provide a possible solution and that is treating alongside saving the Truffula forests by
means of bacteria, which eat the larvae. Thus, it can be said that in the study, environmental
factors have a greater influence. FluffyGroCo has assigned a group of biologists, chemists,
and geologists with the duty of understanding the environmental conditions in which stunting
of the larvae takes place. In this manner, proper inspection and varied kind of tests can be
undertaken on Rondadoo’s plantation. In this case, it was ultimately affirmed that the
prediction of stunting risks could be accurately done thereby incorporating the approach of
deterministic rules, which is elucidated below:
‘IF (rainy AND temperature >= 15) OR (NOT rainy AND temperature >= 22):’- then there is
High risk of stunting as well as infestation
Apart from the above condition, the risk of infestation and stunting can be considered low.
Besides, FluffyGroCo is also found to invest in digitisation in its process. Hence, with the
Page 3
⊘ This is a preview!⊘
Do you want full access?
Subscribe today to unlock all pages.
Trusted by 1+ million students worldwide
PRINCIPLES OF DATA SCIENCE
help of this, it has been able to gather detailed data regarding the environmental conditions in
its plantations areas including Uptagoo Rondadoo, and Nextafoo along with specific dates. In
relation to the study, data science has been found to be helpful in predicting the insect
invasion, climate changes, and the alterations of plants’ temperature. From the obtained
dataset-specific date, field, infestation, rain status and temperature can be determined.
Understanding all these aspects, the fields wherein the proposal should be initiated are
Nextafoo, Rondadoo, and Uptagoo. In case if the data, regarding the rainy weather and the
temperature, lying between 0 to 22, then it could be interpreted that in all the three fields
there is a high risk of infestation along with stunting. On the other hand, if the rainy weather
and the temperature do not lie between the above-mentioned ranges then there will be low
risk.
The principle of data science mainly consisted of a hierarchy of needs and building of the
model for the right questions among others. This principle can be useful for determining the
research study problem. Hence, the main aim of the study is to gather information and prove
the hypothesis so that insect invasion can be prevented thereby measuring the obtained data
from the data science initiative. It also emphasizes the development of appropriate steps to
implement and manage the treatment strategy so that insect infestation can be prevented. The
research problem can further be addressed by following a specific outline, which comprises
of data collection, analysis, and problem-solving.
Overview of Investigation
In relation to the study, Exploratory Data Analysis (EDA) and Confirmatory Data Analysis
(CDA) will be used for the aforementioned investigation. EDA relies on a number of
techniques for addressing the point “What’s next?”. This EDA technique consists of various
steps. These involve initiating the data structure, identifying the technique errors, and
Page 4
Paraphrase This Document
Need a fresh take? Get an instant paraphrase of this document with our AI Paraphraser
PRINCIPLES OF DATA SCIENCE
evaluating the missing data and anomalies. EDA is generally used to discover specific
patterns in the data. Furthermore, it emphasizes the pattern appreciation and hypothesis,
which is generated from the raw data. EDA technique has been successfully used in cases
including data visualization and data mining. Hence, in the present study, the technical
processes of the model construction and testing requires gathering detailed understanding
from the data at all the stages of the research. In this study, regression analysis will also be
done. While conducting this analysis, a researcher at the end must prove a particular
hypothesis made based on the study. In the above context, researchers must be worried about
a wider range of questions about the data while comparing it with the statistical consequences
of the partial slopes. In addition to this, EDA is going to be used for data analysis as CDA
sometimes fail to address the requirement of the initial stage of data analysis. The focus of
EDA is not just to draw conclusions regarding fault and innocence but it enables proper
investigation of the problem thereby producing the hunches, and providing preliminary
evidence for the betterment of the study. The present study deals with the management of the
Crackety Crickling insect infestations. In such a case, EDA acts as a process of interrogation
for proving the hypotheses and formulating the model.
In the study, the dataset contains a large number of samples, thus the exploratory data analyst
will conduct EDA to generate the hypothesis. This EDA approach consists of the Pareto
chart, scatter plot, histogram, run chart, box plot, stem-and-leaf plot, multivariate chart, and
parallel coordinates. On the other hand, in the case of the CDA, the researcher can consider
the initial evaluation of the logical models that have been used in the probabilistic approaches
such as confidence interval or consequence tests. Furthermore, EDA will explore the data
patterns, which are associated with the study. This, in turn, can enable a researcher to draw
specific inferences regarding the study thereby addressing the research problem. In addition,
Page 5
PRINCIPLES OF DATA SCIENCE
EDA decreases the number of the variables, which helps the researcher to understand the
field of the data thereby allowing proper interpretation of the obtained results.
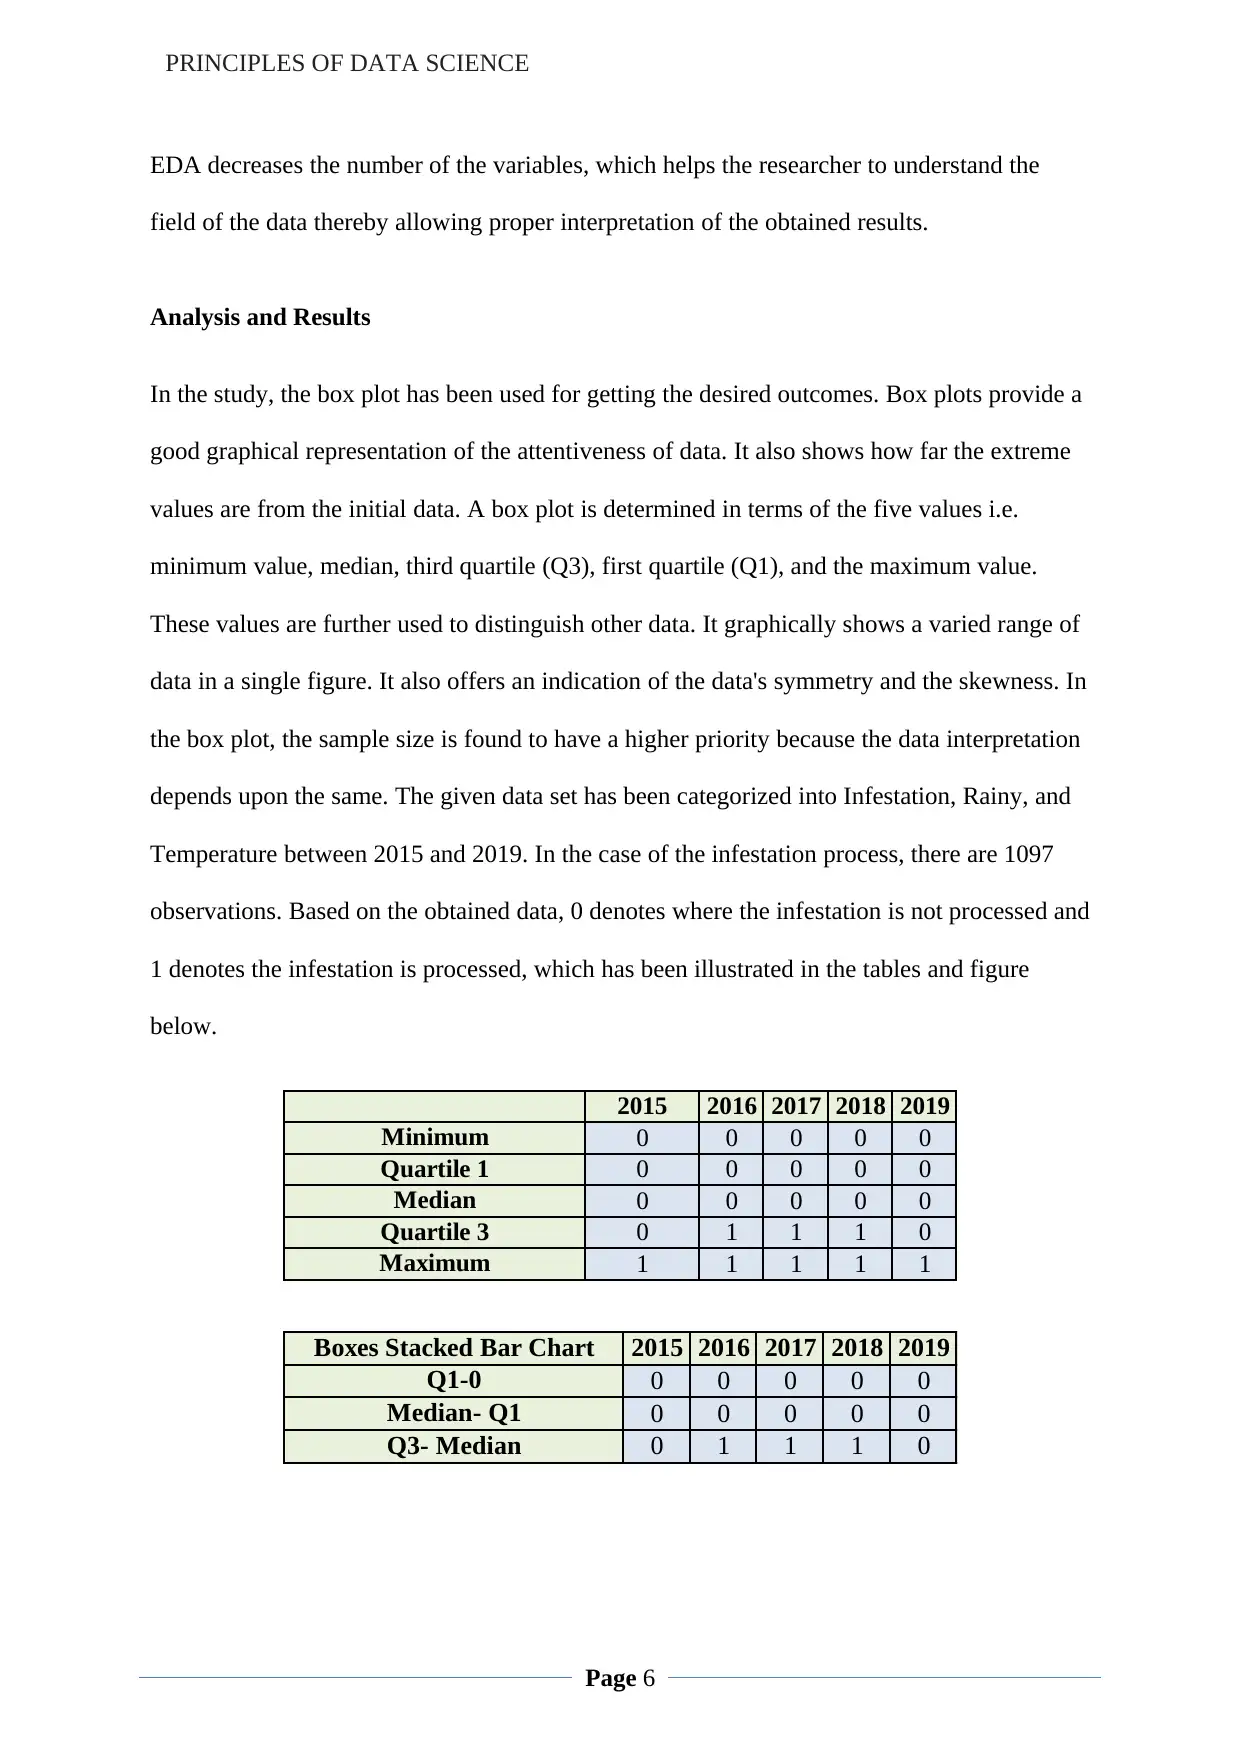
Analysis and Results
In the study, the box plot has been used for getting the desired outcomes. Box plots provide a
good graphical representation of the attentiveness of data. It also shows how far the extreme
values are from the initial data. A box plot is determined in terms of the five values i.e.
minimum value, median, third quartile (Q3), first quartile (Q1), and the maximum value.
These values are further used to distinguish other data. It graphically shows a varied range of
data in a single figure. It also offers an indication of the data's symmetry and the skewness. In
the box plot, the sample size is found to have a higher priority because the data interpretation
depends upon the same. The given data set has been categorized into Infestation, Rainy, and
Temperature between 2015 and 2019. In the case of the infestation process, there are 1097
observations. Based on the obtained data, 0 denotes where the infestation is not processed and
1 denotes the infestation is processed, which has been illustrated in the tables and figure
below.
2015 2016 2017 2018 2019
Minimum 0 0 0 0 0
Quartile 1 0 0 0 0 0
Median 0 0 0 0 0
Quartile 3 0 1 1 1 0
Maximum 1 1 1 1 1
Boxes Stacked Bar Chart 2015 2016 2017 2018 2019
Q1-0 0 0 0 0 0
Median- Q1 0 0 0 0 0
Q3- Median 0 1 1 1 0
Page 6
EDA decreases the number of the variables, which helps the researcher to understand the
field of the data thereby allowing proper interpretation of the obtained results.
Analysis and Results
In the study, the box plot has been used for getting the desired outcomes. Box plots provide a
good graphical representation of the attentiveness of data. It also shows how far the extreme
values are from the initial data. A box plot is determined in terms of the five values i.e.
minimum value, median, third quartile (Q3), first quartile (Q1), and the maximum value.
These values are further used to distinguish other data. It graphically shows a varied range of
data in a single figure. It also offers an indication of the data's symmetry and the skewness. In
the box plot, the sample size is found to have a higher priority because the data interpretation
depends upon the same. The given data set has been categorized into Infestation, Rainy, and
Temperature between 2015 and 2019. In the case of the infestation process, there are 1097
observations. Based on the obtained data, 0 denotes where the infestation is not processed and
1 denotes the infestation is processed, which has been illustrated in the tables and figure
below.
2015 2016 2017 2018 2019
Minimum 0 0 0 0 0
Quartile 1 0 0 0 0 0
Median 0 0 0 0 0
Quartile 3 0 1 1 1 0
Maximum 1 1 1 1 1
Boxes Stacked Bar Chart 2015 2016 2017 2018 2019
Q1-0 0 0 0 0 0
Median- Q1 0 0 0 0 0
Q3- Median 0 1 1 1 0
Page 6
⊘ This is a preview!⊘
Do you want full access?
Subscribe today to unlock all pages.
Trusted by 1+ million students worldwide
PRINCIPLES OF DATA SCIENCE
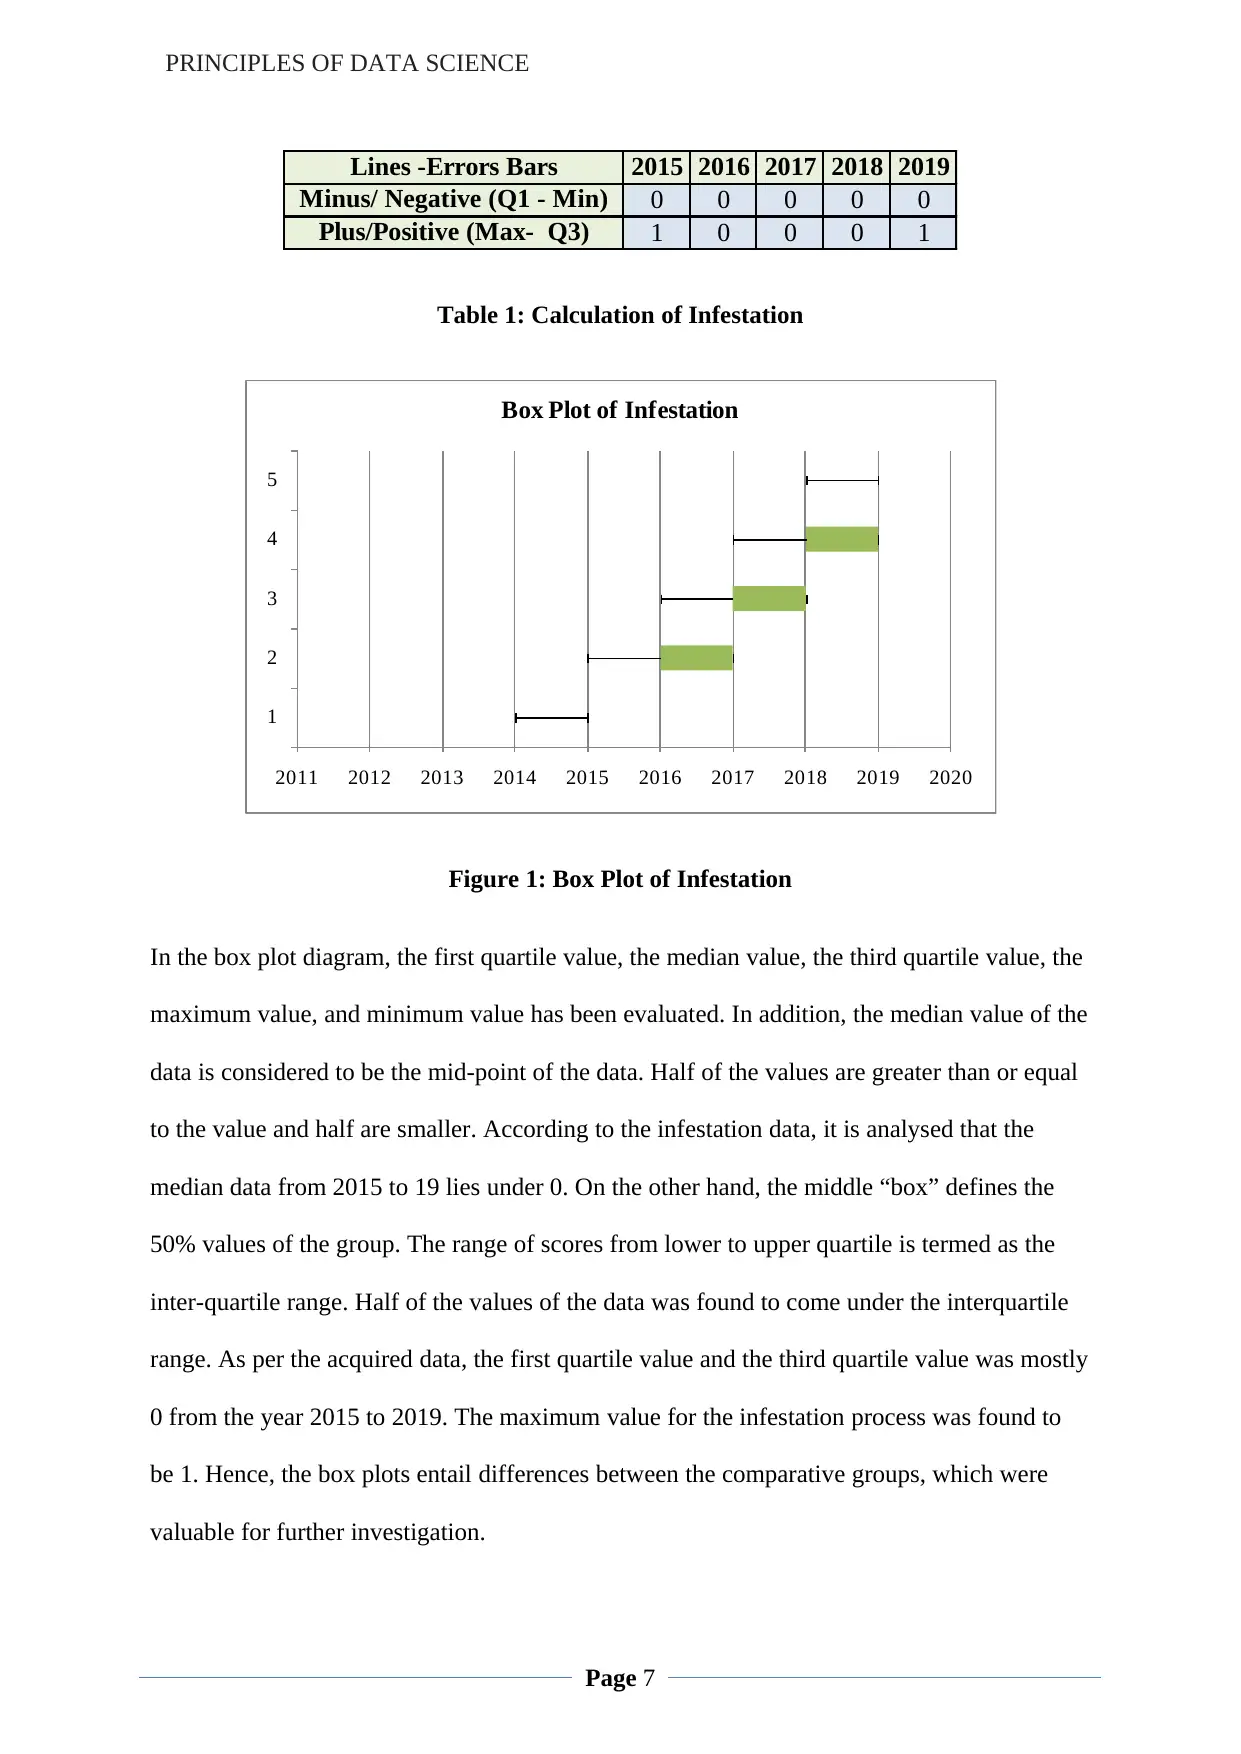
Lines -Errors Bars 2015 2016 2017 2018 2019
Minus/ Negative (Q1 - Min) 0 0 0 0 0
Plus/Positive (Max- Q3) 1 0 0 0 1
Table 1: Calculation of Infestation
2011 2012 2013 2014 2015 2016 2017 2018 2019 2020
1
2
3
4
5
Box Plot of Infestation
Figure 1: Box Plot of Infestation
In the box plot diagram, the first quartile value, the median value, the third quartile value, the
maximum value, and minimum value has been evaluated. In addition, the median value of the
data is considered to be the mid-point of the data. Half of the values are greater than or equal
to the value and half are smaller. According to the infestation data, it is analysed that the
median data from 2015 to 19 lies under 0. On the other hand, the middle “box” defines the
50% values of the group. The range of scores from lower to upper quartile is termed as the
inter-quartile range. Half of the values of the data was found to come under the interquartile
range. As per the acquired data, the first quartile value and the third quartile value was mostly
0 from the year 2015 to 2019. The maximum value for the infestation process was found to
be 1. Hence, the box plots entail differences between the comparative groups, which were
valuable for further investigation.
Page 7
Paraphrase This Document
Need a fresh take? Get an instant paraphrase of this document with our AI Paraphraser
PRINCIPLES OF DATA SCIENCE
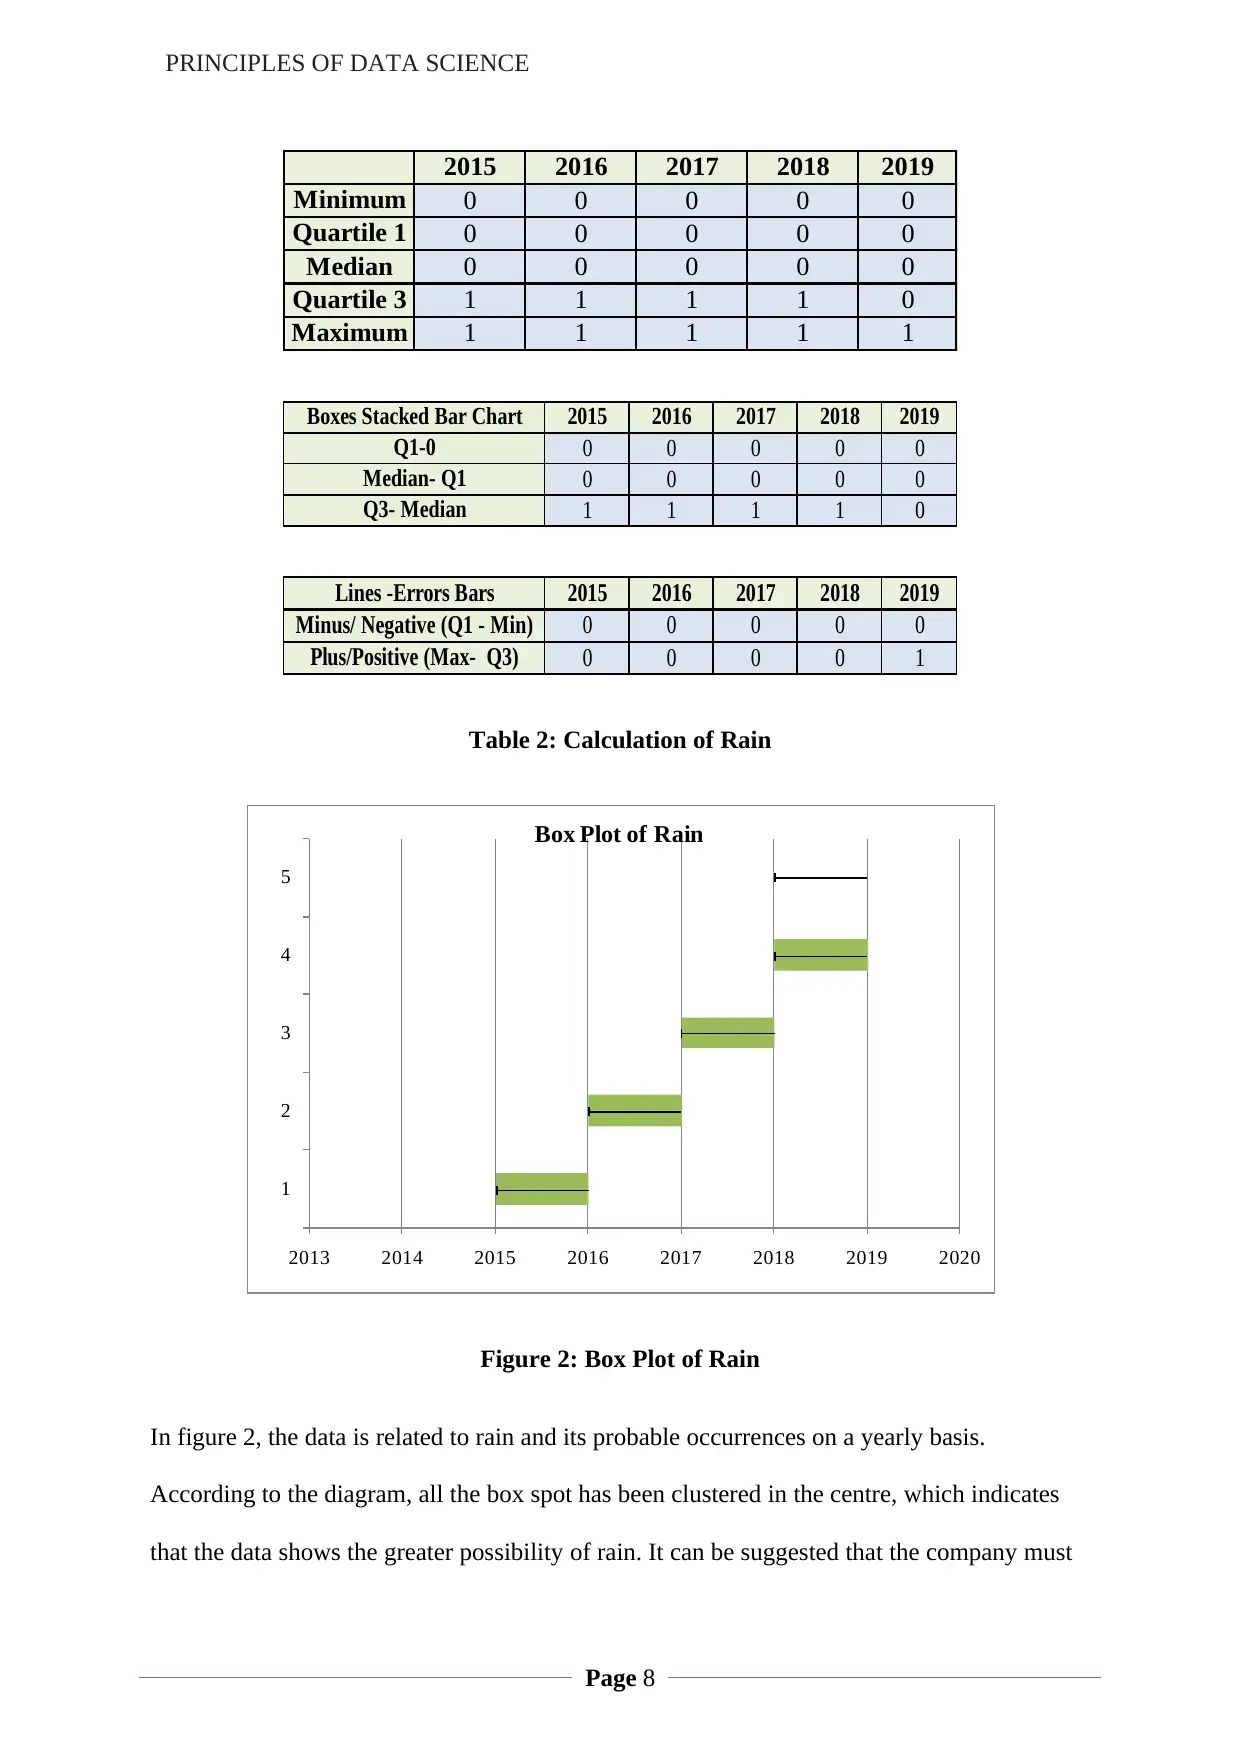
2015 2016 2017 2018 2019
Minimum 0 0 0 0 0
Quartile 1 0 0 0 0 0
Median 0 0 0 0 0
Quartile 3 1 1 1 1 0
Maximum 1 1 1 1 1
Boxes Stacked Bar Chart 2015 2016 2017 2018 2019
Q1-0 0 0 0 0 0
Median- Q1 0 0 0 0 0
Q3- Median 1 1 1 1 0
Lines -Errors Bars 2015 2016 2017 2018 2019
Minus/ Negative (Q1 - Min) 0 0 0 0 0
Plus/Positive (Max- Q3) 0 0 0 0 1
Table 2: Calculation of Rain
2013 2014 2015 2016 2017 2018 2019 2020
1
2
3
4
5
Box Plot of Rain
Figure 2: Box Plot of Rain
In figure 2, the data is related to rain and its probable occurrences on a yearly basis.
According to the diagram, all the box spot has been clustered in the centre, which indicates
that the data shows the greater possibility of rain. It can be suggested that the company must
Page 8
PRINCIPLES OF DATA SCIENCE
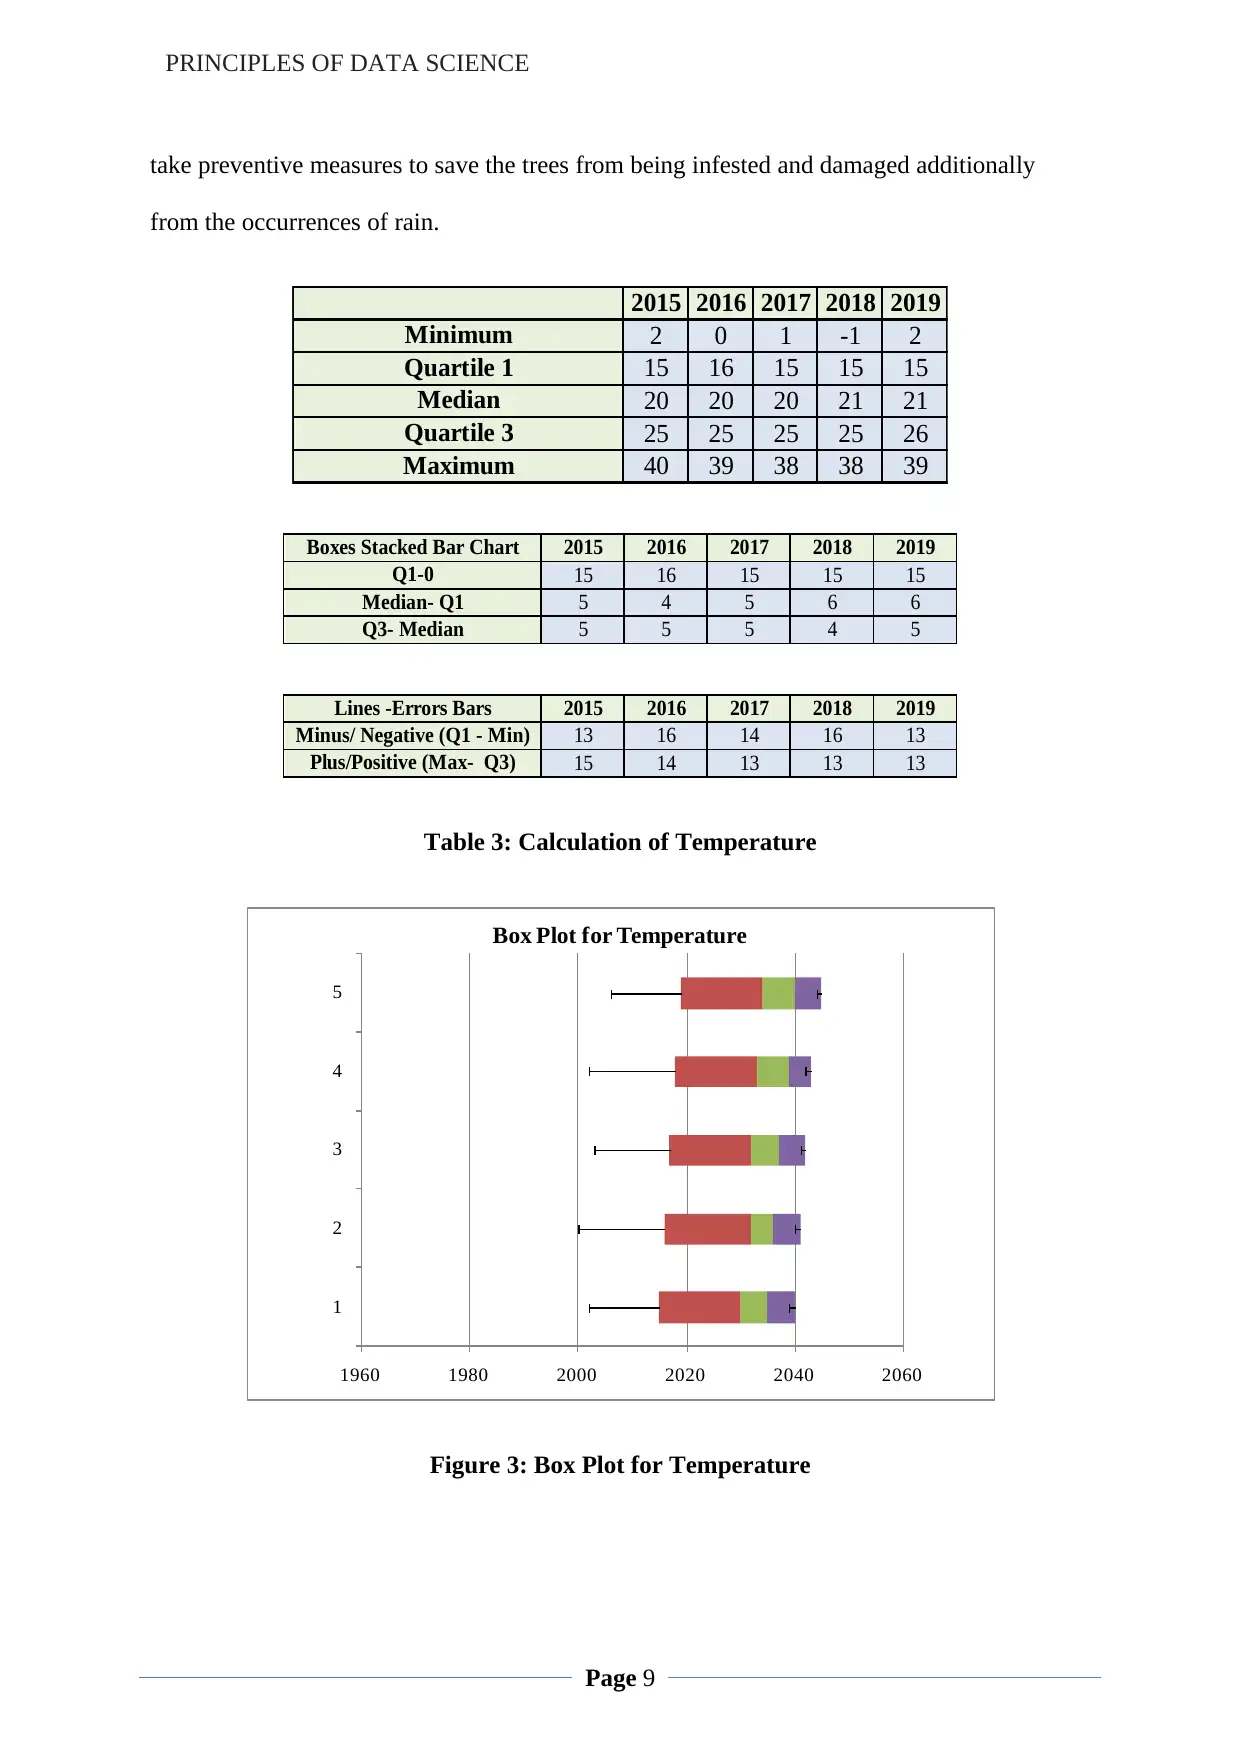
take preventive measures to save the trees from being infested and damaged additionally
from the occurrences of rain.
2015 2016 2017 2018 2019
Minimum 2 0 1 -1 2
Quartile 1 15 16 15 15 15
Median 20 20 20 21 21
Quartile 3 25 25 25 25 26
Maximum 40 39 38 38 39
Boxes Stacked Bar Chart 2015 2016 2017 2018 2019
Q1-0 15 16 15 15 15
Median- Q1 5 4 5 6 6
Q3- Median 5 5 5 4 5
Lines -Errors Bars 2015 2016 2017 2018 2019
Minus/ Negative (Q1 - Min) 13 16 14 16 13
Plus/Positive (Max- Q3) 15 14 13 13 13
Table 3: Calculation of Temperature
1960 1980 2000 2020 2040 2060
1
2
3
4
5
Box Plot for Temperature
Figure 3: Box Plot for Temperature
Page 9
⊘ This is a preview!⊘
Do you want full access?
Subscribe today to unlock all pages.
Trusted by 1+ million students worldwide
PRINCIPLES OF DATA SCIENCE
In this figure above, it was observed that the temperature has been gradually increasing,
which indicates a high risk for the company to carry out pest control initiatives. Based on the
given data, the minimum value of the temperature is -1. On the other hand, the average value
of the first quartile was15. Most importantly, the value of the median lied between 20 and 21
in the five years. Furthermore, the third quartile value was ranging from 25 to 26 and the
maximum value of temperature was 38 to 40 in the five years (2015-2019). In relation to the
study, it was mentioned that If (rainy AND temperature >= 15) OR (NOT rainy AND
temperature >= 22; then there will be a high risk of stunting and infestation, ELSE there will
be a Low risk of stunting and infestation. Based on this concept, it can be affirmed that there
will be a high risk of stunting and infestation. However, in some cases, there is a low risk of
stunting and infestation according to the obtained data. This analysis is focused on
environmental factors such as climate change, predicting the insect invasion, and taking the
temperature of the plants. In addition, the box plots helped in identifying the skewness of the
data related to the pest infestation. It can be interpreted that the skewness risk has increased
the risk of the data point in a distribution.
Ethical and Security Considerations
Big data analytics increases the number of ethical problems. The given data set in the study
also is huge in number, which depicts its complexity. There are certain principals of ethics
and security consideration that must be taken into account in the study. There are mainly
unfair discrimination, lack of transparency and reinforcement of the human biases, which are
considered as ethical as well as security challenges that were dealt with in data science
initiative.
Page
10
Paraphrase This Document
Need a fresh take? Get an instant paraphrase of this document with our AI Paraphraser
PRINCIPLES OF DATA SCIENCE
Unfair Discrimination
Being a data scientist, an individual must develop an equivalent algorithm, which works for
any defendant in the study. The fair algorithm states that the percentage of the defendants,
who provokes each risk category, is the same regardless of race. In simple words, a risk score
of 7 must be considered to be high in relation to stunting and infestation. Objective
algorithms are the reflection of the biases that plague the data science initiative. In addition, if
data enables social biases against sensitive attributes, then the inferences evaluated from the
data can also be unfair.
Reinforcement of Human Biases
Reinforcement of the human biases is also considered to be ethical along with security
consideration because human biases can be a major problem for generating false results. In
this way, future predictions and results’ interpretation will become irrelevant.
Lack of Transparency
Transparency is needed while doing the analysis in relation to the study. The given data set
has a huge number of data. In the given case, the model, process and its parameters by which
the assumption is formulated must be transparent. The process of the evaluation cannot be
properly done if the functioning process of the data is not clearly understood. On the other
hand, the statistical model cannot be differentiated with the analytical power of a single
variable with that of the set of numerous variables. The procedures for handling responsive
data must also be ethically done so that the aims and objectives of the study are obtained.
Data Science in Next Steps and Potential Solutions
According to the study, data science is being used to interpret the patterns and behaviour of
natural phenomena including temperature and rain. It is found to be useful for forecasting the
Page
11
PRINCIPLES OF DATA SCIENCE
effect of pests and identifying the problem. This data analysis and their tools helped the
company to predict the future with respect to the predictive algorithms, analytics, and other
rising technologies. In relation to the study, advanced algorithms of the analytics inform the
company how to manage pests. Hence, with the help of data science, FluffyGroCo can
efficiently manage the infestations of pests by enabling the data analytics tools in the problem
areas. FluffyGroCo has a huge potential to incorporate the organic process so that the natural
resources present in the environment will not be exploited. Another solution can be taken by
the company, which is the treatment of the Truffula forests with bacteria that feeds on the
larvae when a high incidence of stunting is expected. Analysis of the environmental factors
also provides a possible solution for pest control. Hence, FluffyGroCo can also use artificial
intelligence to control the pest. There are various types of innovation that can be used by the
company such as collaboration of artificial intelligence (AI) and data science. These can be
implemented in order to control the infestation of pests in an affordable and quick manner.
This can prove to be highly beneficial for the company in the future. It can also improve the
efficiency of the business. OCR technology can be used by the company, which provides
real-time field inspection and also time-to-time response (Medium 2018).
Technical Benefits of Data Science
There are varied technical benefits of the data science that can be efficiently utilized by the
organisations in the modern context. With the help of AI, an organisation can inspect the real
situation of the fields and the response in the quickest fashion. It also enables fast
identification of the problem so that it will be helpful for the company to conduct the
necessary steps to solve the same. The company can also capture the images of the fields via
drone or satellite to maintain the safety and security of the production area. (Medium
2018).Those captured images can be then documented, analysed, and compared with other
images, which are collected from the database to understand the progress. This technology is
Page
12
⊘ This is a preview!⊘
Do you want full access?
Subscribe today to unlock all pages.
Trusted by 1+ million students worldwide
1 out of 17
Related Documents


Your All-in-One AI-Powered Toolkit for Academic Success.
+13062052269
info@desklib.com
Available 24*7 on WhatsApp / Email
![[object Object]](/_next/static/media/star-bottom.7253800d.svg)
Unlock your academic potential
Copyright © 2020–2026 A2Z Services. All Rights Reserved. Developed and managed by ZUCOL.