Data Science Assessment 1: R Code and Iris Dataset Analysis Report
VerifiedAdded on 2023/02/01
|20
|2984
|67
Homework Assignment
AI Summary
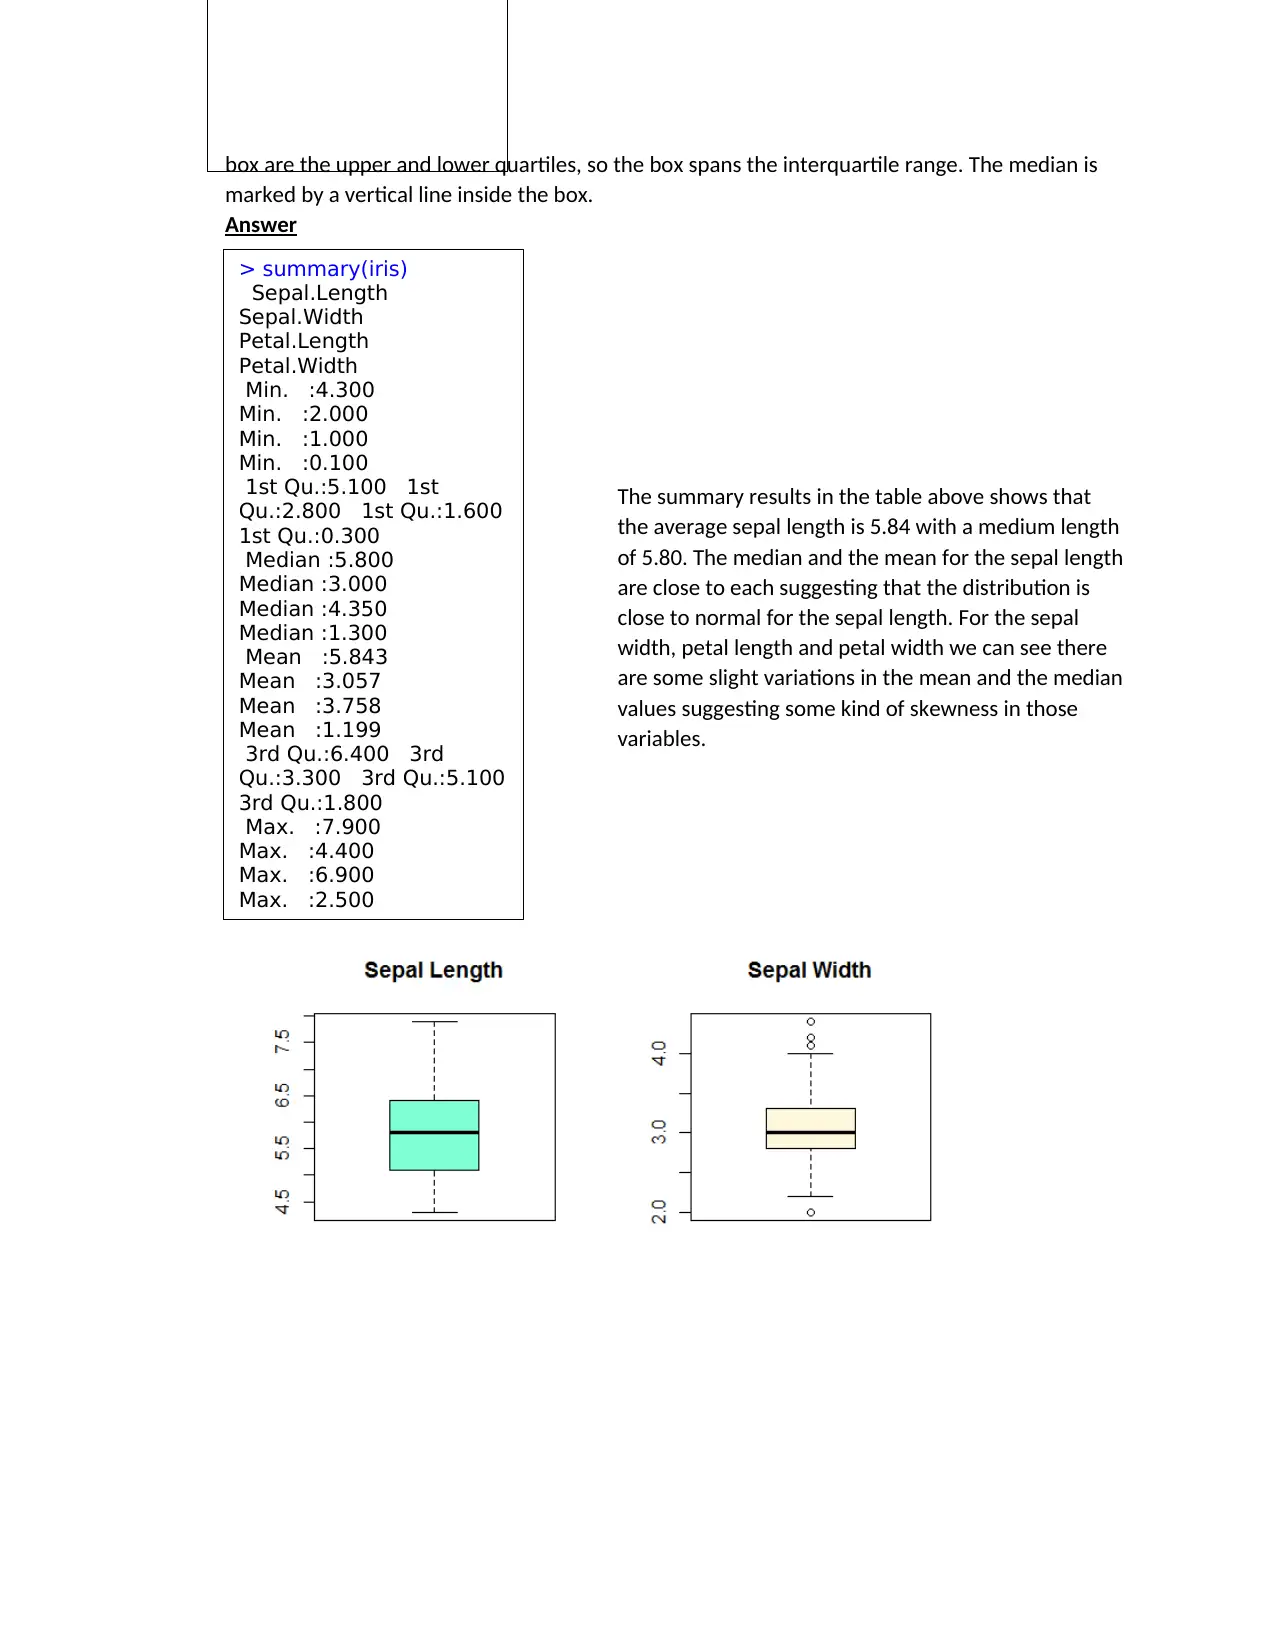
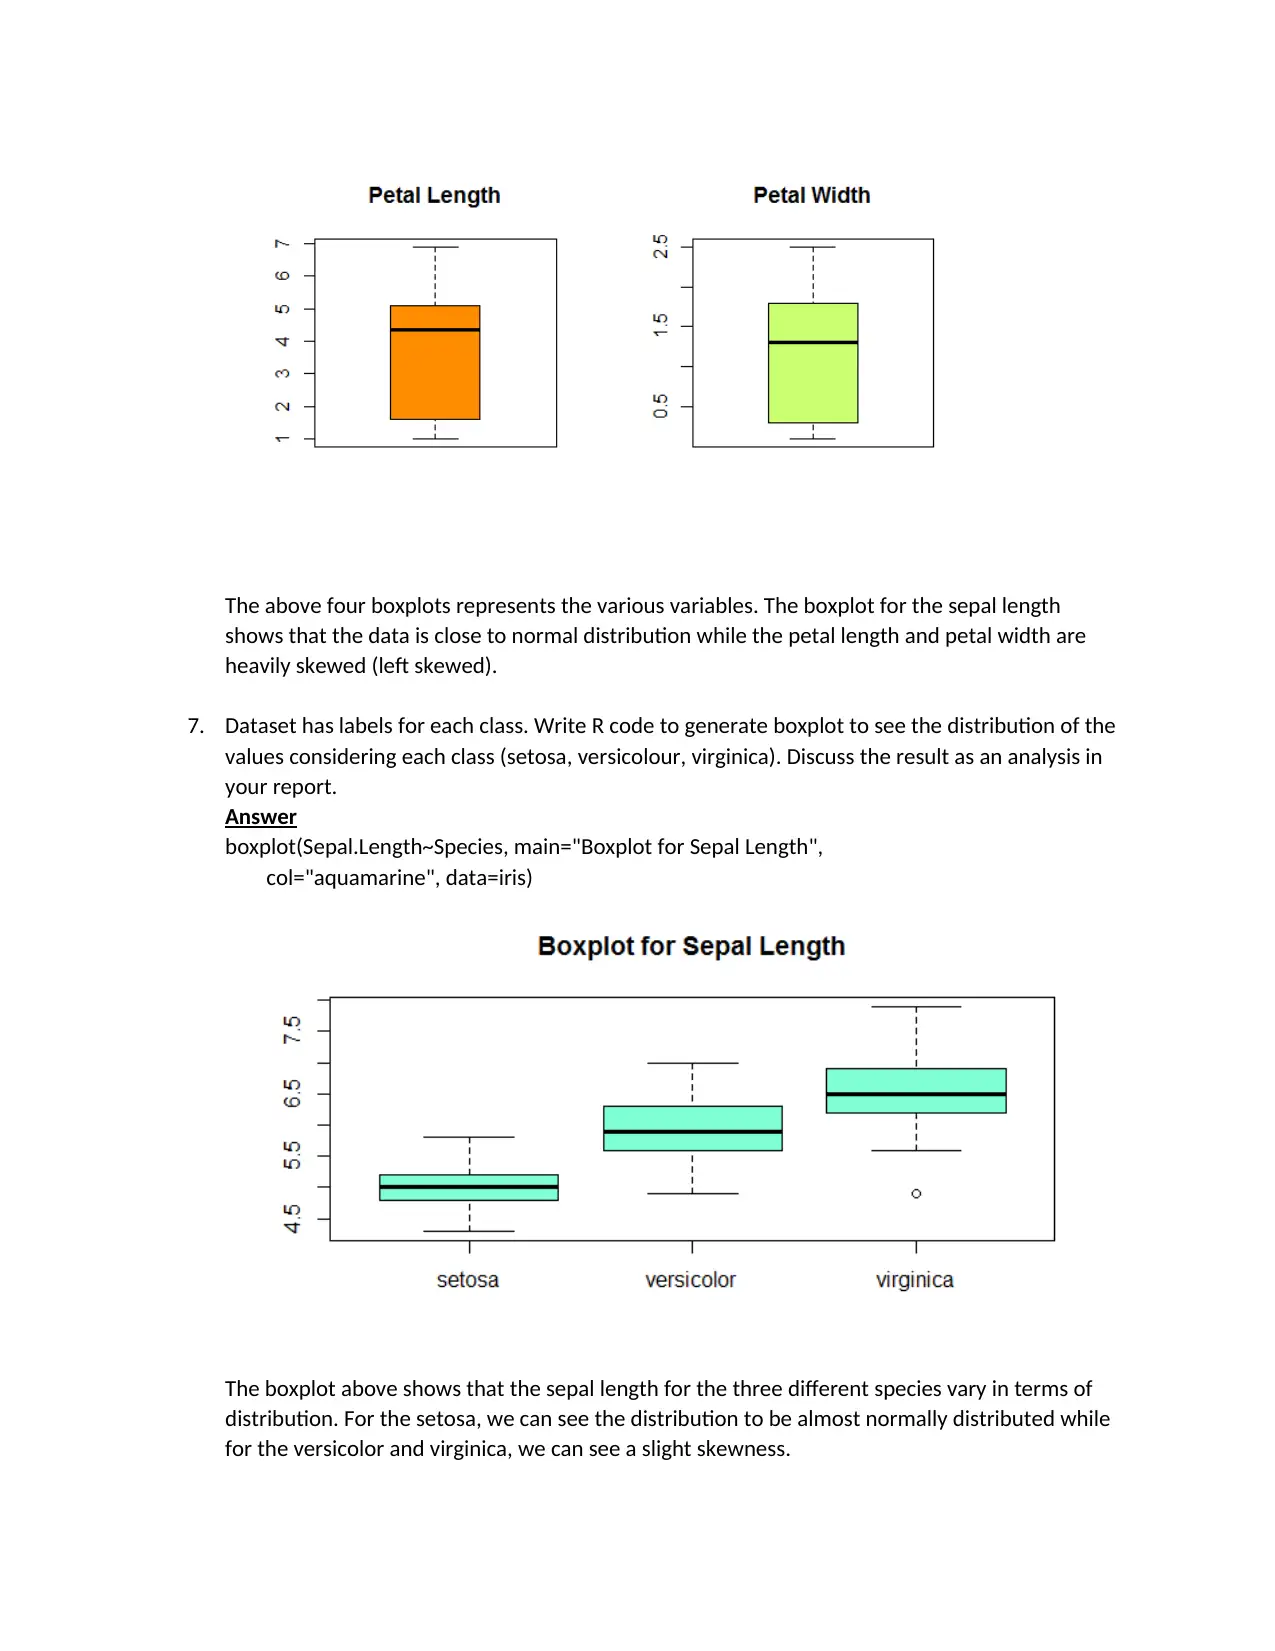
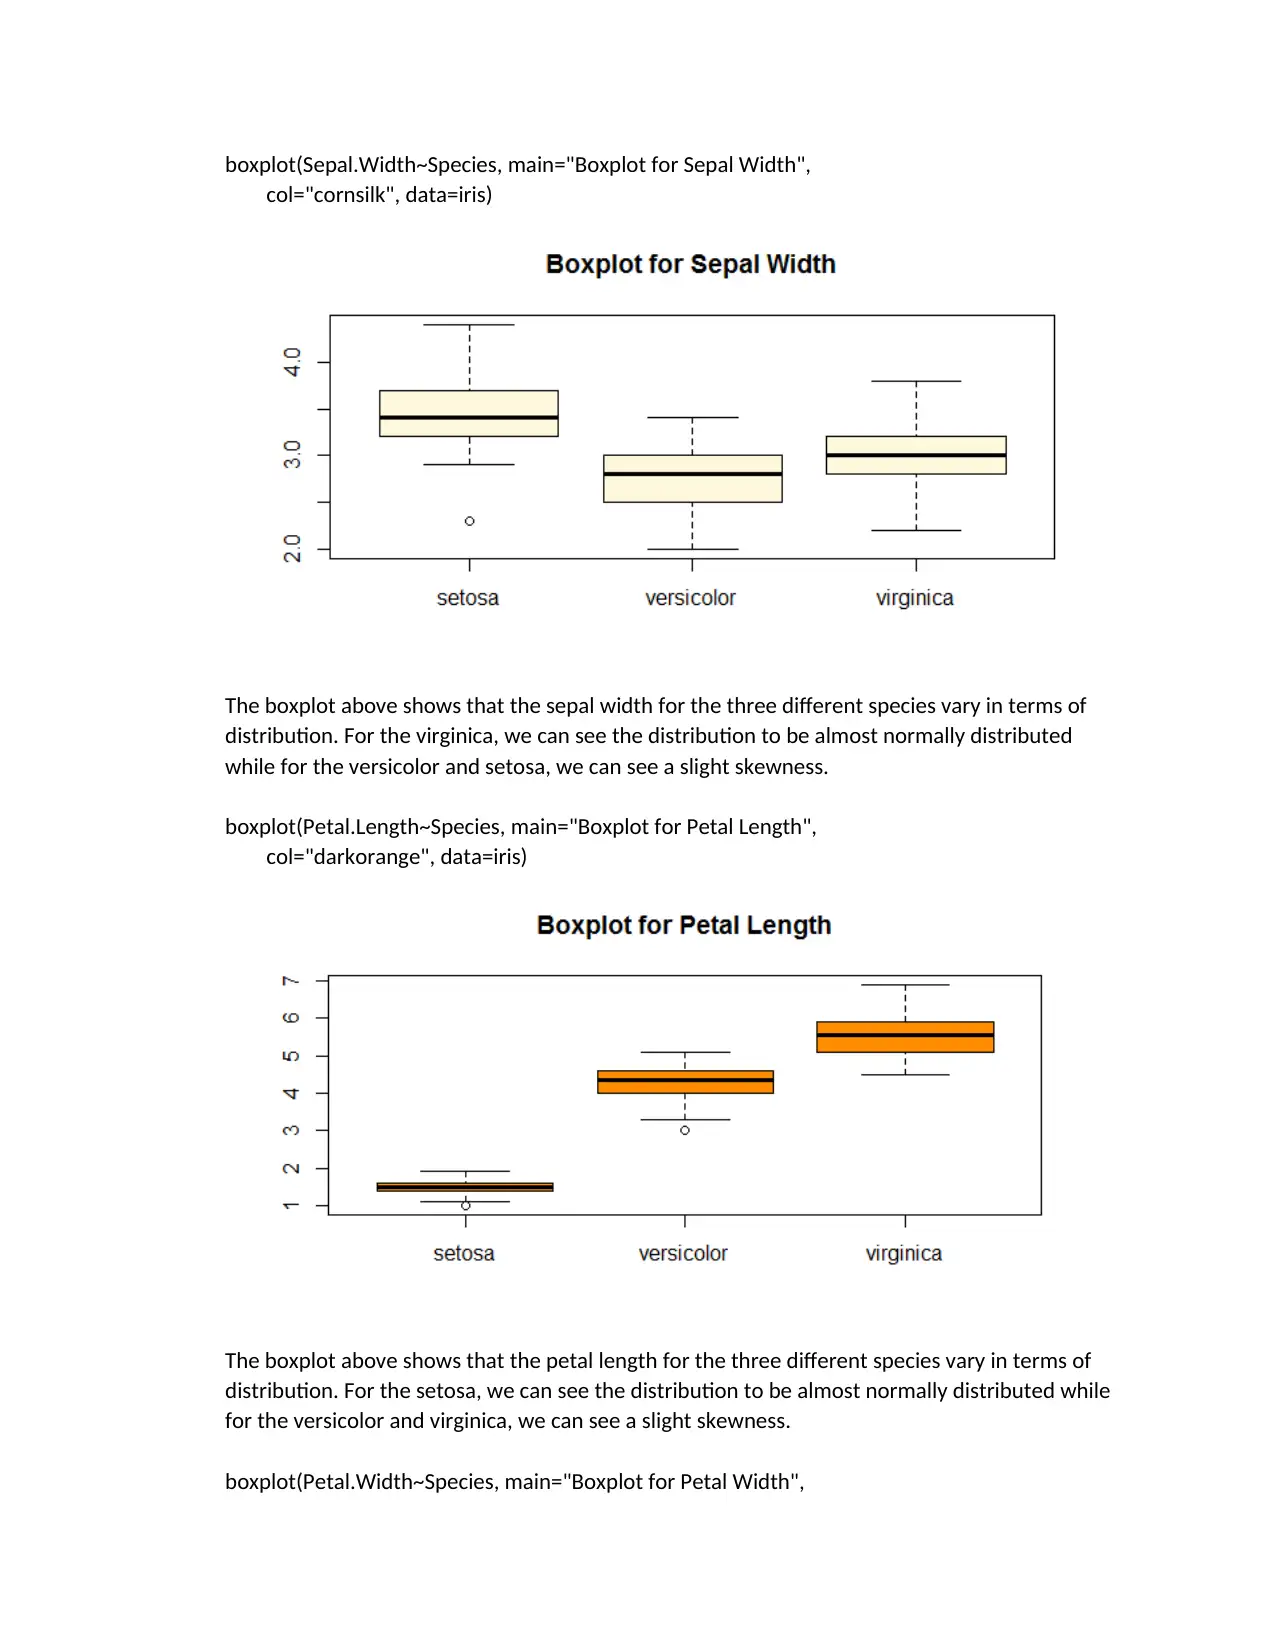
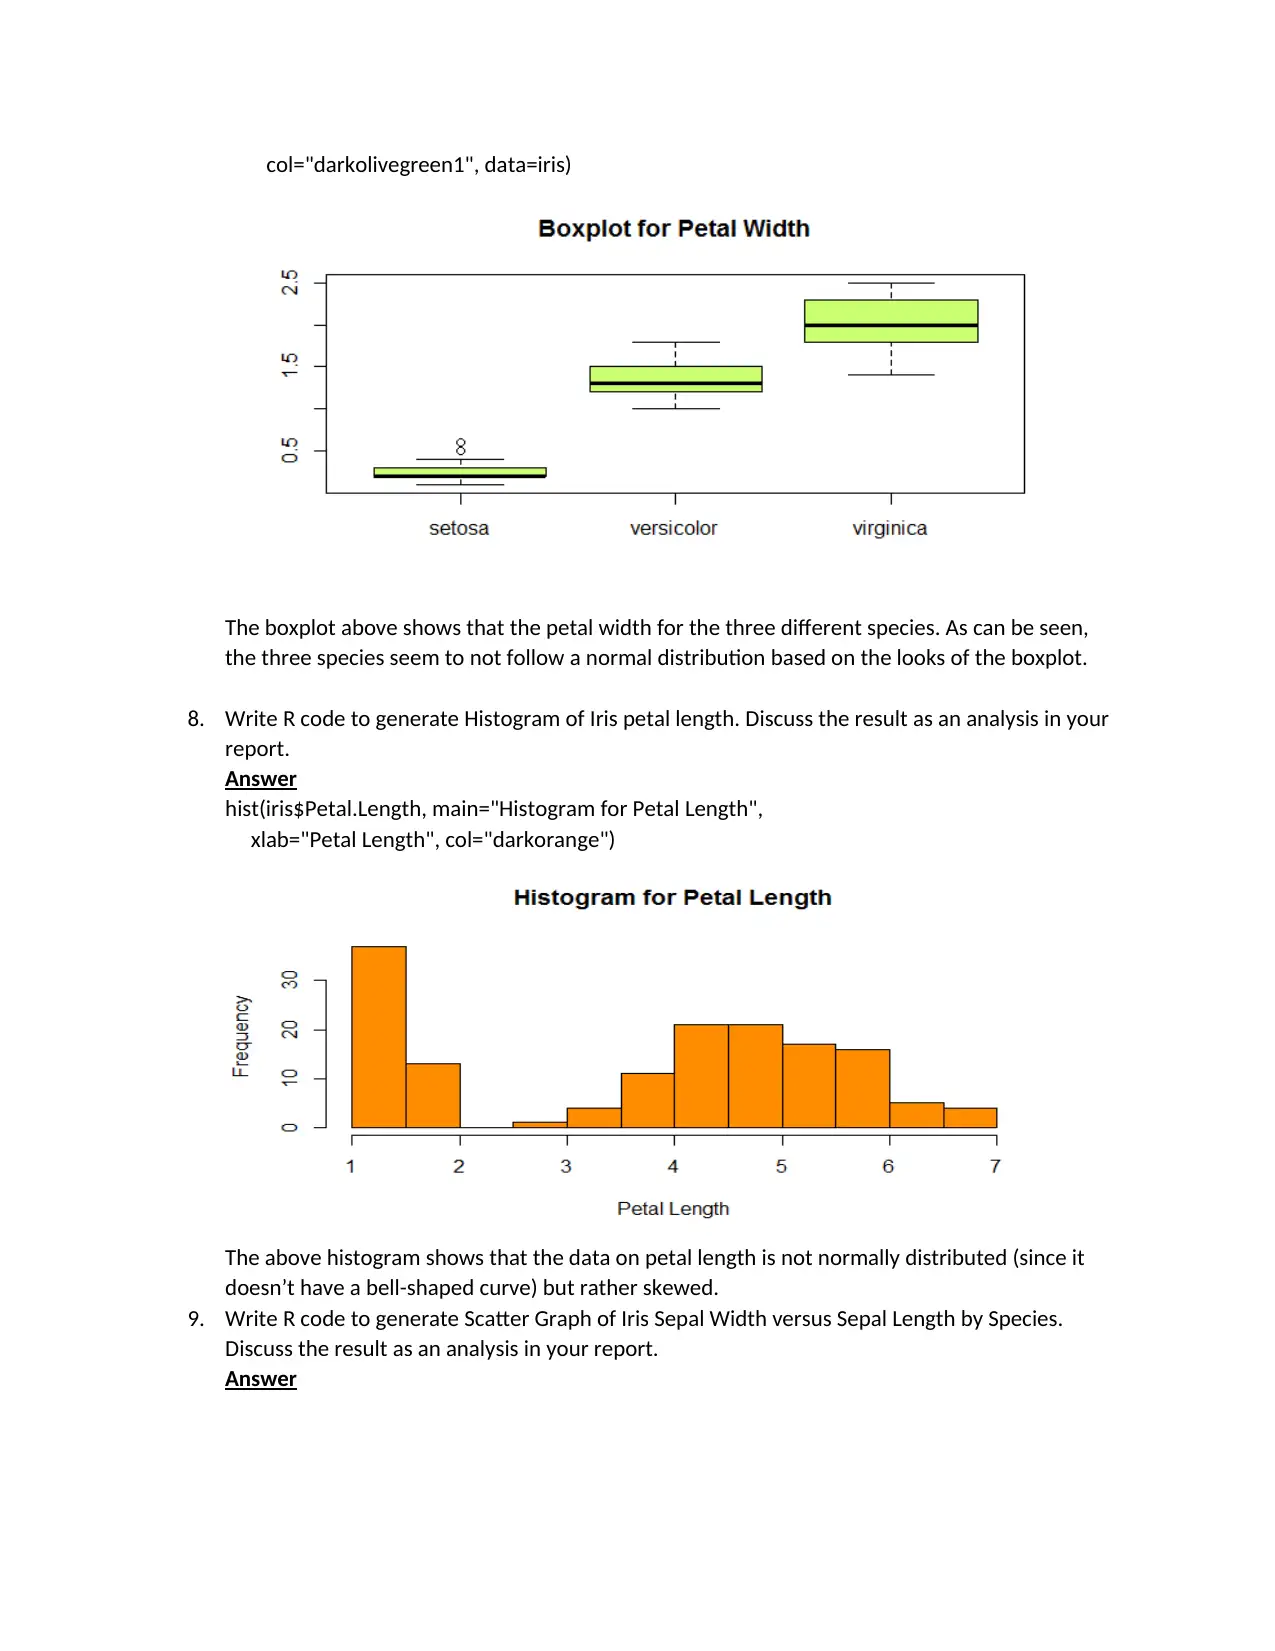
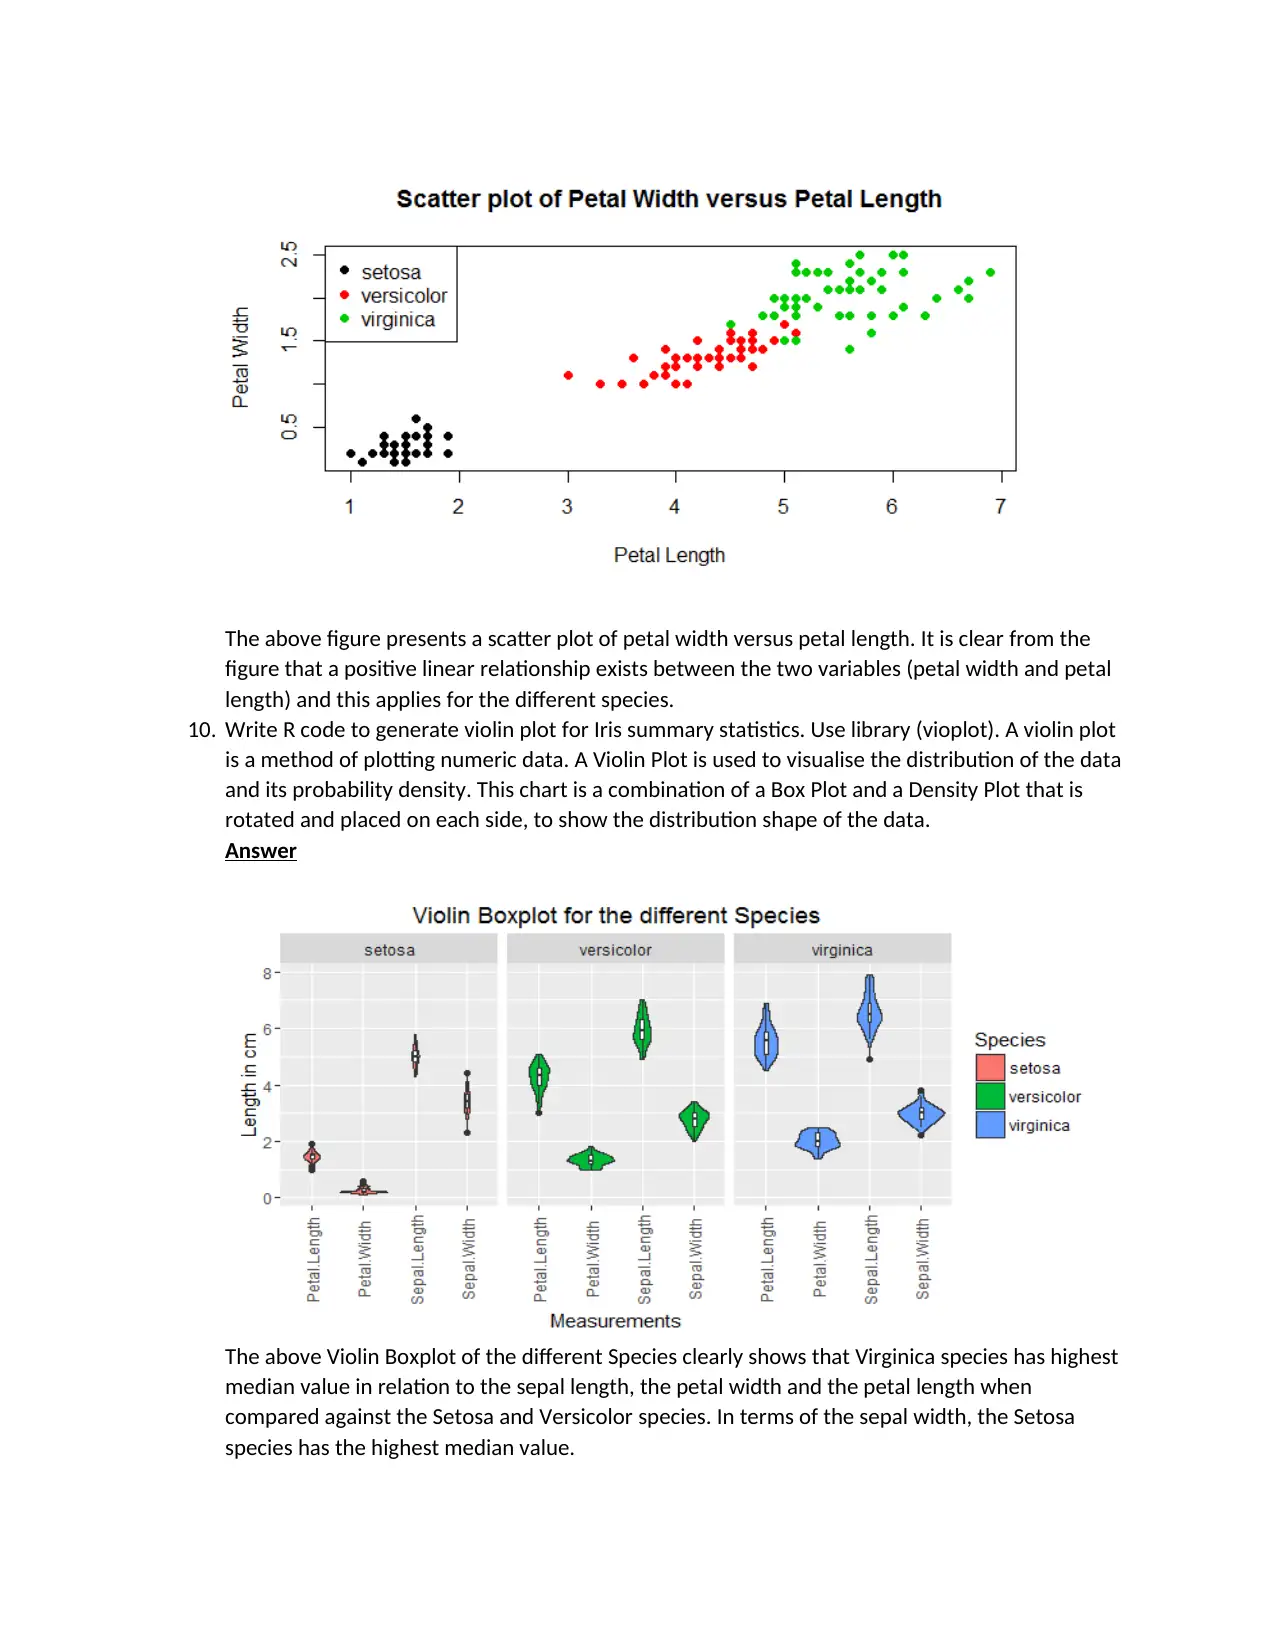
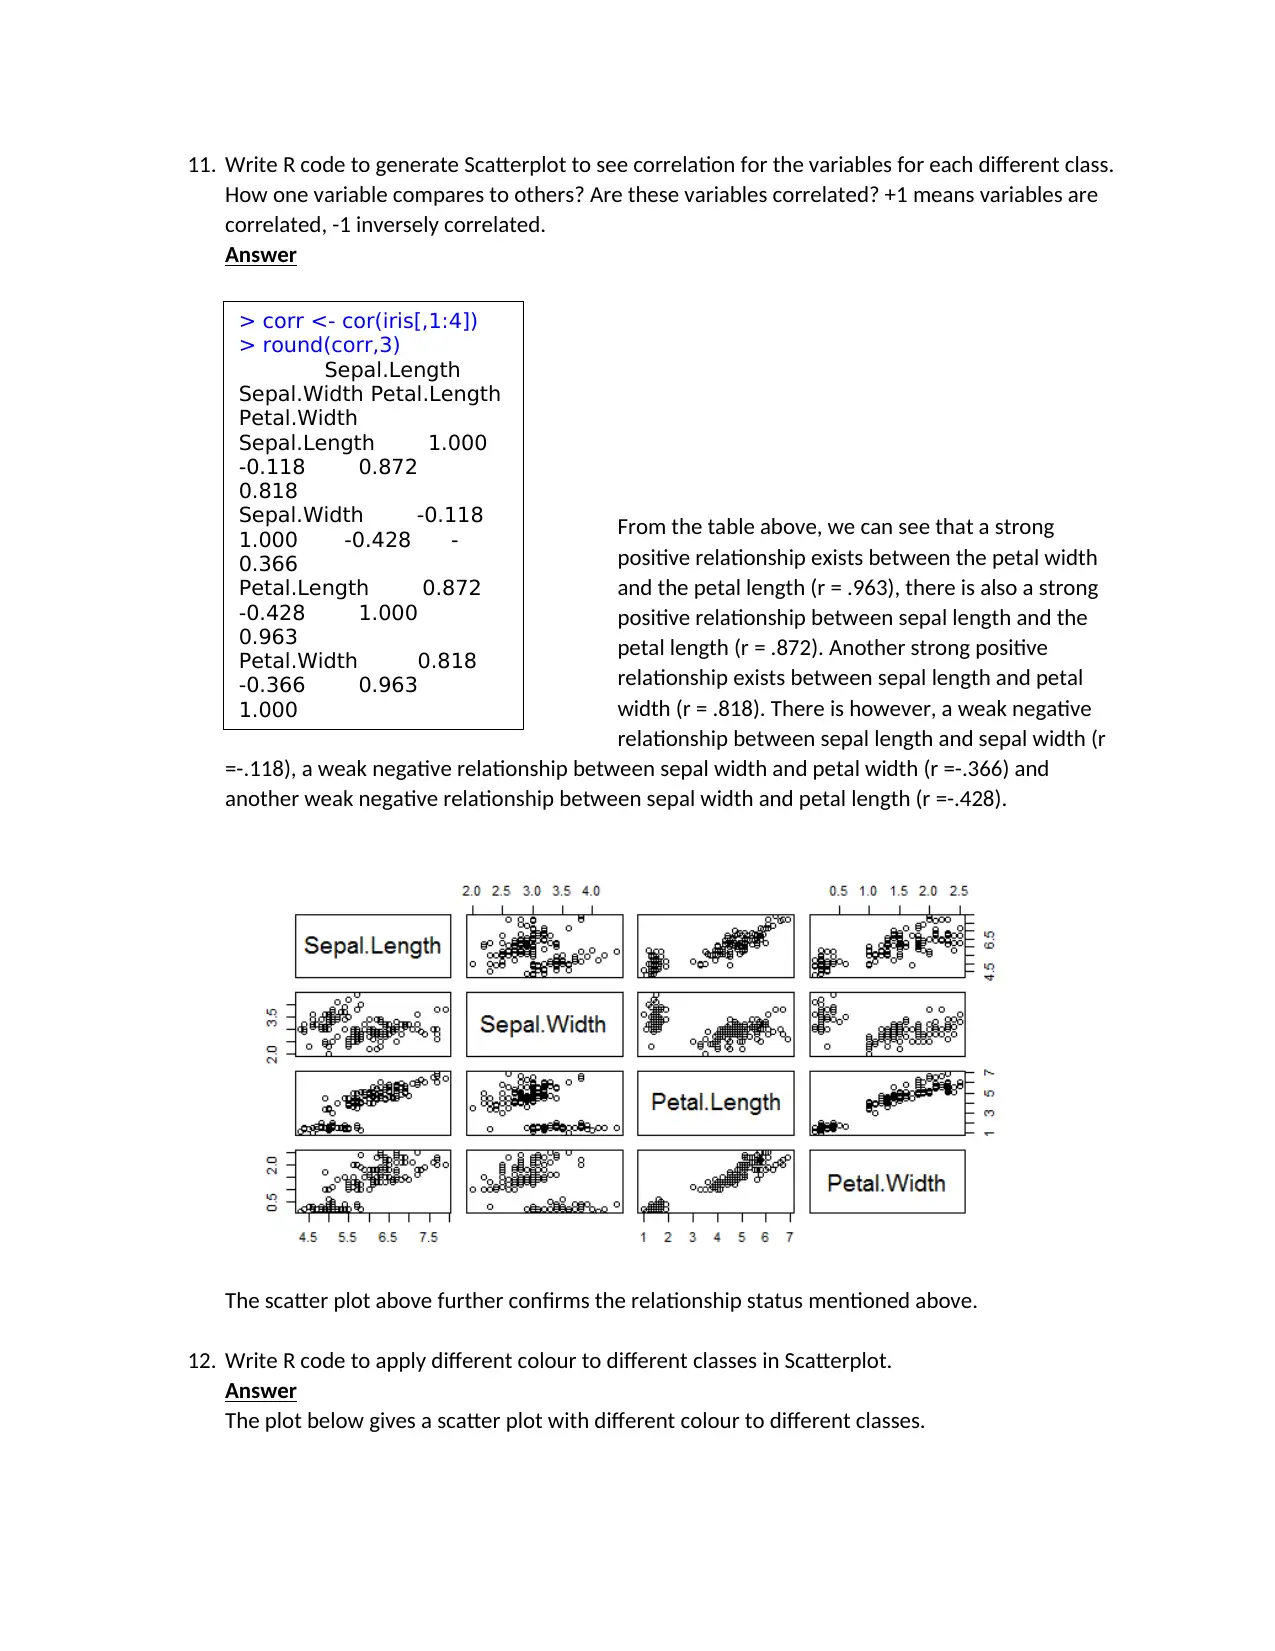
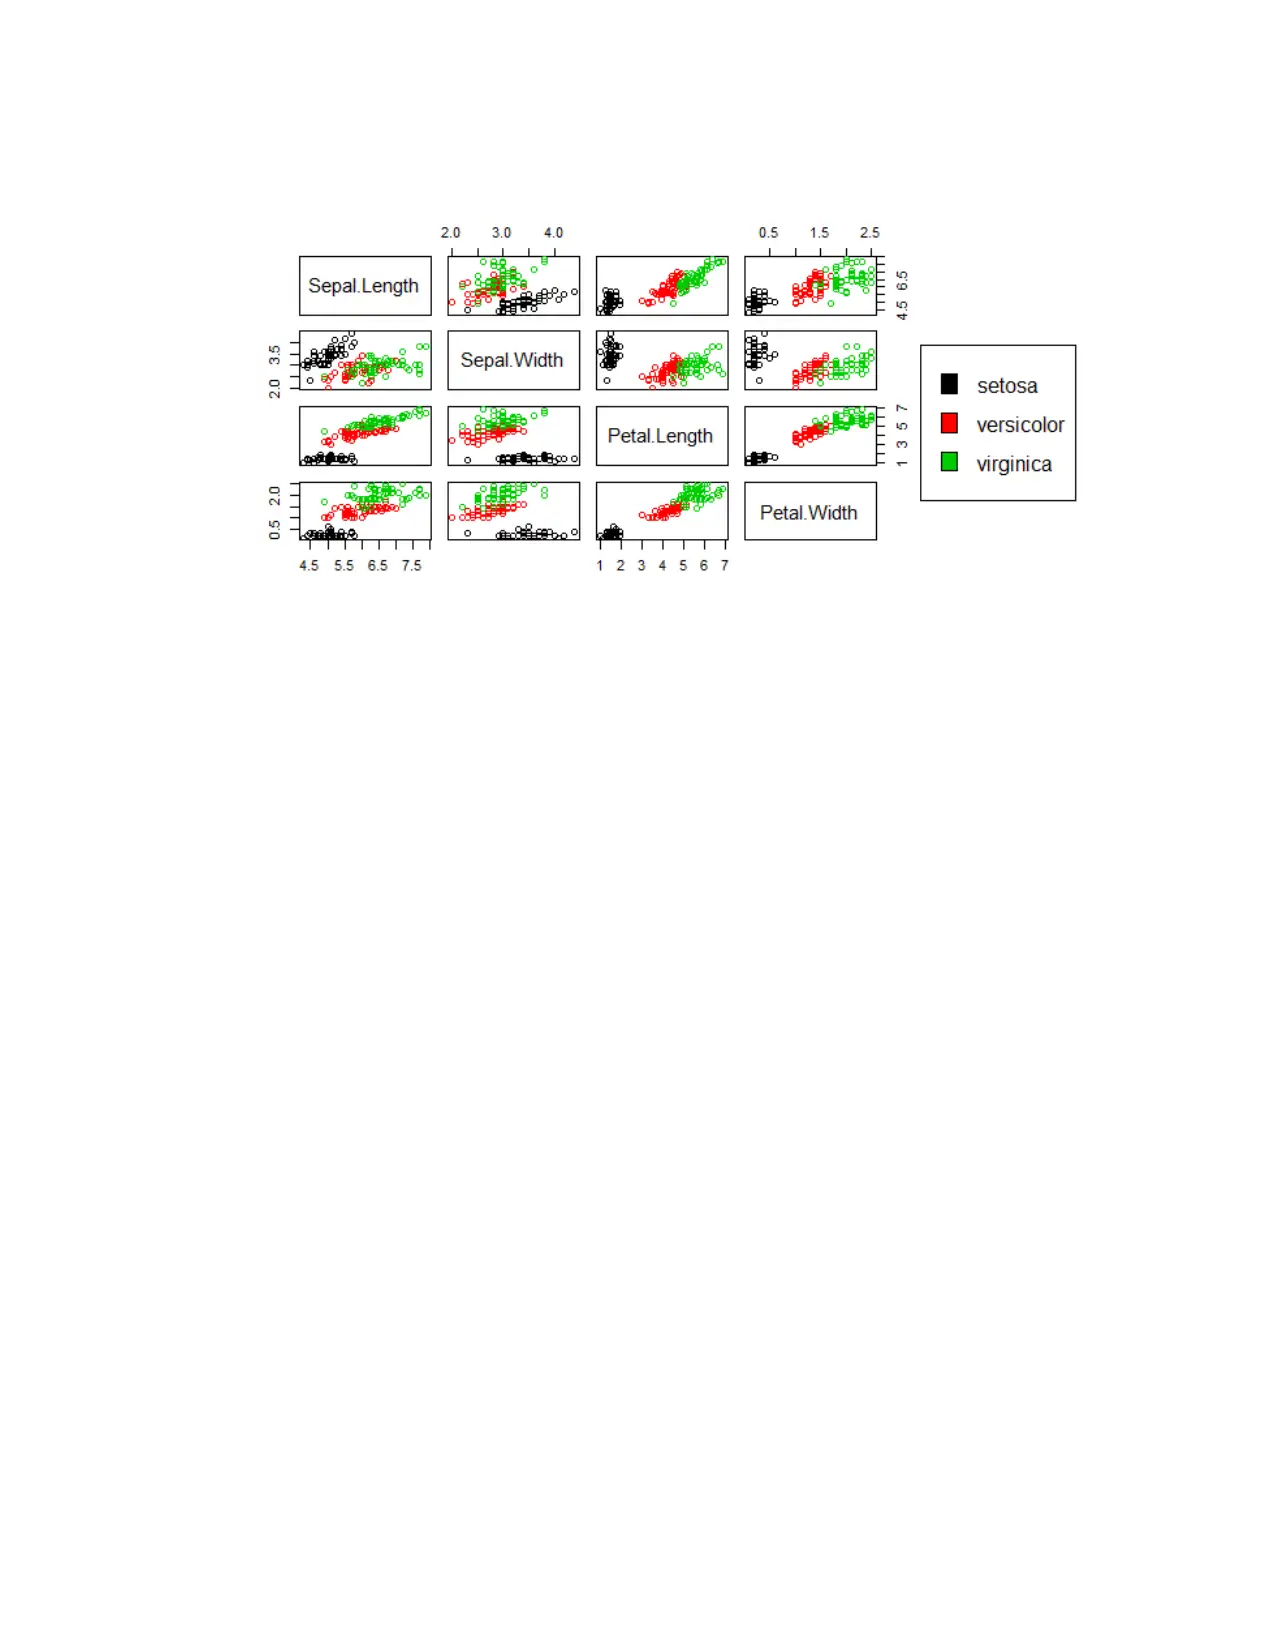
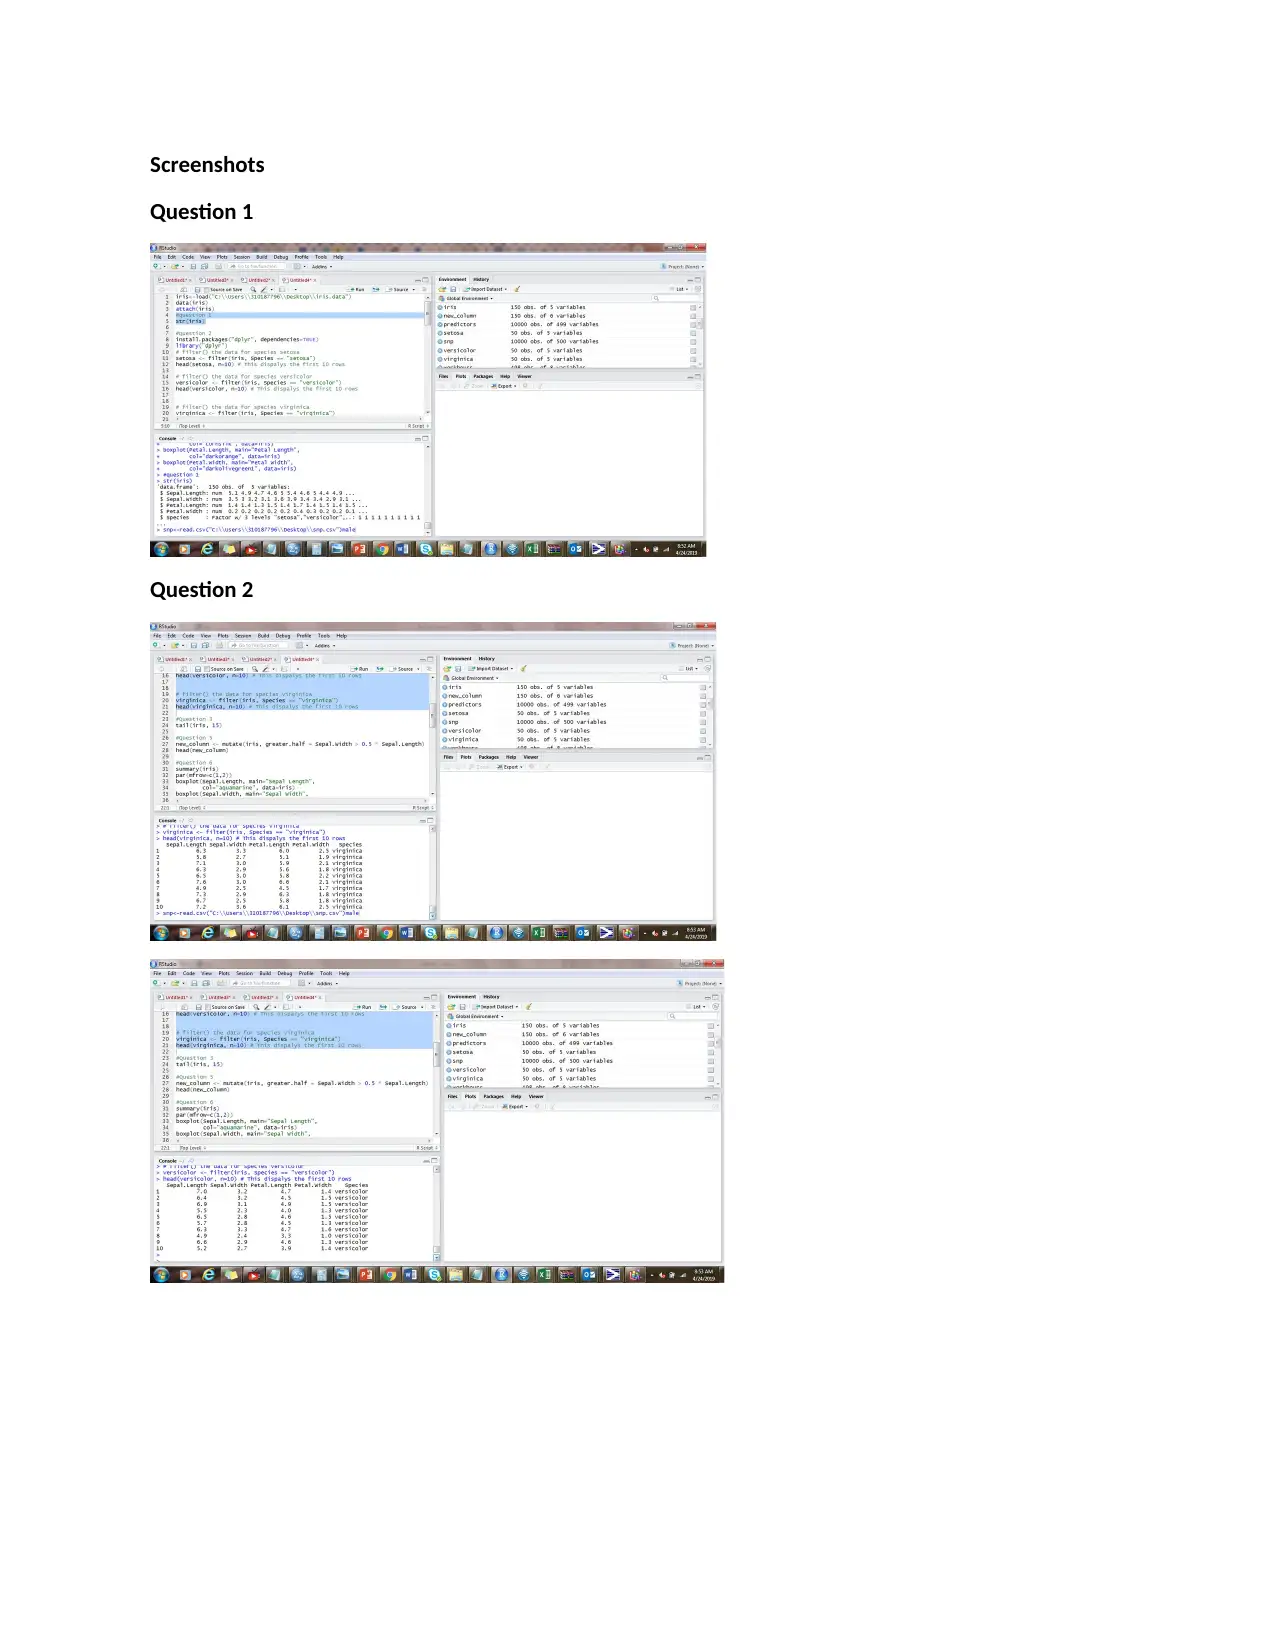
This document presents a comprehensive Data Science assignment solution, focusing on the analysis of the Iris dataset using the R programming language. The assignment covers a range of data science concepts, including data exploration, data manipulation, and data visualization. The student begins by exploring the dataset's structure, identifying variables and records. R code is provided to filter the data and display specific rows for each species (setosa, versicolor, and virginica). The solution also involves calculating and comparing petal lengths, determining the shortest petal length among species. The assignment progresses to creating new columns based on logical conditions, generating summary statistics, and visualizing the data using boxplots, histograms, scatter plots, and violin plots. The student analyzes the distribution of data, identifies correlations between variables, and interprets the results. The document includes R code snippets, output screenshots, and detailed analysis of the generated output, demonstrating a strong understanding of data science principles and their application using R.

Data Science
Student Name:
Instructor Name:
Course Number:
24 April 2019
Student Name:
Instructor Name:
Course Number:
24 April 2019
Paraphrase This Document
Need a fresh take? Get an instant paraphrase of this document with our AI Paraphraser

1. Write R code to see how many variables and records are in dataset Iris.
Answer
The code is given above, where we can see that we
have 5 variables with 150 records.
2. Write R code to read first 10 rows of each subset (setosa,
versicolour, virginica).
Answer
The R codes are given below;
# filter() the data for species setosa
setosa <- filter(iris, Species == "setosa")
head(setosa, n=10)
# filter() the data for species versicolor
versicolor <- filter(iris, Species == "versicolor")
head(versicolor, n=10)
# filter() the data for species virginica
virginica <- filter(iris, Species == "virginica")
head(virginica, n=10)
The R outputs are given below;
> str(iris)
'data.frame': 150
obs. of 5 variables:
$ Sepal.Length: num 5.1
4.9 4.7 4.6 5 5.4 4.6 5
4.4 4.9 ...
$ Sepal.Width : num 3.5
3 3.2 3.1 3.6 3.9 3.4 3.4
2.9 3.1 ...
$ Petal.Length: num 1.4
1.4 1.3 1.5 1.4 1.7 1.4
1.5 1.4 1.5 ...
$ Petal.Width : num 0.2
0.2 0.2 0.2 0.2 0.4 0.3
0.2 0.2 0.1 ...
$ Species : Factor w/ 3
levels
"setosa","versicolor",..: 1
1 1 1 1 1 1
> setosa <- filter(iris,
Species == "setosa")
> head(setosa, n=10)
Sepal.Length
Sepal.Width Petal.Length
Petal.Width Species
1 5.1 3.5
1.4 0.2 setosa
2 4.9 3.0
1.4 0.2 setosa
3 4.7 3.2
1.3 0.2 setosa
4 4.6 3.1
1.5 0.2 setosa
5 5.0 3.6
1.4 0.2 setosa
6 5.4 3.9
1.7 0.4 setosa
7 4.6 3.4
1.4 0.3 setosa
8 5.0 3.4
1.5 0.2 setosa
9 4.4 2.9
1.4 0.2 setosa
10 4.9 3.1
1.5 0.1 setosa
> versicolor <- filter(iris,
Species == "versicolor")
> head(versicolor, n=10)
Sepal.Length
Sepal.Width Petal.Length
Petal.Width Species
1 7.0 3.2
4.7 1.4 versicolor
2 6.4 3.2
4.5 1.5 versicolor
3 6.9 3.1
4.9 1.5 versicolor
4 5.5 2.3
4.0 1.3 versicolor
5 6.5 2.8
Answer
The code is given above, where we can see that we
have 5 variables with 150 records.
2. Write R code to read first 10 rows of each subset (setosa,
versicolour, virginica).
Answer
The R codes are given below;
# filter() the data for species setosa
setosa <- filter(iris, Species == "setosa")
head(setosa, n=10)
# filter() the data for species versicolor
versicolor <- filter(iris, Species == "versicolor")
head(versicolor, n=10)
# filter() the data for species virginica
virginica <- filter(iris, Species == "virginica")
head(virginica, n=10)
The R outputs are given below;
> str(iris)
'data.frame': 150
obs. of 5 variables:
$ Sepal.Length: num 5.1
4.9 4.7 4.6 5 5.4 4.6 5
4.4 4.9 ...
$ Sepal.Width : num 3.5
3 3.2 3.1 3.6 3.9 3.4 3.4
2.9 3.1 ...
$ Petal.Length: num 1.4
1.4 1.3 1.5 1.4 1.7 1.4
1.5 1.4 1.5 ...
$ Petal.Width : num 0.2
0.2 0.2 0.2 0.2 0.4 0.3
0.2 0.2 0.1 ...
$ Species : Factor w/ 3
levels
"setosa","versicolor",..: 1
1 1 1 1 1 1
> setosa <- filter(iris,
Species == "setosa")
> head(setosa, n=10)
Sepal.Length
Sepal.Width Petal.Length
Petal.Width Species
1 5.1 3.5
1.4 0.2 setosa
2 4.9 3.0
1.4 0.2 setosa
3 4.7 3.2
1.3 0.2 setosa
4 4.6 3.1
1.5 0.2 setosa
5 5.0 3.6
1.4 0.2 setosa
6 5.4 3.9
1.7 0.4 setosa
7 4.6 3.4
1.4 0.3 setosa
8 5.0 3.4
1.5 0.2 setosa
9 4.4 2.9
1.4 0.2 setosa
10 4.9 3.1
1.5 0.1 setosa
> versicolor <- filter(iris,
Species == "versicolor")
> head(versicolor, n=10)
Sepal.Length
Sepal.Width Petal.Length
Petal.Width Species
1 7.0 3.2
4.7 1.4 versicolor
2 6.4 3.2
4.5 1.5 versicolor
3 6.9 3.1
4.9 1.5 versicolor
4 5.5 2.3
4.0 1.3 versicolor
5 6.5 2.8

3. Write R code and use tail() to view the last 15 rows in
datasetIris.
Answer
The code is given as;
tail(iris, 15 and the output is given below;
4. Write R code to show petal length of setosa, versicolour,
virginica. Write R code to show which flower specie has
shortest petal length. Discuss the result as an analysis in your
report. (Explanation with steps to do: Write R code to show
petal length of setosa, versicolour, virginica. Do not paste all
result in your report as it will be too long. Paste some of them
> tail(iris, 15)
Sepal.Length
Sepal.Width Petal.Length
Petal.Width Species
136 7.7 3.0
6.1 2.3 virginica
137 6.3 3.4
5.6 2.4 virginica
138 6.4 3.1
5.5 1.8 virginica
139 6.0 3.0
4.8 1.8 virginica
140 6.9 3.1
5.4 2.1 virginica
141 6.7 3.1
5.6 2.4 virginica
142 6.9 3.1
5.1 2.3 virginica
143 5.8 2.7
5.1 1.9 virginica
144 6.8 3.2
5.9 2.3 virginica
145 6.7 3.3
5.7 2.5 virginica
146 6.7 3.0
5.2 2.3 virginica
147 6.3 2.5
5.0 1.9 virginica
148 6.5 3.0
5.2 2.0 virginica
149 6.2 3.4
5.4 2.3 virginica
> virginica <- filter(iris,
Species == "virginica")
> head(virginica, n=10)
Sepal.Length
Sepal.Width Petal.Length
Petal.Width Species
1 6.3 3.3
6.0 2.5 virginica
2 5.8 2.7
5.1 1.9 virginica
3 7.1 3.0
5.9 2.1 virginica
4 6.3 2.9
5.6 1.8 virginica
5 6.5 3.0
5.8 2.2 virginica
6 7.6 3.0
6.6 2.1 virginica
7 4.9 2.5
4.5 1.7 virginica
8 7.3 2.9
6.3 1.8 virginica
9 6.7 2.5
5.8 1.8 virginica
10 7.2 3.6
6.1 2.5 virginica
⊘ This is a preview!⊘
Do you want full access?
Subscribe today to unlock all pages.

Trusted by 1+ million students worldwide

and you can write in the report how many records were shown. Next write R code to show
which flower specie has shortest petal length. Again for too long result only paste few records
retrieved. ) Discuss the result (how many records you retrieved) as an analysis in your report.
Answer
The codes to show the petal lengths of setosa, versicolour, virginica is shown below together
with the output
For the output we just presented the first 15 cases of
each and every flower species.
The code and the output for comparing the petal lengths
for the different flower species is given below;
As can be seen, Setosa species has the shortest petal length (M = 1.46) while Virginica has the
longest petal length (M = 5.55).
5. Write R code to create a new column that stores logical values for sepal.width greater than half
of sepal.length.
Answer
6. Write R code to generate summary of sepal length, sepal width,
petal length, and petal width. The summary should include
Minimum, Maximum, Mean, Median, Upper Quartile, and
Lower Quartile. Discuss the result as an analysis in your report.
You are required to interpret box plot. Box plot is a kind of
graph and is used to show the shape of the distribution, its
central value, and its variability. In a box plot: the ends of the
> new_column <-
mutate(iris, greater.half
= Sepal.Width > 0.5 *
Sepal.Length)
> head(new_column)
Sepal.Length
Sepal.Width Petal.Length
Petal.Width Species
greater.half
1 5.1 3.5
1.4 0.2 setosa
TRUE
2 4.9 3.0
1.4 0.2 setosa
TRUE
3 4.7 3.2
1.3 0.2 setosa
TRUE
4 4.6 3.1
> irissetosa <-
subset(iris$Petal.Length,
Species == "setosa")
> head(irissetosa, n=15)
[1] 1.4 1.4 1.3 1.5 1.4
1.7 1.4 1.5 1.4 1.5 1.5
1.6 1.4 1.1 1.2
>
> irisVer <-
subset(iris$Petal.Length,
Species == "versicolor")
> head(irisVer, n=15)
[1] 4.7 4.5 4.9 4.0 4.6
4.5 4.7 3.3 4.6 3.9 3.5
4.2 4.0 4.7 3.6
>
> irisVir <-
subset(iris$Petal.Length,
Species == "virginica")
> head(irisVir, n=15)
[1] 6.0 5.1 5.9 5.6 5.8
6.6 4.5 6.3 5.8 6.1 5.1
5.3 5.5 5.0 5.1
> mean(irissetosa)
[1] 1.462
> mean(irisVer)
[1] 4.26
> mean(irisVir)
[1] 5.552
Paraphrase This Document
Need a fresh take? Get an instant paraphrase of this document with our AI Paraphraser

box are the upper and lower quartiles, so the box spans the interquartile range. The median is
marked by a vertical line inside the box.
Answer
The summary results in the table above shows that
the average sepal length is 5.84 with a medium length
of 5.80. The median and the mean for the sepal length
are close to each suggesting that the distribution is
close to normal for the sepal length. For the sepal
width, petal length and petal width we can see there
are some slight variations in the mean and the median
values suggesting some kind of skewness in those
variables.
> summary(iris)
Sepal.Length
Sepal.Width
Petal.Length
Petal.Width
Min. :4.300
Min. :2.000
Min. :1.000
Min. :0.100
1st Qu.:5.100 1st
Qu.:2.800 1st Qu.:1.600
1st Qu.:0.300
Median :5.800
Median :3.000
Median :4.350
Median :1.300
Mean :5.843
Mean :3.057
Mean :3.758
Mean :1.199
3rd Qu.:6.400 3rd
Qu.:3.300 3rd Qu.:5.100
3rd Qu.:1.800
Max. :7.900
Max. :4.400
Max. :6.900
Max. :2.500

The above four boxplots represents the various variables. The boxplot for the sepal length
shows that the data is close to normal distribution while the petal length and petal width are
heavily skewed (left skewed).
7. Dataset has labels for each class. Write R code to generate boxplot to see the distribution of the
values considering each class (setosa, versicolour, virginica). Discuss the result as an analysis in
your report.
Answer
boxplot(Sepal.Length~Species, main="Boxplot for Sepal Length",
col="aquamarine", data=iris)
The boxplot above shows that the sepal length for the three different species vary in terms of
distribution. For the setosa, we can see the distribution to be almost normally distributed while
for the versicolor and virginica, we can see a slight skewness.
⊘ This is a preview!⊘
Do you want full access?
Subscribe today to unlock all pages.

Trusted by 1+ million students worldwide

boxplot(Sepal.Width~Species, main="Boxplot for Sepal Width",
col="cornsilk", data=iris)
The boxplot above shows that the sepal width for the three different species vary in terms of
distribution. For the virginica, we can see the distribution to be almost normally distributed
while for the versicolor and setosa, we can see a slight skewness.
boxplot(Petal.Length~Species, main="Boxplot for Petal Length",
col="darkorange", data=iris)
The boxplot above shows that the petal length for the three different species vary in terms of
distribution. For the setosa, we can see the distribution to be almost normally distributed while
for the versicolor and virginica, we can see a slight skewness.
boxplot(Petal.Width~Species, main="Boxplot for Petal Width",
Paraphrase This Document
Need a fresh take? Get an instant paraphrase of this document with our AI Paraphraser

col="darkolivegreen1", data=iris)
The boxplot above shows that the petal width for the three different species. As can be seen,
the three species seem to not follow a normal distribution based on the looks of the boxplot.
8. Write R code to generate Histogram of Iris petal length. Discuss the result as an analysis in your
report.
Answer
hist(iris$Petal.Length, main="Histogram for Petal Length",
xlab="Petal Length", col="darkorange")
The above histogram shows that the data on petal length is not normally distributed (since it
doesn’t have a bell-shaped curve) but rather skewed.
9. Write R code to generate Scatter Graph of Iris Sepal Width versus Sepal Length by Species.
Discuss the result as an analysis in your report.
Answer

The above figure presents a scatter plot of petal width versus petal length. It is clear from the
figure that a positive linear relationship exists between the two variables (petal width and petal
length) and this applies for the different species.
10. Write R code to generate violin plot for Iris summary statistics. Use library (vioplot). A violin plot
is a method of plotting numeric data. A Violin Plot is used to visualise the distribution of the data
and its probability density. This chart is a combination of a Box Plot and a Density Plot that is
rotated and placed on each side, to show the distribution shape of the data.
Answer
The above Violin Boxplot of the different Species clearly shows that Virginica species has highest
median value in relation to the sepal length, the petal width and the petal length when
compared against the Setosa and Versicolor species. In terms of the sepal width, the Setosa
species has the highest median value.
⊘ This is a preview!⊘
Do you want full access?
Subscribe today to unlock all pages.

Trusted by 1+ million students worldwide

11. Write R code to generate Scatterplot to see correlation for the variables for each different class.
How one variable compares to others? Are these variables correlated? +1 means variables are
correlated, -1 inversely correlated.
Answer
From the table above, we can see that a strong
positive relationship exists between the petal width
and the petal length (r = .963), there is also a strong
positive relationship between sepal length and the
petal length (r = .872). Another strong positive
relationship exists between sepal length and petal
width (r = .818). There is however, a weak negative
relationship between sepal length and sepal width (r
=-.118), a weak negative relationship between sepal width and petal width (r =-.366) and
another weak negative relationship between sepal width and petal length (r =-.428).
The scatter plot above further confirms the relationship status mentioned above.
12. Write R code to apply different colour to different classes in Scatterplot.
Answer
The plot below gives a scatter plot with different colour to different classes.
> corr <- cor(iris[,1:4])
> round(corr,3)
Sepal.Length
Sepal.Width Petal.Length
Petal.Width
Sepal.Length 1.000
-0.118 0.872
0.818
Sepal.Width -0.118
1.000 -0.428 -
0.366
Petal.Length 0.872
-0.428 1.000
0.963
Petal.Width 0.818
-0.366 0.963
1.000
Paraphrase This Document
Need a fresh take? Get an instant paraphrase of this document with our AI Paraphraser


Screenshots
Question 1
Question 2
Question 1
Question 2
⊘ This is a preview!⊘
Do you want full access?
Subscribe today to unlock all pages.

Trusted by 1+ million students worldwide
1 out of 20
Related Documents

Your All-in-One AI-Powered Toolkit for Academic Success.
+13062052269
info@desklib.com
Available 24*7 on WhatsApp / Email
Unlock your academic potential
Copyright © 2020–2025 A2Z Services. All Rights Reserved. Developed and managed by ZUCOL.