30113 Programming for Data Science Assignment: Airline Analysis

Verified

Added on  2023/04/07

|8
|1000
|439
Homework Assignment
AI Summary
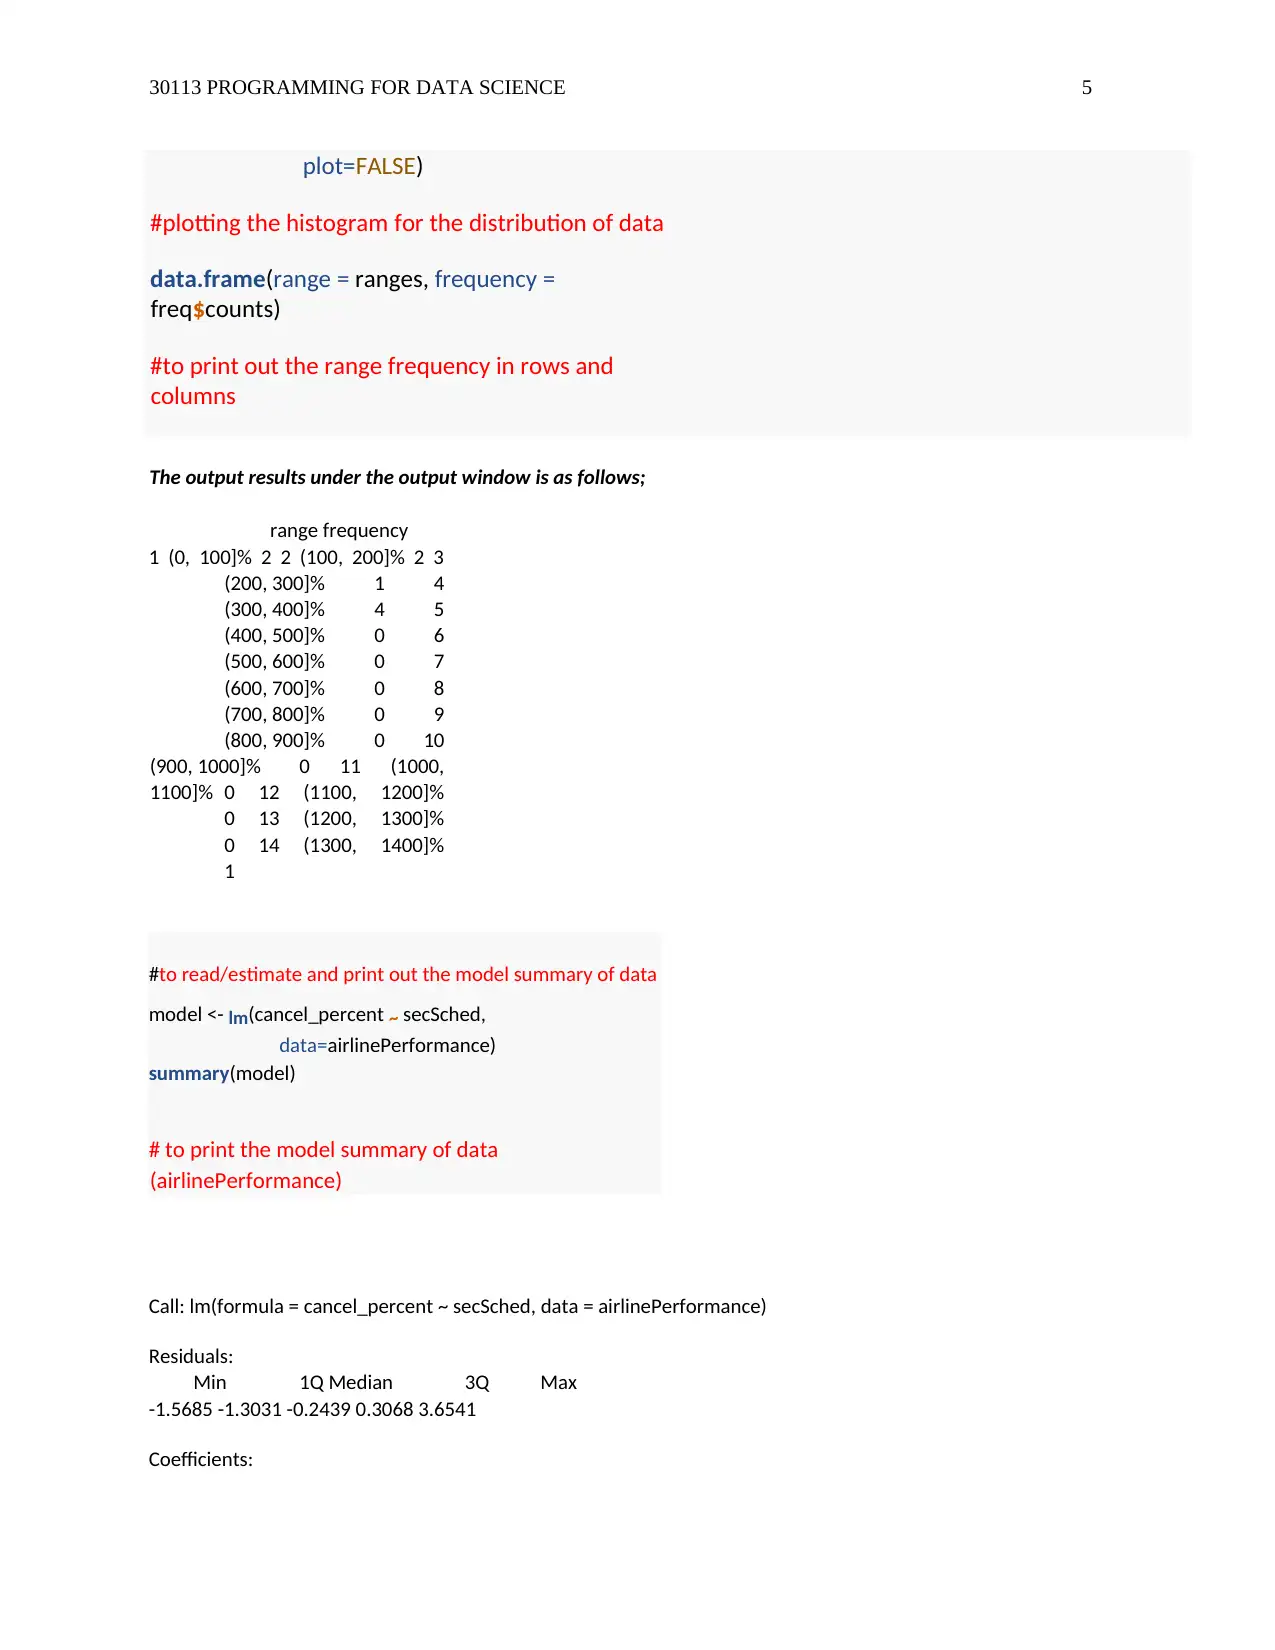
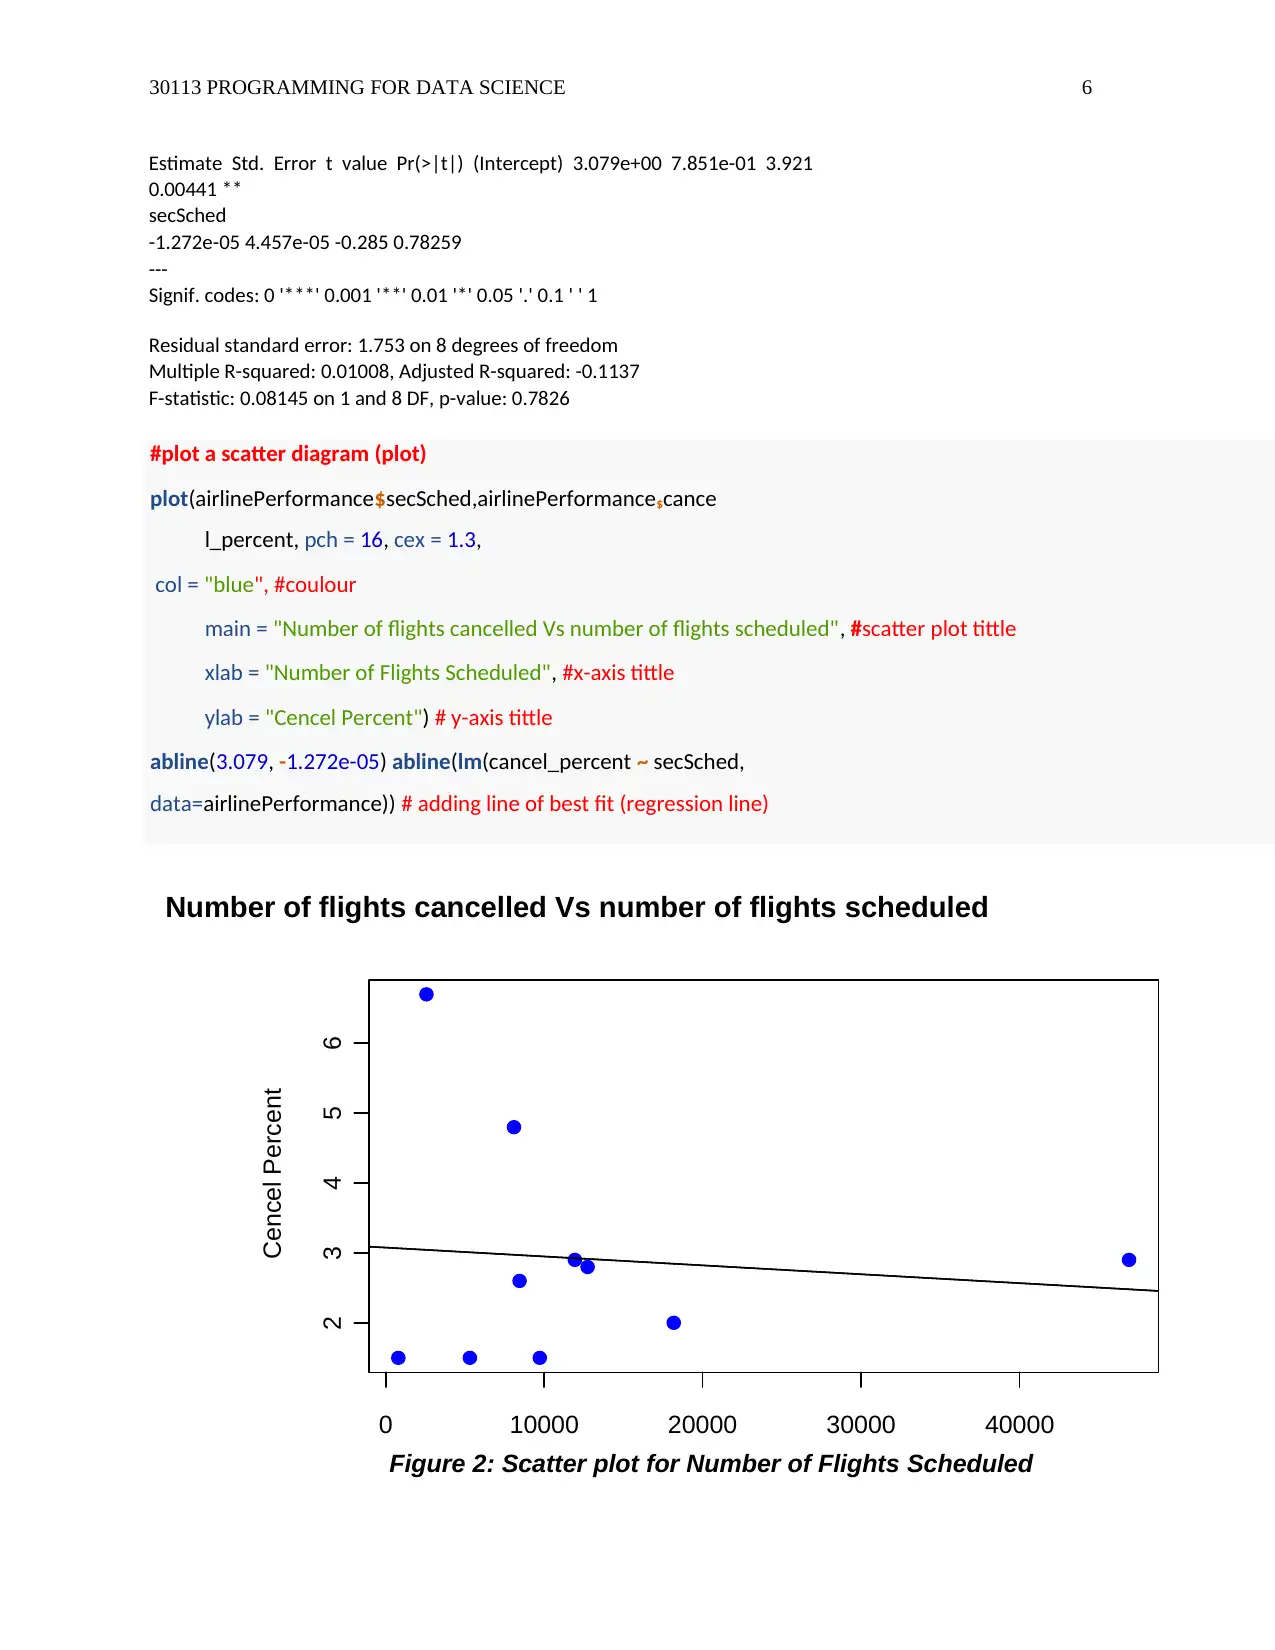
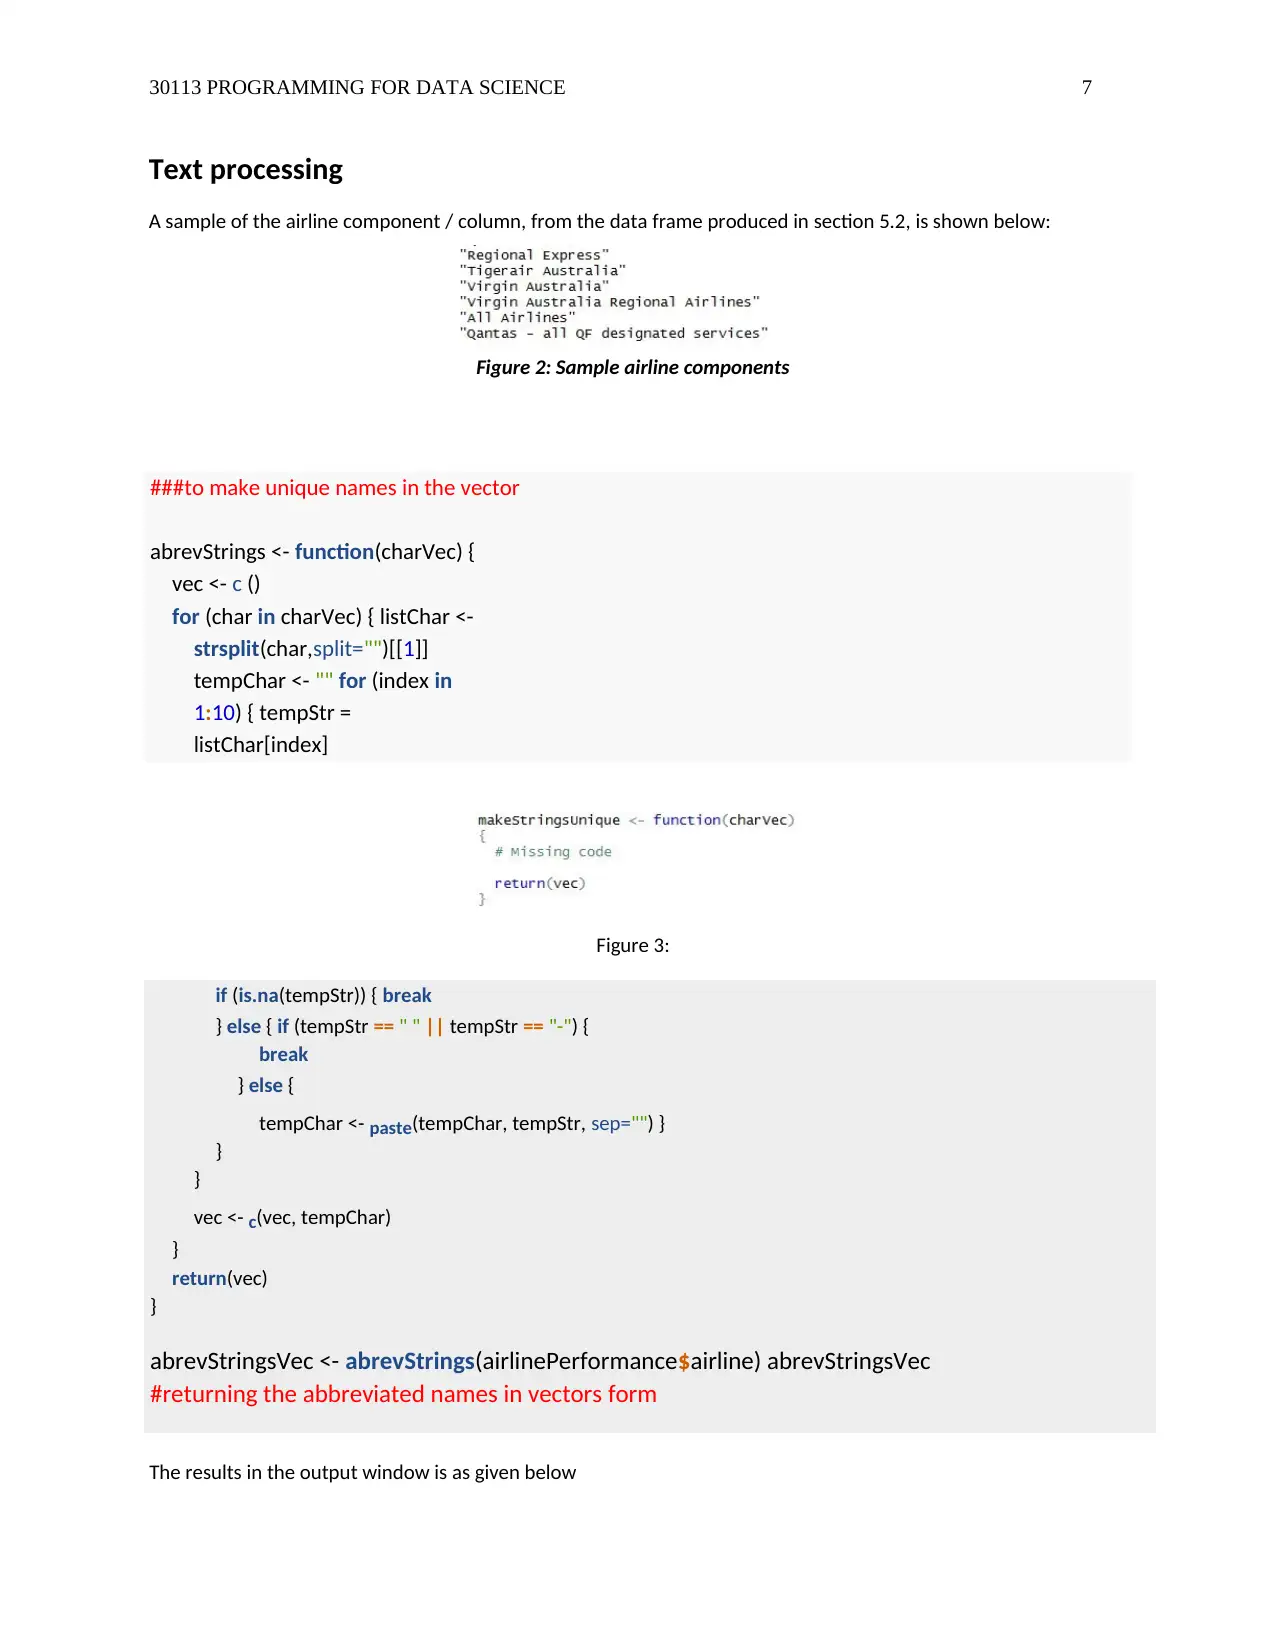
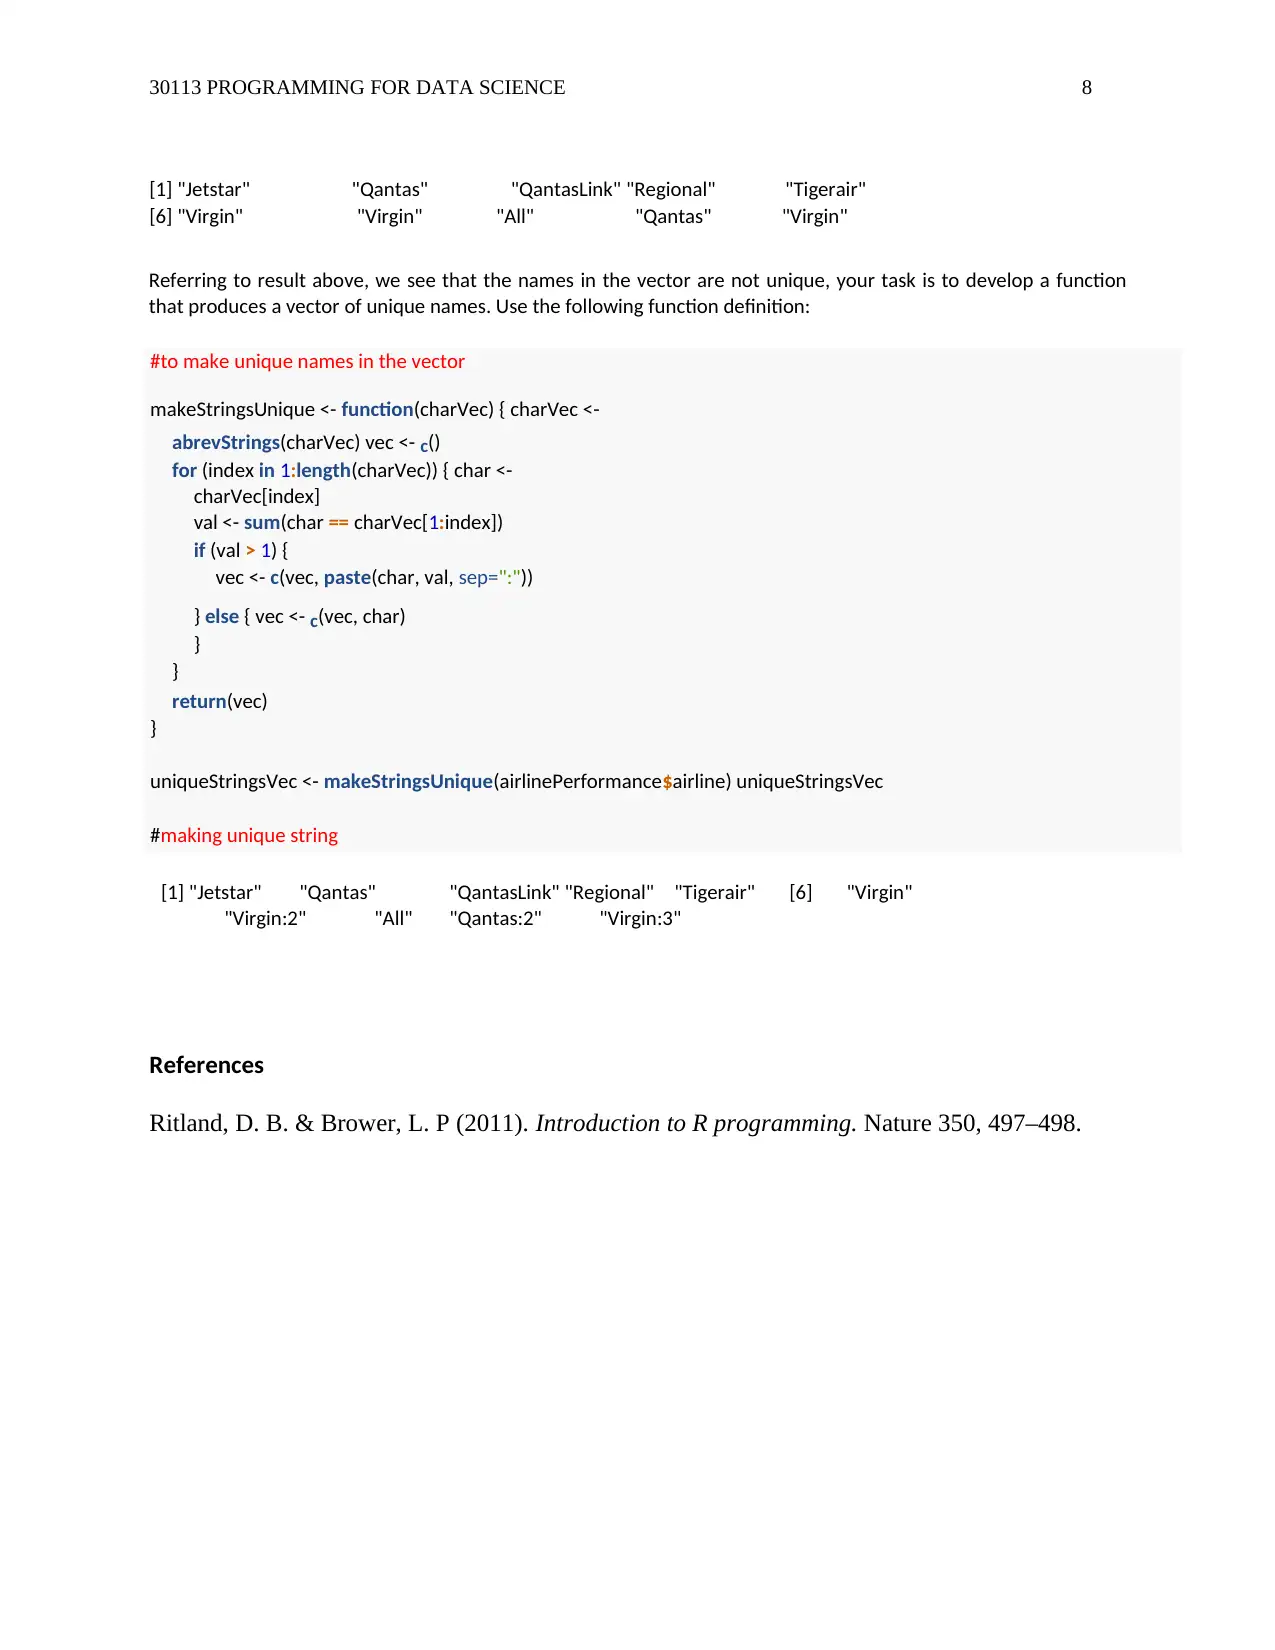
This assignment solution addresses a data science problem involving airline performance analysis using R programming. The solution begins with loading and cleaning the provided airline performance data, handling missing values and negative numeric data. It then performs basic analysis, including calculating key performance indicators like cancellation, arrival on time, and departure on time percentages, as well as generating summaries and histograms. A linear regression model is built to analyze the relationship between scheduled flights and cancellation percentages, and a scatter plot visualizes this relationship. The assignment concludes with text processing to create unique airline names, demonstrating the ability to manipulate and analyze textual data within the dataset. The code is well-commented and structured, providing a comprehensive understanding of the data science workflow.
Document Page
30113 PROGRAMMING FOR DATA SCIENCE 1
Assignment Summer 2019
301113 Programming for Data Science
28 February 2019
tabler-icon-diamond-filled.svg

Secure Best Marks with AI Grader

Need help grading? Try our AI Grader for instant feedback on your assignments.
Document Page
30113 PROGRAMMING FOR DATA SCIENCE 2
Using the data files provided, you are to answer the following four questions. Show all R code that you develop,
also show any R code that you developed for any other tasks, for example, testing. Mark all code with appropriate
comments, for instance
This code tests the following operation ...
Load data and perform initial cleaning
#importing/loading the data into R workspace
airlinePerformance <- read.csv('airlinePerformance.csv', na.strings= c (""," ","NA"),
header=FALSE)
headers <- read.csv('headers.csv', header=FALSE)
#The header is set to FALSE since the data set does not have any header
Building a single data frame where column titles are sourced from the first row of headers.csv and the body of the
dataset is sourced from airlinePerformance.csv. Also removing any trailing whitespace in any textual field using
trimws function.
colnames(airlinePerformance) <- trimws(as.character.POSIXt(unname(headers[1,])))
airlinePerformance$airline <-
#building a single data frame with column titles sourced from the first row and the body of data
set is sourced from airlinePerformance.csv
trimws(airlinePerformance$airline)
## Removing trailing whitespace in any textual field
remove.missing.data <- function(data){
# #Removal of missing data
complete <- data[complete.cases(data), ] issues <-
data[!complete.cases(data), ] return
(list(complete, issues))
}
#print and return logical vector indicating
complete cases
data <- remove.missing.data(airlinePerformance)
airlinePerformance <- data[[1]] issues_5.1 <-
data[[2]]
Document Page
30113 PROGRAMMING FOR DATA SCIENCE 3
#removing missing issues with complete cases in
data
remove.negative.data <- function(data){ numeric.data <-
data[,unlist(lapply(data, is.numeric))] positive <-
data[rowSums(numeric.data<0)==0,] issues <-
data[rowSums(numeric.data<0)!=0,] return (list(positive, issues))
#print sum of each row of the numeric data frame
} data <- remove.negative.data(airlinePerformance)
airlinePerformance
#Removing negative values which are numeric in the data
<- data[[1]] issues_5.1 <- rbind(issues_5.1, data[[2]])
#binding the data frame by rows
Final data cleaning
# to convert the factors into numeric vector the function “as.numeric”
is used the coding
cleaning.data <- function(airline){ to.remove <-
as.numeric(airline$secSched < airline$secFlown) +
as.numeric(airline$secFlown
< airline$aot) +
as.numeric(airline$aot_percent
!= round((airline$aot/airline$secFlown)*100, 1)) +
as.numeric(airline$secFlown
< airline$dot) +
as.numeric(airline$dot_percent
!= round((airline$dot/airline$secFlown)*100, 1)) +
Document Page
30113 PROGRAMMING FOR DATA SCIENCE 4
as.numeric(airline$secSched
< airline$cancel) +
as.numeric(airline$secSched
airline$secFlown
!= airline$cancel) +
as.numeric(airline$cancel_percent
!= round((airline$cancel/airline$secSched)*100, 1))
correct <- airline[to.remove == 0,] issues <- airline[to.remove !=
0,] return (list(correct, issues))
}
data <- cleaning.data(airlinePerformance) airlinePerformance <- data[[1]]
## to return the numeric codes that corresponds to the factor levels
Figure 1:
issues_5.2 <- data[[2]]
Basic analysis and summaries
perf <- airlinePerformance[, c ('airline',
'cancel_percent', 'aot_percent',
'dot_percent')]
attach(perf)
perf_inc <- perf[order(cancel_percent, aot_percent, dot_percent),][1:3,] perf_dec <- perf[order(-
cancel_percent, -aot_percent, -dot_percent),][1:3,]
br <- seq(0,1400,by=100)
#to print/read the range from 0 to 1400 by interval of 100
ranges <- paste('(',head(br,-1),', ', br[-1], ']%', sep="")
#to read/print the range of values when
freq <- hist(airlinePerformance$cancel,
breaks=br, include.lowest=TRUE,
tabler-icon-diamond-filled.svg

Secure Best Marks with AI Grader

Need help grading? Try our AI Grader for instant feedback on your assignments.
Document Page
30113 PROGRAMMING FOR DATA SCIENCE 5
plot=FALSE)
#plotting the histogram for the distribution of data
data.frame(range = ranges, frequency =
freq$counts)
#to print out the range frequency in rows and
columns
The output results under the output window is as follows;
range frequency
1 (0, 100]% 2 2 (100, 200]% 2 3
(200, 300]% 1 4
(300, 400]% 4 5
(400, 500]% 0 6
(500, 600]% 0 7
(600, 700]% 0 8
(700, 800]% 0 9
(800, 900]% 0 10
(900, 1000]% 0 11 (1000,
1100]% 0 12 (1100, 1200]%
0 13 (1200, 1300]%
0 14 (1300, 1400]%
1
#to read/estimate and print out the model summary of data
model <- lm(cancel_percent ~ secSched,
data=airlinePerformance)
summary(model)
# to print the model summary of data
(airlinePerformance)
Call: lm(formula = cancel_percent ~ secSched, data = airlinePerformance)
Residuals:
Min 1Q Median 3Q Max
-1.5685 -1.3031 -0.2439 0.3068 3.6541
Coefficients:
Document Page
30113 PROGRAMMING FOR DATA SCIENCE 6
Estimate Std. Error t value Pr(>|t|) (Intercept) 3.079e+00 7.851e-01 3.921
0.00441 **
secSched
-1.272e-05 4.457e-05 -0.285 0.78259
---
Signif. codes: 0 '***' 0.001 '**' 0.01 '*' 0.05 '.' 0.1 ' ' 1
Residual standard error: 1.753 on 8 degrees of freedom
Multiple R-squared: 0.01008, Adjusted R-squared: -0.1137
F-statistic: 0.08145 on 1 and 8 DF, p-value: 0.7826
#plot a scatter diagram (plot)
plot(airlinePerformance$secSched,airlinePerformance$cance
l_percent, pch = 16, cex = 1.3,
col = "blue", #coulour
main = "Number of flights cancelled Vs number of flights scheduled", #scatter plot tittle
xlab = "Number of Flights Scheduled", #x-axis tittle
ylab = "Cencel Percent") # y-axis tittle
abline(3.079, -1.272e-05) abline(lm(cancel_percent ~ secSched,
data=airlinePerformance)) # adding line of best fit (regression line)
Number of flights cancelled Vs number of flights scheduled
Figure 2: Scatter plot for Number of Flights Scheduled
0 10000 20000 30000 40000
2 3 4 5 6
Cencel Percent
Document Page
30113 PROGRAMMING FOR DATA SCIENCE 7
Text processing
A sample of the airline component / column, from the data frame produced in section 5.2, is shown below:
Figure 2: Sample airline components
###to make unique names in the vector
abrevStrings <- function(charVec) {
vec <- c ()
for (char in charVec) { listChar <-
strsplit(char,split="")[[1]]
tempChar <- "" for (index in
1:10) { tempStr =
listChar[index]
Figure 3:
if (is.na(tempStr)) { break
} else { if (tempStr == " " || tempStr == "-") {
break
} else {
tempChar <- paste(tempChar, tempStr, sep="") }
}
}
vec <- c(vec, tempChar)
}
return(vec)
}
abrevStringsVec <- abrevStrings(airlinePerformance$airline) abrevStringsVec
#returning the abbreviated names in vectors form
The results in the output window is as given below
tabler-icon-diamond-filled.svg

Paraphrase This Document

Need a fresh take? Get an instant paraphrase of this document with our AI Paraphraser
Document Page
30113 PROGRAMMING FOR DATA SCIENCE 8
[1] "Jetstar" "Qantas" "QantasLink" "Regional" "Tigerair"
[6] "Virgin" "Virgin" "All" "Qantas" "Virgin"
Referring to result above, we see that the names in the vector are not unique, your task is to develop a function
that produces a vector of unique names. Use the following function definition:
#to make unique names in the vector
makeStringsUnique <- function(charVec) { charVec <-
abrevStrings(charVec) vec <- c()
for (index in 1:length(charVec)) { char <-
charVec[index]
val <- sum(char == charVec[1:index])
if (val > 1) {
vec <- c(vec, paste(char, val, sep=":"))
} else { vec <- c(vec, char)
}
}
return(vec)
}
uniqueStringsVec <- makeStringsUnique(airlinePerformance$airline) uniqueStringsVec
#making unique string
[1] "Jetstar" "Qantas" "QantasLink" "Regional" "Tigerair" [6] "Virgin"
"Virgin:2" "All" "Qantas:2" "Virgin:3"
References
Ritland, D. B. & Brower, L. P (2011). Introduction to R programming. Nature 350, 497–498.
chevron_up_icon
1 out of 8
circle_padding
hide_on_mobile
zoom_out_icon
logo.png

Your All-in-One AI-Powered Toolkit for Academic Success.

Available 24*7 on WhatsApp / Email

[object Object]