Verdilan Horticulture: Flower Classification Analysis
VerifiedAdded on 2022/10/10
|12
|2120
|88
Report
AI Summary
This report assesses the application of data science principles to flower classification for Verdilan Horticulture, a business dealing with a large number of operations. The study proposes a flower classification model based on the kNN algorithm, utilizing Excel's xlstat add-in. The investigation involved importing data, conducting kNN classification, and evaluating the results. The analysis used a dataset of 150 records with 4 variables to classify Iris flowers, achieving an error rate of 0.058. The report discusses data integrity, security considerations, and suggests integrating a data warehouse and exploring other classification models like Naïve Bayes, Support Vector Machines, and Random Forests. The report also provides an overview of the kNN model, error rates, and potential future hypotheses for predictive analytics, emphasizing the importance of data collection, model evaluation, and the selection of appropriate machine learning tools for business decision-making.
1
RUNNINGHEAD: Principles of Data Science for Business
1. Assessment of Verdilan Horticulture Outline
In an ideal business setting, especially one that deals with a large number of operations such as
that of Verdilan Horticulture, it is often quite crucial that business activities are conducted with
adequate precision and with as much autonomy as possible. The advent of data collection and
introduction of data science into the modern day business practices have set a foundation and an
ultimate way that autonomy and precision can be based on thus improving the overall business
performance.
Flower Classification
The overall business objective of this paper is to propose a feasible flower classification based on
the original paper by Fisher in 1936. Hence, it will use a similar dataset obtained from
https://www.kaggle.com/abhijeetupadhyay/classifying-flowers-using-kNN. (Guru, et al., 2010)
In particular, the paper will use Excel’s xlstat add-in to conduct kNN classification of the
flowers.
2. Overview of Investigation
Our investigation follows the process of importing of data into the analysis environment before
drawing any insights regarding the results obtained. Since one of the main objectives was to
evaluate whether excel can be used as a classification tool, after some research, we found
XLSTAT ™ which is an excel add-in useful for statistical analysis including machine learning
which is classified under data science.
When implementing the kNN algorithm, a cross validation option was adopted which enables us
to train several models (in our case several kNN models) this has the potential of preventing
overfitting thus increasing the accuracy of the model.
3. Results of Analysis
Our objective is to evaluate the feasibility of flower classification as a means to base the firm’s
decisions as whether to repeat orders or not. To this end, we used a dataset of size 150 which
includes 4 variables. After our analysis, we obtained the following results:
Paraphrase This Document
Need a fresh take? Get an instant paraphrase of this document with our AI Paraphraser
2
Principles of Data Science for Business
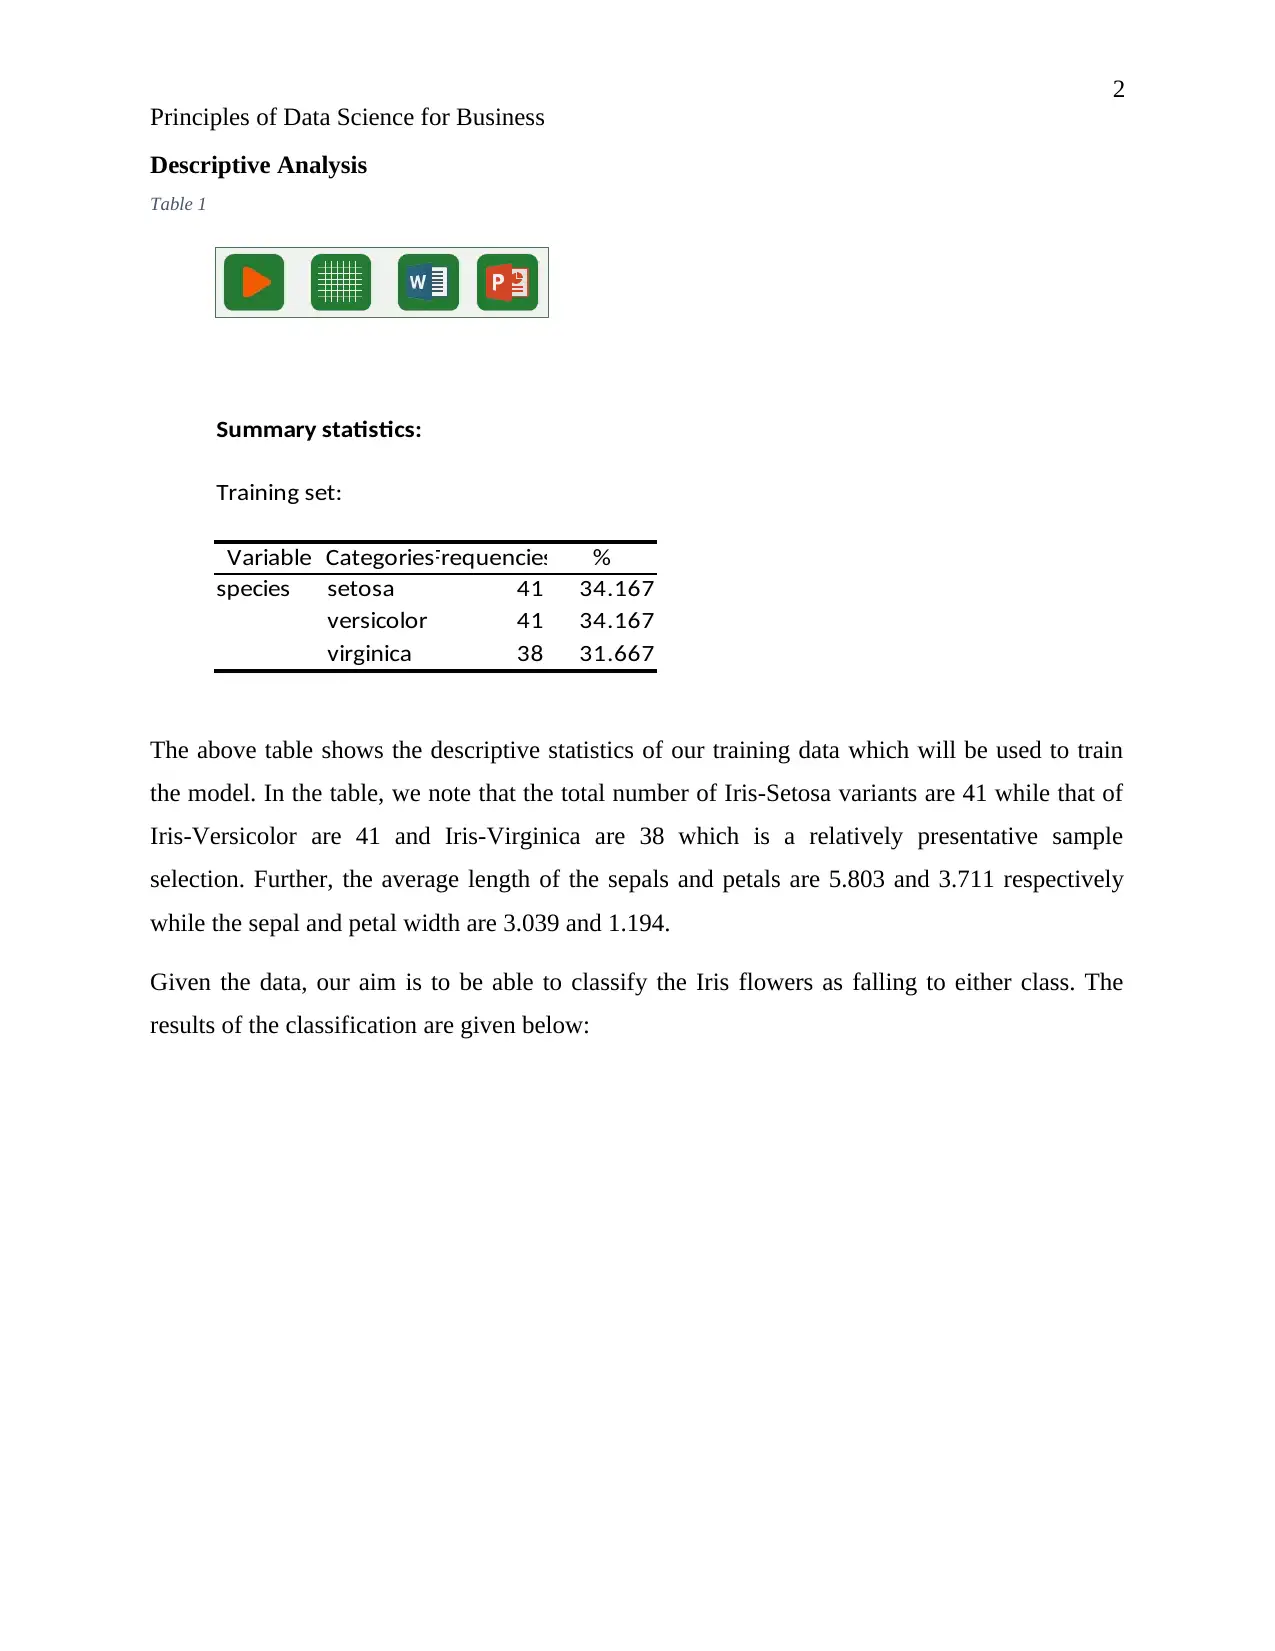
Descriptive Analysis
Table 1
Summary statistics:
Training set:
Variable CategoriesFrequencies %
species setosa 41 34.167
versicolor 41 34.167
virginica 38 31.667
The above table shows the descriptive statistics of our training data which will be used to train
the model. In the table, we note that the total number of Iris-Setosa variants are 41 while that of
Iris-Versicolor are 41 and Iris-Virginica are 38 which is a relatively presentative sample
selection. Further, the average length of the sepals and petals are 5.803 and 3.711 respectively
while the sepal and petal width are 3.039 and 1.194.
Given the data, our aim is to be able to classify the Iris flowers as falling to either class. The
results of the classification are given below:
Principles of Data Science for Business
Descriptive Analysis
Table 1
Summary statistics:
Training set:
Variable CategoriesFrequencies %
species setosa 41 34.167
versicolor 41 34.167
virginica 38 31.667
The above table shows the descriptive statistics of our training data which will be used to train
the model. In the table, we note that the total number of Iris-Setosa variants are 41 while that of
Iris-Versicolor are 41 and Iris-Virginica are 38 which is a relatively presentative sample
selection. Further, the average length of the sepals and petals are 5.803 and 3.711 respectively
while the sepal and petal width are 3.039 and 1.194.
Given the data, our aim is to be able to classify the Iris flowers as falling to either class. The
results of the classification are given below:
3
Principles of Data Science for Business
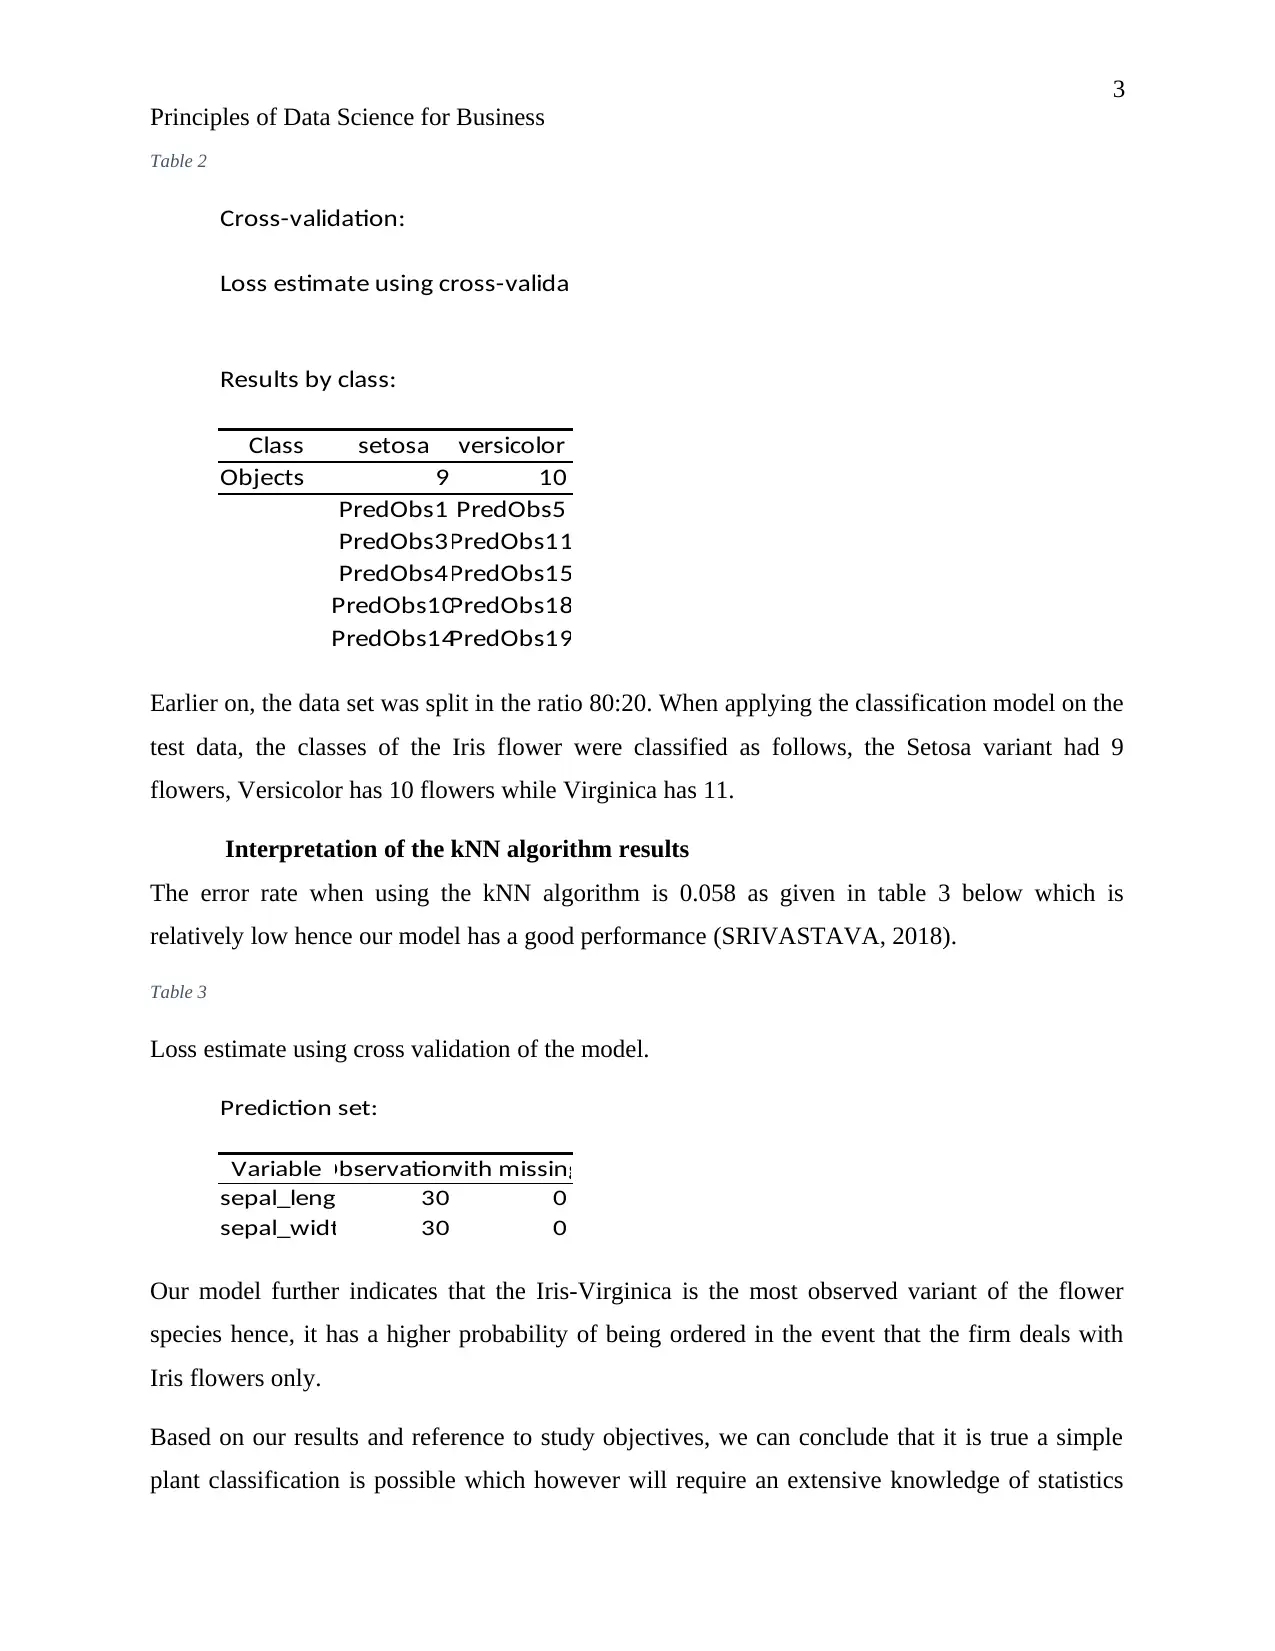
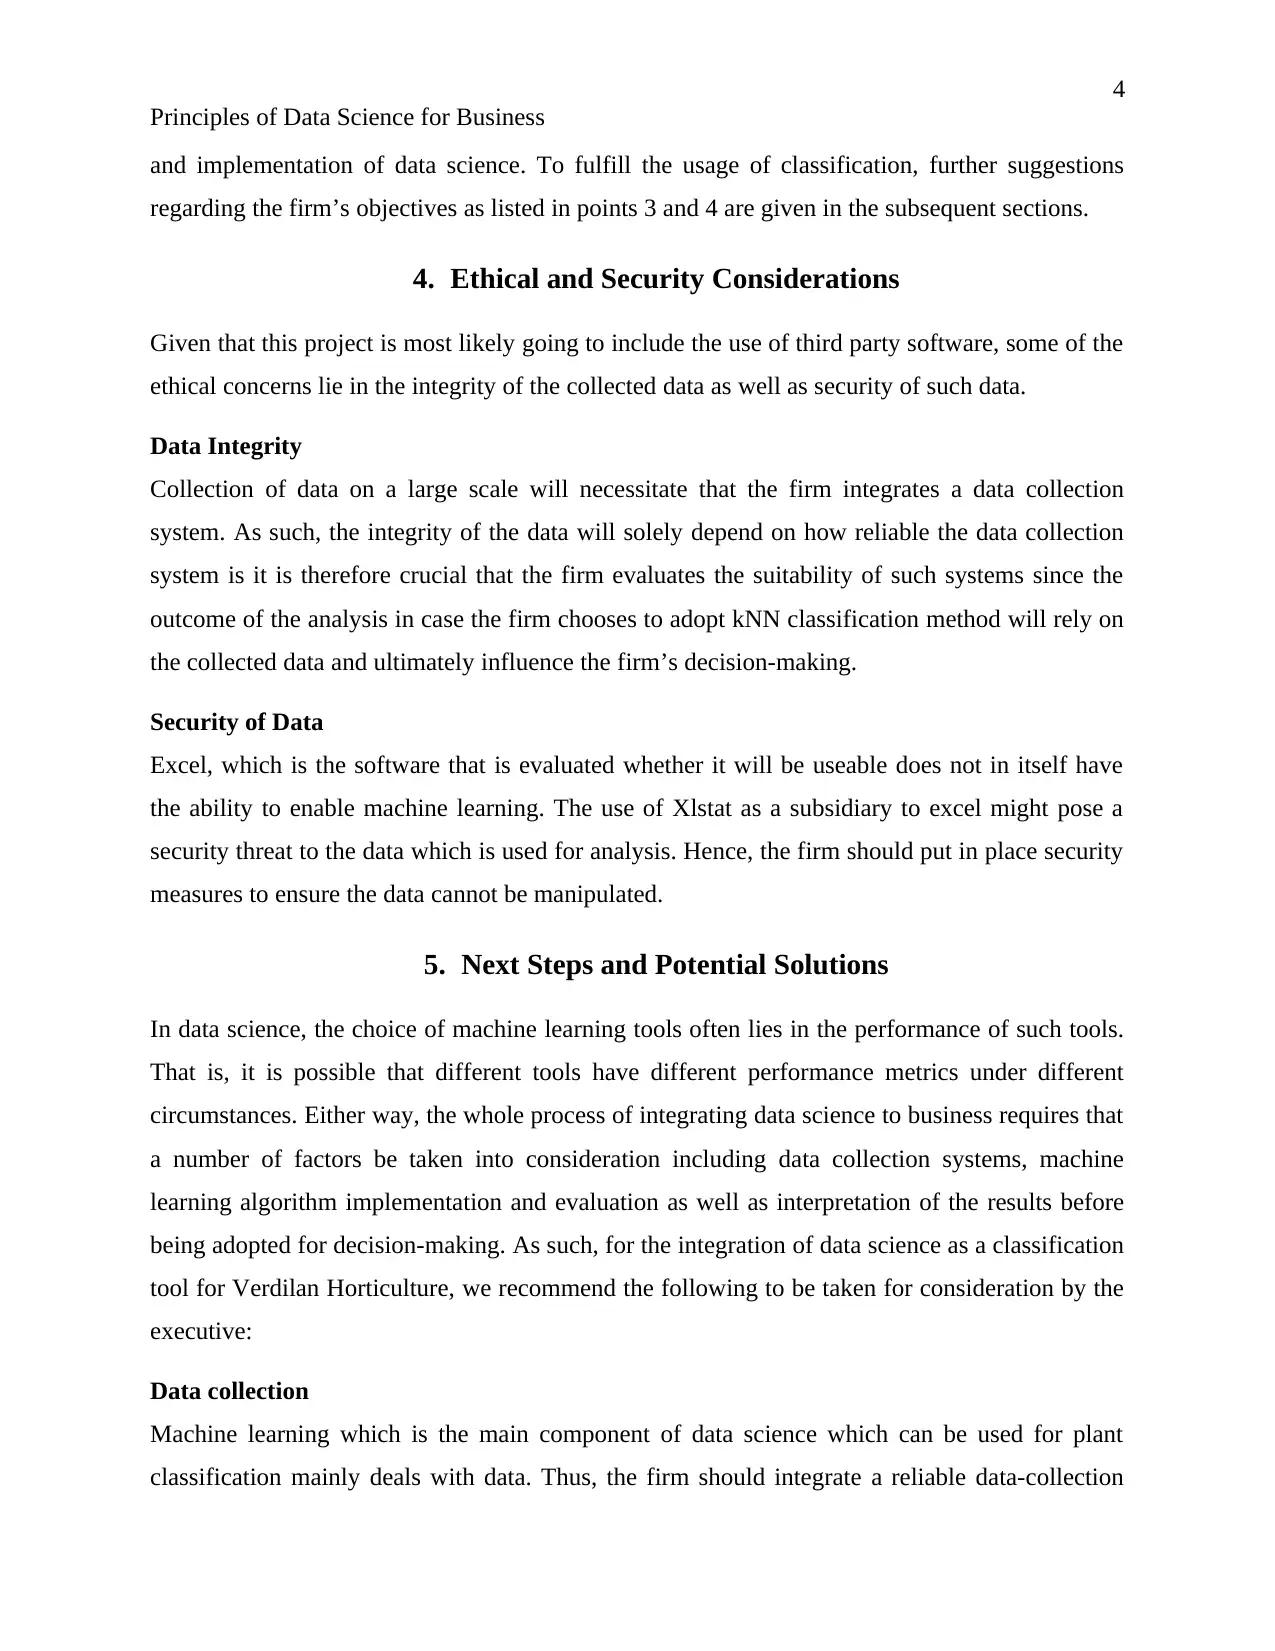
Table 2
Cross-validation:
Loss estimate using cross-valida
Results by class:
Class setosa versicolor
Objects 9 10
PredObs1 PredObs5
PredObs3PredObs11
PredObs4PredObs15
PredObs10PredObs18
PredObs14PredObs19
Earlier on, the data set was split in the ratio 80:20. When applying the classification model on the
test data, the classes of the Iris flower were classified as follows, the Setosa variant had 9
flowers, Versicolor has 10 flowers while Virginica has 11.
Interpretation of the kNN algorithm results
The error rate when using the kNN algorithm is 0.058 as given in table 3 below which is
relatively low hence our model has a good performance (SRIVASTAVA, 2018).
Table 3
Loss estimate using cross validation of the model.
Prediction set:
VariableObservationsObs. with missing data
sepal_leng 30 0
sepal_widt 30 0
Our model further indicates that the Iris-Virginica is the most observed variant of the flower
species hence, it has a higher probability of being ordered in the event that the firm deals with
Iris flowers only.
Based on our results and reference to study objectives, we can conclude that it is true a simple
plant classification is possible which however will require an extensive knowledge of statistics
Principles of Data Science for Business
Table 2
Cross-validation:
Loss estimate using cross-valida
Results by class:
Class setosa versicolor
Objects 9 10
PredObs1 PredObs5
PredObs3PredObs11
PredObs4PredObs15
PredObs10PredObs18
PredObs14PredObs19
Earlier on, the data set was split in the ratio 80:20. When applying the classification model on the
test data, the classes of the Iris flower were classified as follows, the Setosa variant had 9
flowers, Versicolor has 10 flowers while Virginica has 11.
Interpretation of the kNN algorithm results
The error rate when using the kNN algorithm is 0.058 as given in table 3 below which is
relatively low hence our model has a good performance (SRIVASTAVA, 2018).
Table 3
Loss estimate using cross validation of the model.
Prediction set:
VariableObservationsObs. with missing data
sepal_leng 30 0
sepal_widt 30 0
Our model further indicates that the Iris-Virginica is the most observed variant of the flower
species hence, it has a higher probability of being ordered in the event that the firm deals with
Iris flowers only.
Based on our results and reference to study objectives, we can conclude that it is true a simple
plant classification is possible which however will require an extensive knowledge of statistics
⊘ This is a preview!⊘
Do you want full access?
Subscribe today to unlock all pages.
Trusted by 1+ million students worldwide
4
Principles of Data Science for Business
and implementation of data science. To fulfill the usage of classification, further suggestions
regarding the firm’s objectives as listed in points 3 and 4 are given in the subsequent sections.
4. Ethical and Security Considerations
Given that this project is most likely going to include the use of third party software, some of the
ethical concerns lie in the integrity of the collected data as well as security of such data.
Data Integrity
Collection of data on a large scale will necessitate that the firm integrates a data collection
system. As such, the integrity of the data will solely depend on how reliable the data collection
system is it is therefore crucial that the firm evaluates the suitability of such systems since the
outcome of the analysis in case the firm chooses to adopt kNN classification method will rely on
the collected data and ultimately influence the firm’s decision-making.
Security of Data
Excel, which is the software that is evaluated whether it will be useable does not in itself have
the ability to enable machine learning. The use of Xlstat as a subsidiary to excel might pose a
security threat to the data which is used for analysis. Hence, the firm should put in place security
measures to ensure the data cannot be manipulated.
5. Next Steps and Potential Solutions
In data science, the choice of machine learning tools often lies in the performance of such tools.
That is, it is possible that different tools have different performance metrics under different
circumstances. Either way, the whole process of integrating data science to business requires that
a number of factors be taken into consideration including data collection systems, machine
learning algorithm implementation and evaluation as well as interpretation of the results before
being adopted for decision-making. As such, for the integration of data science as a classification
tool for Verdilan Horticulture, we recommend the following to be taken for consideration by the
executive:
Data collection
Machine learning which is the main component of data science which can be used for plant
classification mainly deals with data. Thus, the firm should integrate a reliable data-collection
Paraphrase This Document
Need a fresh take? Get an instant paraphrase of this document with our AI Paraphraser
5
Principles of Data Science for Business
tool which will be solely concerned with observing the features required for feeding the machine
learning algorithm. One suggestion is to develop a data warehouse. In particular, a data
warehouse will enable easy retrieval and storage of the firm’s data. On the role a data warehouse
by Herzing university (2019) notes that, “…Data warehouse platforms store historical
information, making it easier for business leaders to analyze data over a specific period of time”.
(Herzing University, 2019). However, the integration of data warehouses as data collection and
storage systems have a relative cost to it hence it is prudent that the firm conducts a
reconnaissance of the most cost-effective system before adopting one.
Model Evaluation
kNN model in itself might prove useful in this scenario but might underperform in different
scenarios. It is therefore advisable that during implementation the firm considers other
classification models such as Naïve Bayes, Support vector machines and Random forests. The
firm can also use ensemble models if it proves that the performance of the models works better
under ensemble. For instance, Random forest have been proven to have a relatively high
performance (Stefania, 2013).
As an alternative to kNN, we suggest a Random forest classifier which is an ensemble learning
method i.e. uses multiple algorithms hence have a higher probability to achieve better
performance and accuracy (Painsky & Rosset, 2017).
Machine Learning Platform/Software
In practice, the use of XlSTAT ™ is fairly straight forward but requires the purchase of a license
before it is fully utilized. However, the firm can consider using other platforms such as python
and R which are proven to be useful in data science which nevertheless require that persons with
related expertise be hired.
6. Annex: Statistics and Methodology
Annexure 1
Model
The paper utilized a kNN model which is essentially a, “…non-parametric method used for
classification and regression” (Altman, 2012). The statistical setting follows the assumption that,
6
Principles of Data Science for Business
if we are given pairs (X1, Y1), (X2, Y2), …, (Xn,Yn) then the kNN algorithm is defined in such a
way that when training, only feature samples and class samples are stored. During classification,
we select k which is unlabeled so that it can be, “classified by assigning the label which is most
frequent among the k training samples nearest to that query point.” (Garcia, et al., 2012).
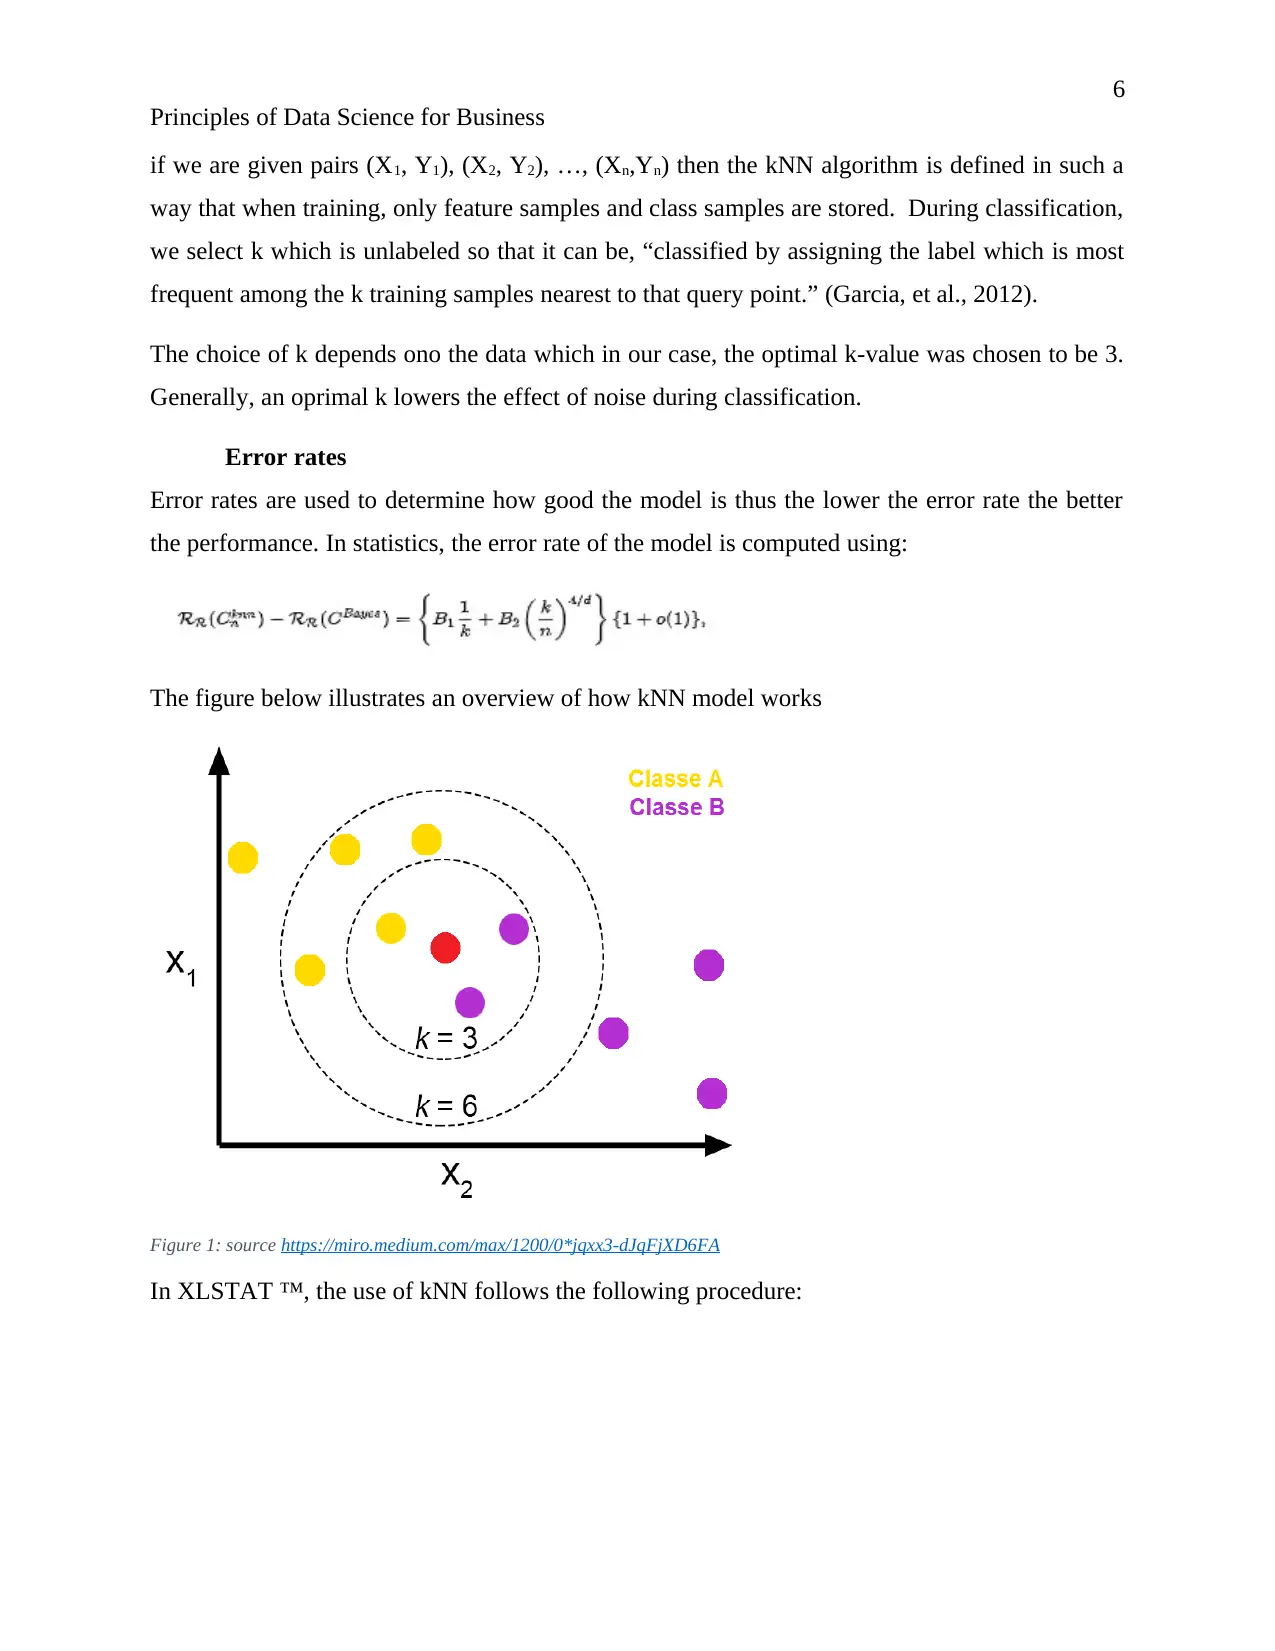
The choice of k depends ono the data which in our case, the optimal k-value was chosen to be 3.
Generally, an oprimal k lowers the effect of noise during classification.
Error rates
Error rates are used to determine how good the model is thus the lower the error rate the better
the performance. In statistics, the error rate of the model is computed using:
The figure below illustrates an overview of how kNN model works
Figure 1: source https://miro.medium.com/max/1200/0*jqxx3-dJqFjXD6FA
In XLSTAT ™, the use of kNN follows the following procedure:
Principles of Data Science for Business
if we are given pairs (X1, Y1), (X2, Y2), …, (Xn,Yn) then the kNN algorithm is defined in such a
way that when training, only feature samples and class samples are stored. During classification,
we select k which is unlabeled so that it can be, “classified by assigning the label which is most
frequent among the k training samples nearest to that query point.” (Garcia, et al., 2012).
The choice of k depends ono the data which in our case, the optimal k-value was chosen to be 3.
Generally, an oprimal k lowers the effect of noise during classification.
Error rates
Error rates are used to determine how good the model is thus the lower the error rate the better
the performance. In statistics, the error rate of the model is computed using:
The figure below illustrates an overview of how kNN model works
Figure 1: source https://miro.medium.com/max/1200/0*jqxx3-dJqFjXD6FA
In XLSTAT ™, the use of kNN follows the following procedure:
⊘ This is a preview!⊘
Do you want full access?
Subscribe today to unlock all pages.
Trusted by 1+ million students worldwide
7
Principles of Data Science for Business
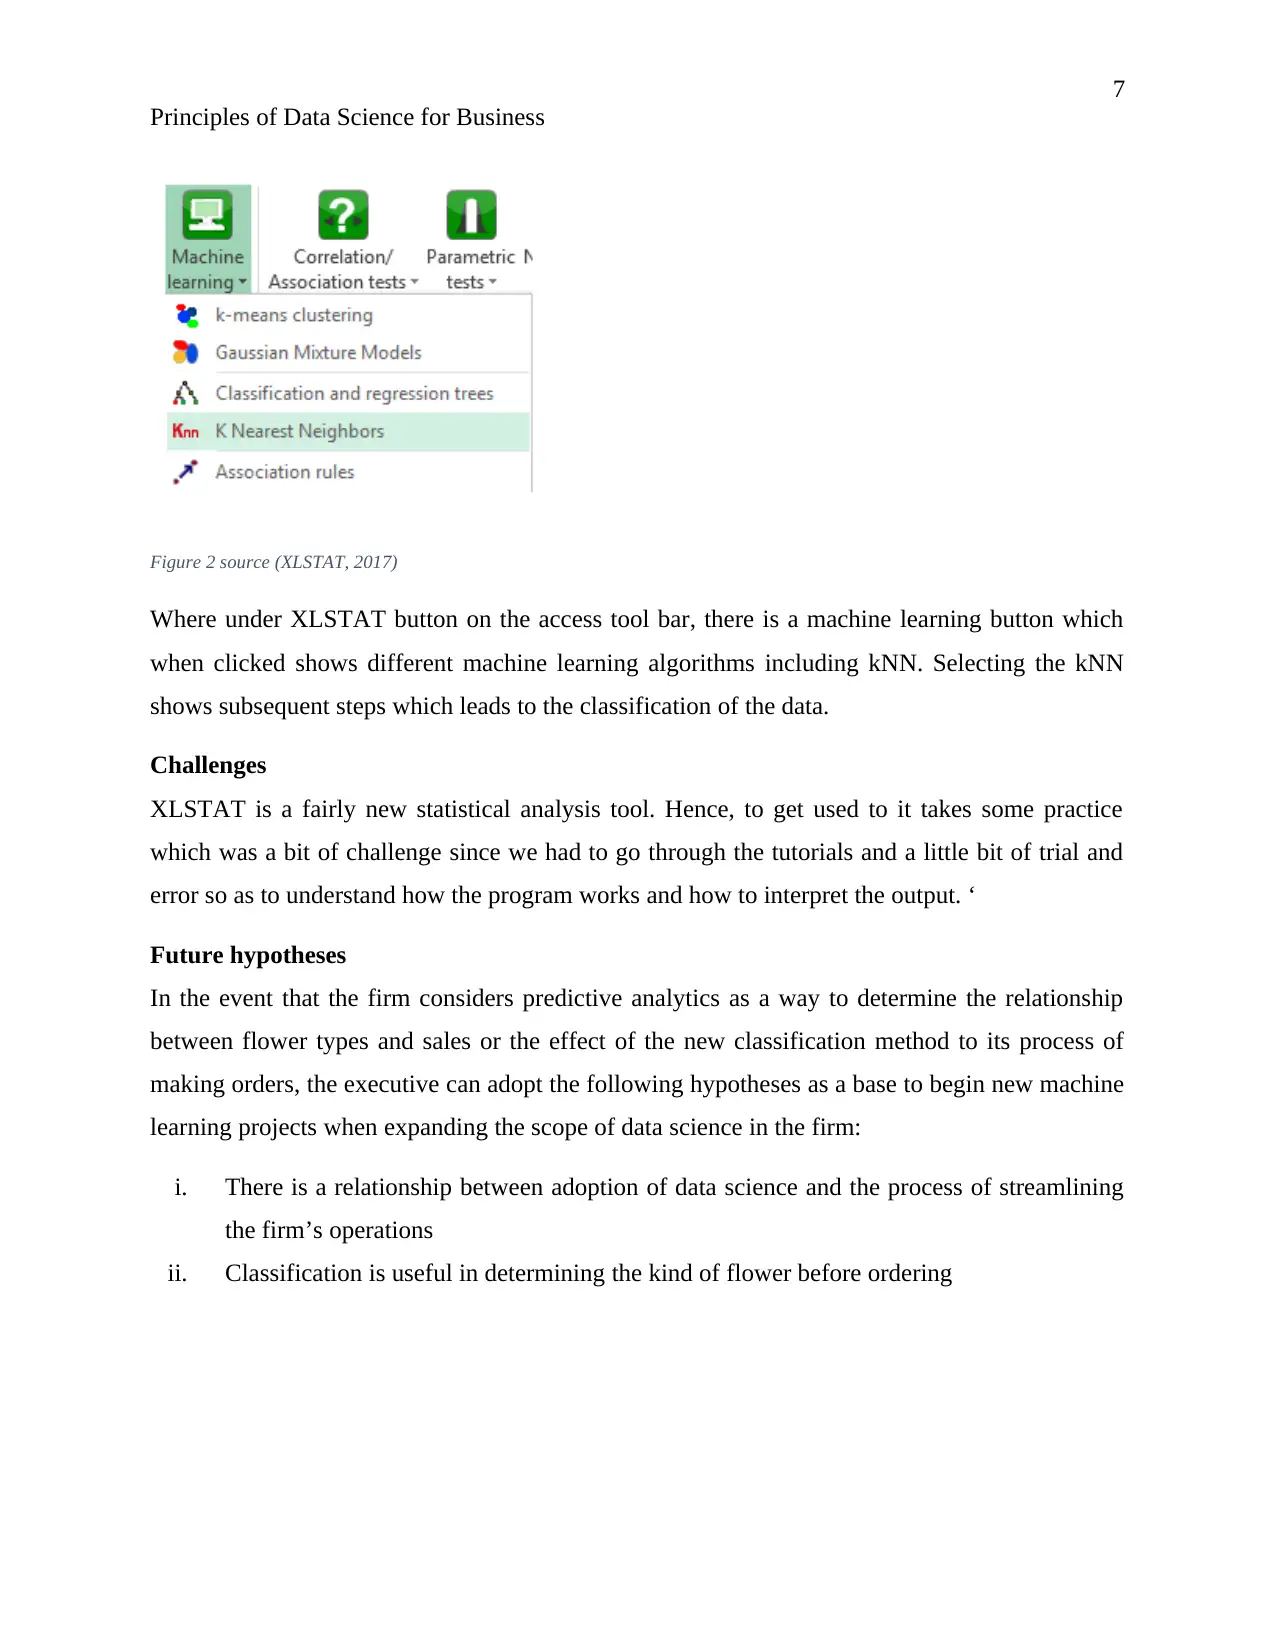
Figure 2 source (XLSTAT, 2017)
Where under XLSTAT button on the access tool bar, there is a machine learning button which
when clicked shows different machine learning algorithms including kNN. Selecting the kNN
shows subsequent steps which leads to the classification of the data.
Challenges
XLSTAT is a fairly new statistical analysis tool. Hence, to get used to it takes some practice
which was a bit of challenge since we had to go through the tutorials and a little bit of trial and
error so as to understand how the program works and how to interpret the output. ‘
Future hypotheses
In the event that the firm considers predictive analytics as a way to determine the relationship
between flower types and sales or the effect of the new classification method to its process of
making orders, the executive can adopt the following hypotheses as a base to begin new machine
learning projects when expanding the scope of data science in the firm:
i. There is a relationship between adoption of data science and the process of streamlining
the firm’s operations
ii. Classification is useful in determining the kind of flower before ordering
Principles of Data Science for Business
Figure 2 source (XLSTAT, 2017)
Where under XLSTAT button on the access tool bar, there is a machine learning button which
when clicked shows different machine learning algorithms including kNN. Selecting the kNN
shows subsequent steps which leads to the classification of the data.
Challenges
XLSTAT is a fairly new statistical analysis tool. Hence, to get used to it takes some practice
which was a bit of challenge since we had to go through the tutorials and a little bit of trial and
error so as to understand how the program works and how to interpret the output. ‘
Future hypotheses
In the event that the firm considers predictive analytics as a way to determine the relationship
between flower types and sales or the effect of the new classification method to its process of
making orders, the executive can adopt the following hypotheses as a base to begin new machine
learning projects when expanding the scope of data science in the firm:
i. There is a relationship between adoption of data science and the process of streamlining
the firm’s operations
ii. Classification is useful in determining the kind of flower before ordering
Paraphrase This Document
Need a fresh take? Get an instant paraphrase of this document with our AI Paraphraser
8
Principles of Data Science for Business
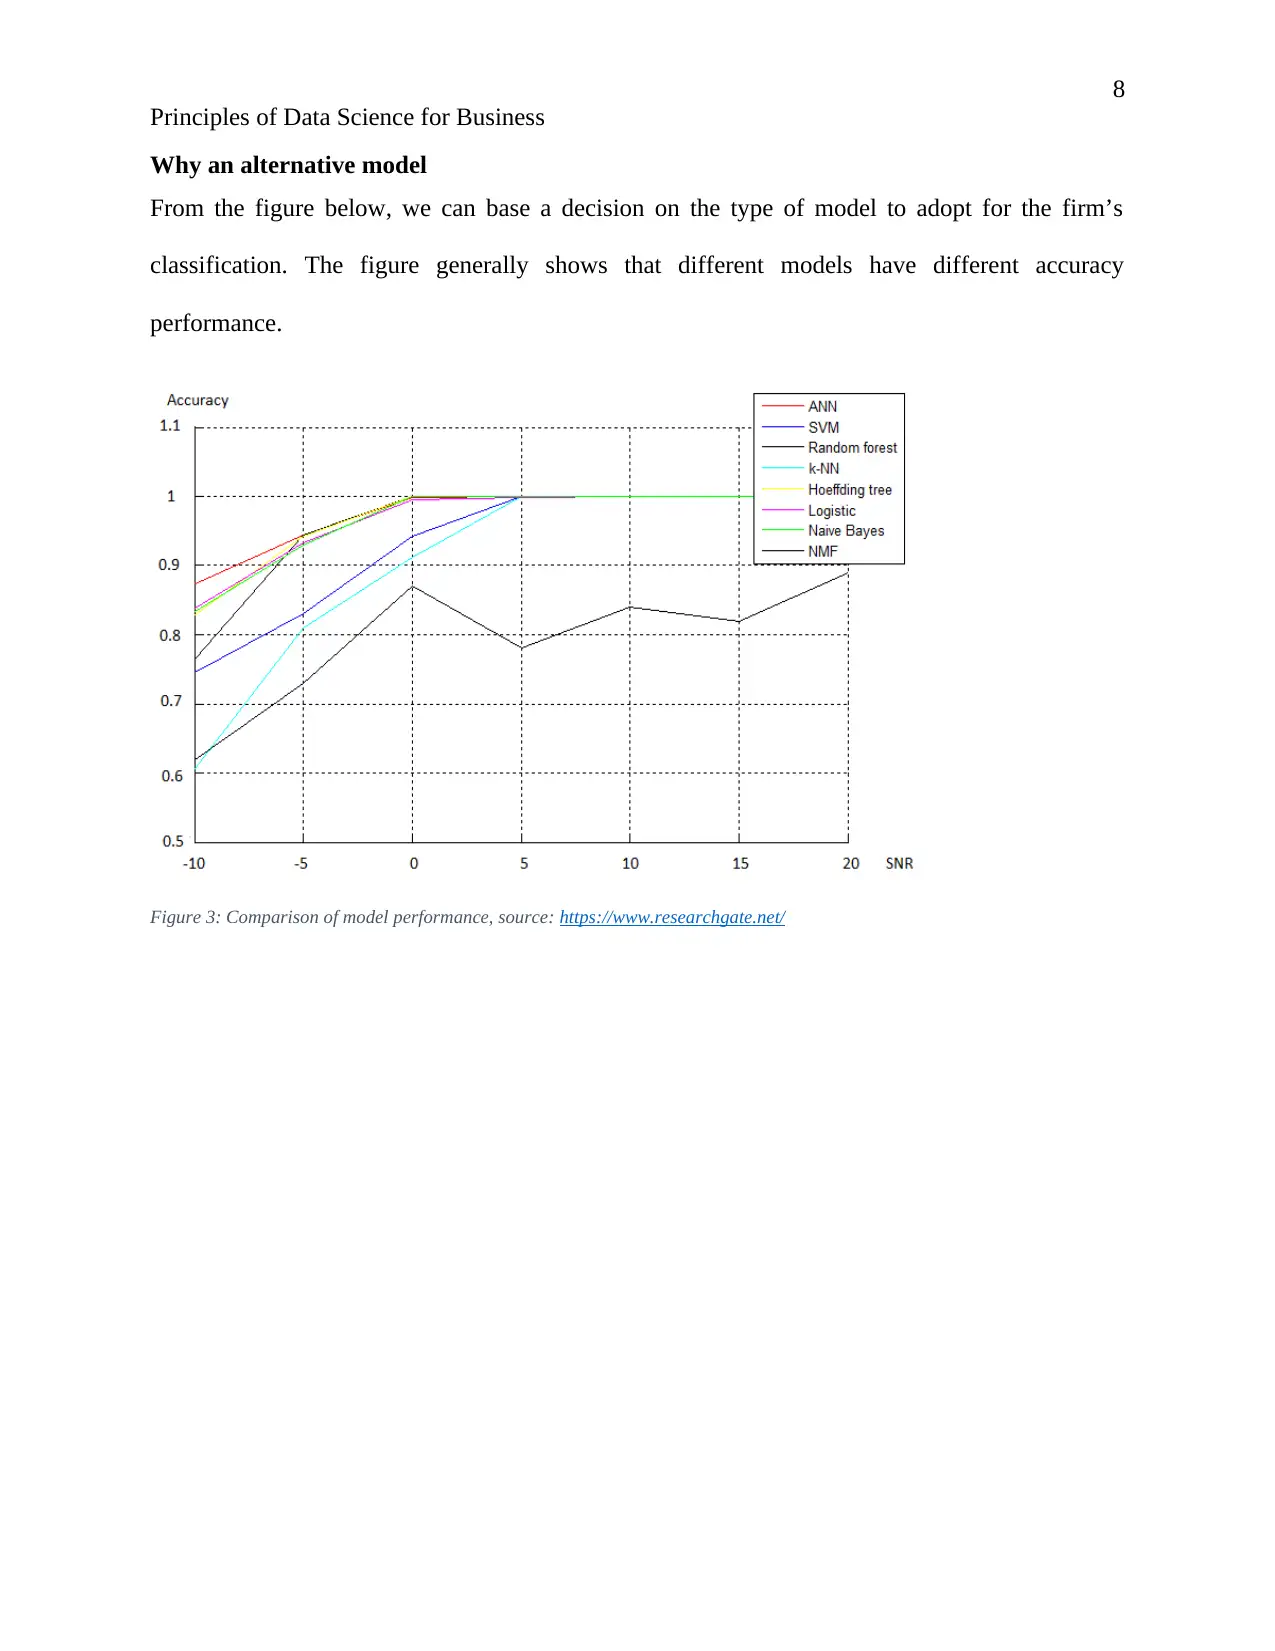
Why an alternative model
From the figure below, we can base a decision on the type of model to adopt for the firm’s
classification. The figure generally shows that different models have different accuracy
performance.
Figure 3: Comparison of model performance, source: https://www.researchgate.net/
Principles of Data Science for Business
Why an alternative model
From the figure below, we can base a decision on the type of model to adopt for the firm’s
classification. The figure generally shows that different models have different accuracy
performance.
Figure 3: Comparison of model performance, source: https://www.researchgate.net/
9
Principles of Data Science for Business
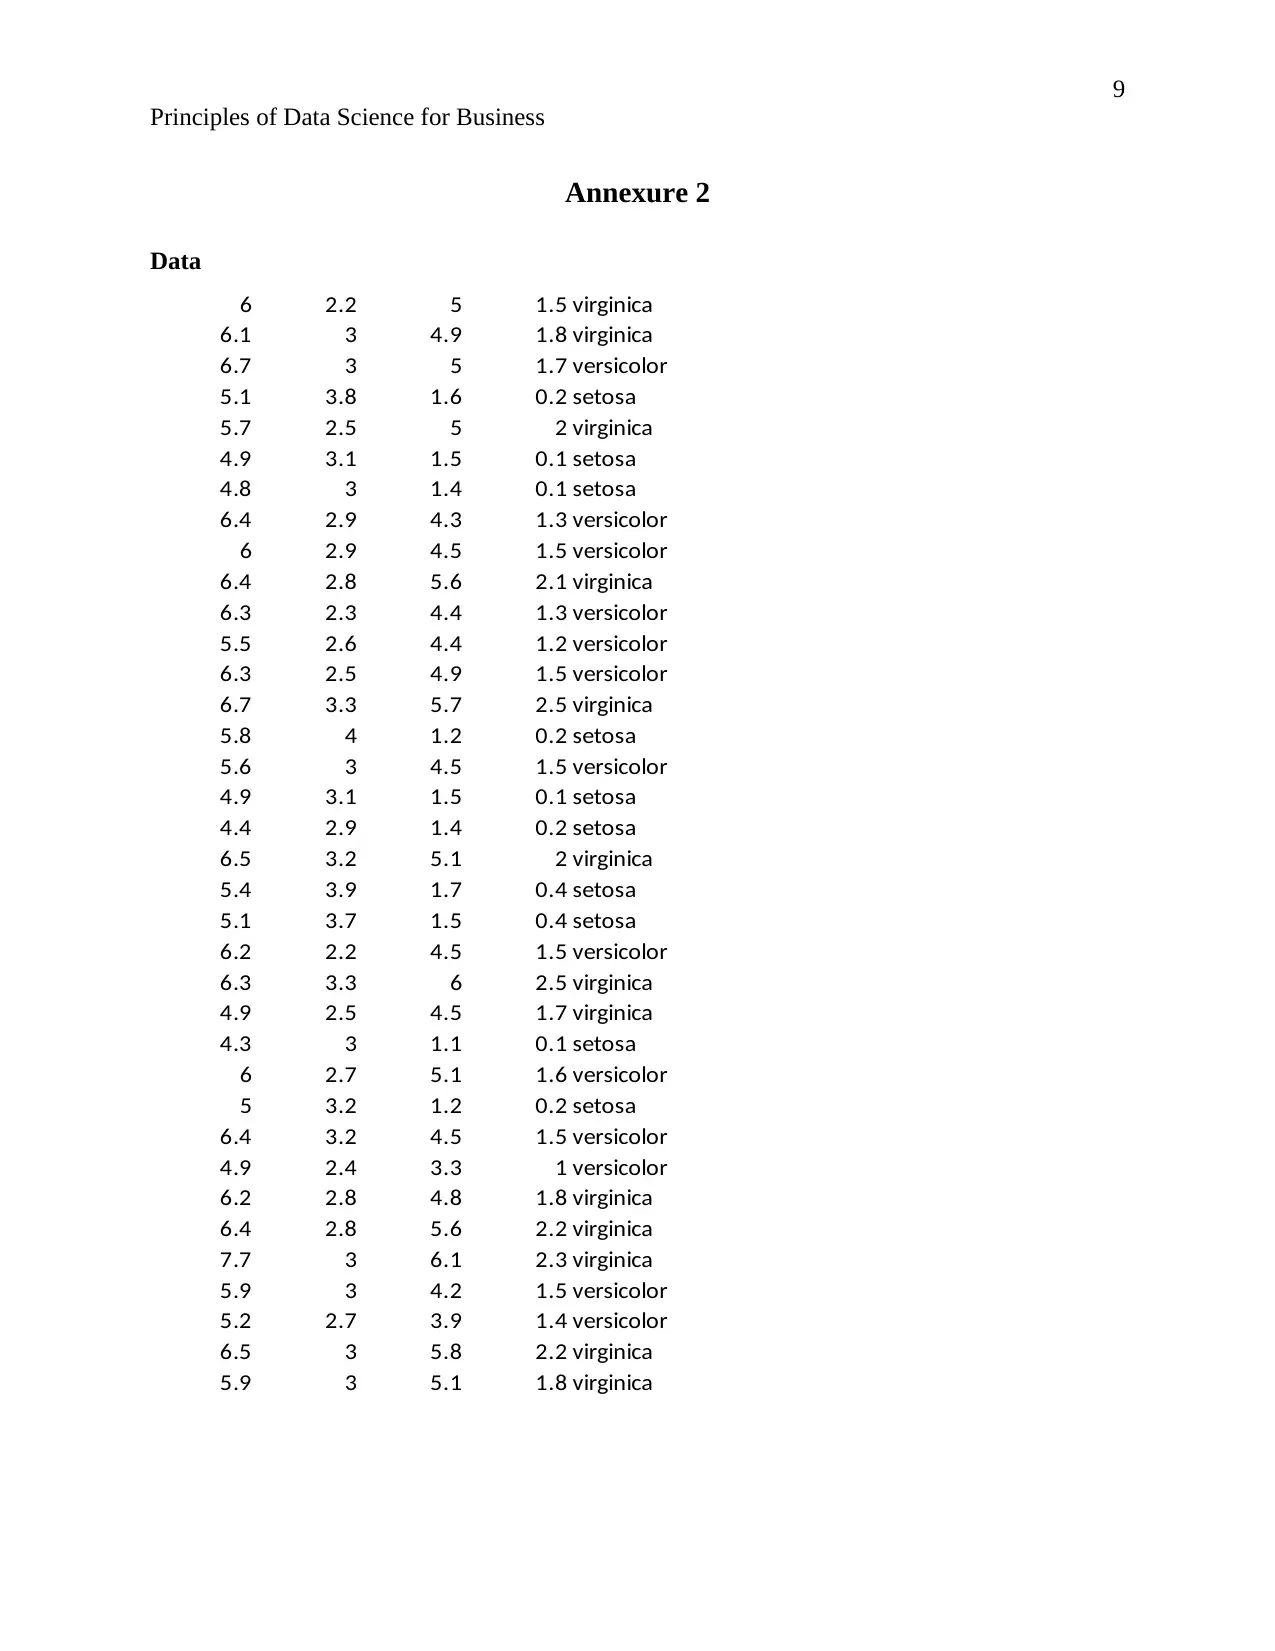
Annexure 2
Data
6 2.2 5 1.5 virginica
6.1 3 4.9 1.8 virginica
6.7 3 5 1.7 versicolor
5.1 3.8 1.6 0.2 setosa
5.7 2.5 5 2 virginica
4.9 3.1 1.5 0.1 setosa
4.8 3 1.4 0.1 setosa
6.4 2.9 4.3 1.3 versicolor
6 2.9 4.5 1.5 versicolor
6.4 2.8 5.6 2.1 virginica
6.3 2.3 4.4 1.3 versicolor
5.5 2.6 4.4 1.2 versicolor
6.3 2.5 4.9 1.5 versicolor
6.7 3.3 5.7 2.5 virginica
5.8 4 1.2 0.2 setosa
5.6 3 4.5 1.5 versicolor
4.9 3.1 1.5 0.1 setosa
4.4 2.9 1.4 0.2 setosa
6.5 3.2 5.1 2 virginica
5.4 3.9 1.7 0.4 setosa
5.1 3.7 1.5 0.4 setosa
6.2 2.2 4.5 1.5 versicolor
6.3 3.3 6 2.5 virginica
4.9 2.5 4.5 1.7 virginica
4.3 3 1.1 0.1 setosa
6 2.7 5.1 1.6 versicolor
5 3.2 1.2 0.2 setosa
6.4 3.2 4.5 1.5 versicolor
4.9 2.4 3.3 1 versicolor
6.2 2.8 4.8 1.8 virginica
6.4 2.8 5.6 2.2 virginica
7.7 3 6.1 2.3 virginica
5.9 3 4.2 1.5 versicolor
5.2 2.7 3.9 1.4 versicolor
6.5 3 5.8 2.2 virginica
5.9 3 5.1 1.8 virginica
Principles of Data Science for Business
Annexure 2
Data
6 2.2 5 1.5 virginica
6.1 3 4.9 1.8 virginica
6.7 3 5 1.7 versicolor
5.1 3.8 1.6 0.2 setosa
5.7 2.5 5 2 virginica
4.9 3.1 1.5 0.1 setosa
4.8 3 1.4 0.1 setosa
6.4 2.9 4.3 1.3 versicolor
6 2.9 4.5 1.5 versicolor
6.4 2.8 5.6 2.1 virginica
6.3 2.3 4.4 1.3 versicolor
5.5 2.6 4.4 1.2 versicolor
6.3 2.5 4.9 1.5 versicolor
6.7 3.3 5.7 2.5 virginica
5.8 4 1.2 0.2 setosa
5.6 3 4.5 1.5 versicolor
4.9 3.1 1.5 0.1 setosa
4.4 2.9 1.4 0.2 setosa
6.5 3.2 5.1 2 virginica
5.4 3.9 1.7 0.4 setosa
5.1 3.7 1.5 0.4 setosa
6.2 2.2 4.5 1.5 versicolor
6.3 3.3 6 2.5 virginica
4.9 2.5 4.5 1.7 virginica
4.3 3 1.1 0.1 setosa
6 2.7 5.1 1.6 versicolor
5 3.2 1.2 0.2 setosa
6.4 3.2 4.5 1.5 versicolor
4.9 2.4 3.3 1 versicolor
6.2 2.8 4.8 1.8 virginica
6.4 2.8 5.6 2.2 virginica
7.7 3 6.1 2.3 virginica
5.9 3 4.2 1.5 versicolor
5.2 2.7 3.9 1.4 versicolor
6.5 3 5.8 2.2 virginica
5.9 3 5.1 1.8 virginica
⊘ This is a preview!⊘
Do you want full access?
Subscribe today to unlock all pages.
Trusted by 1+ million students worldwide
10
Principles of Data Science for Business
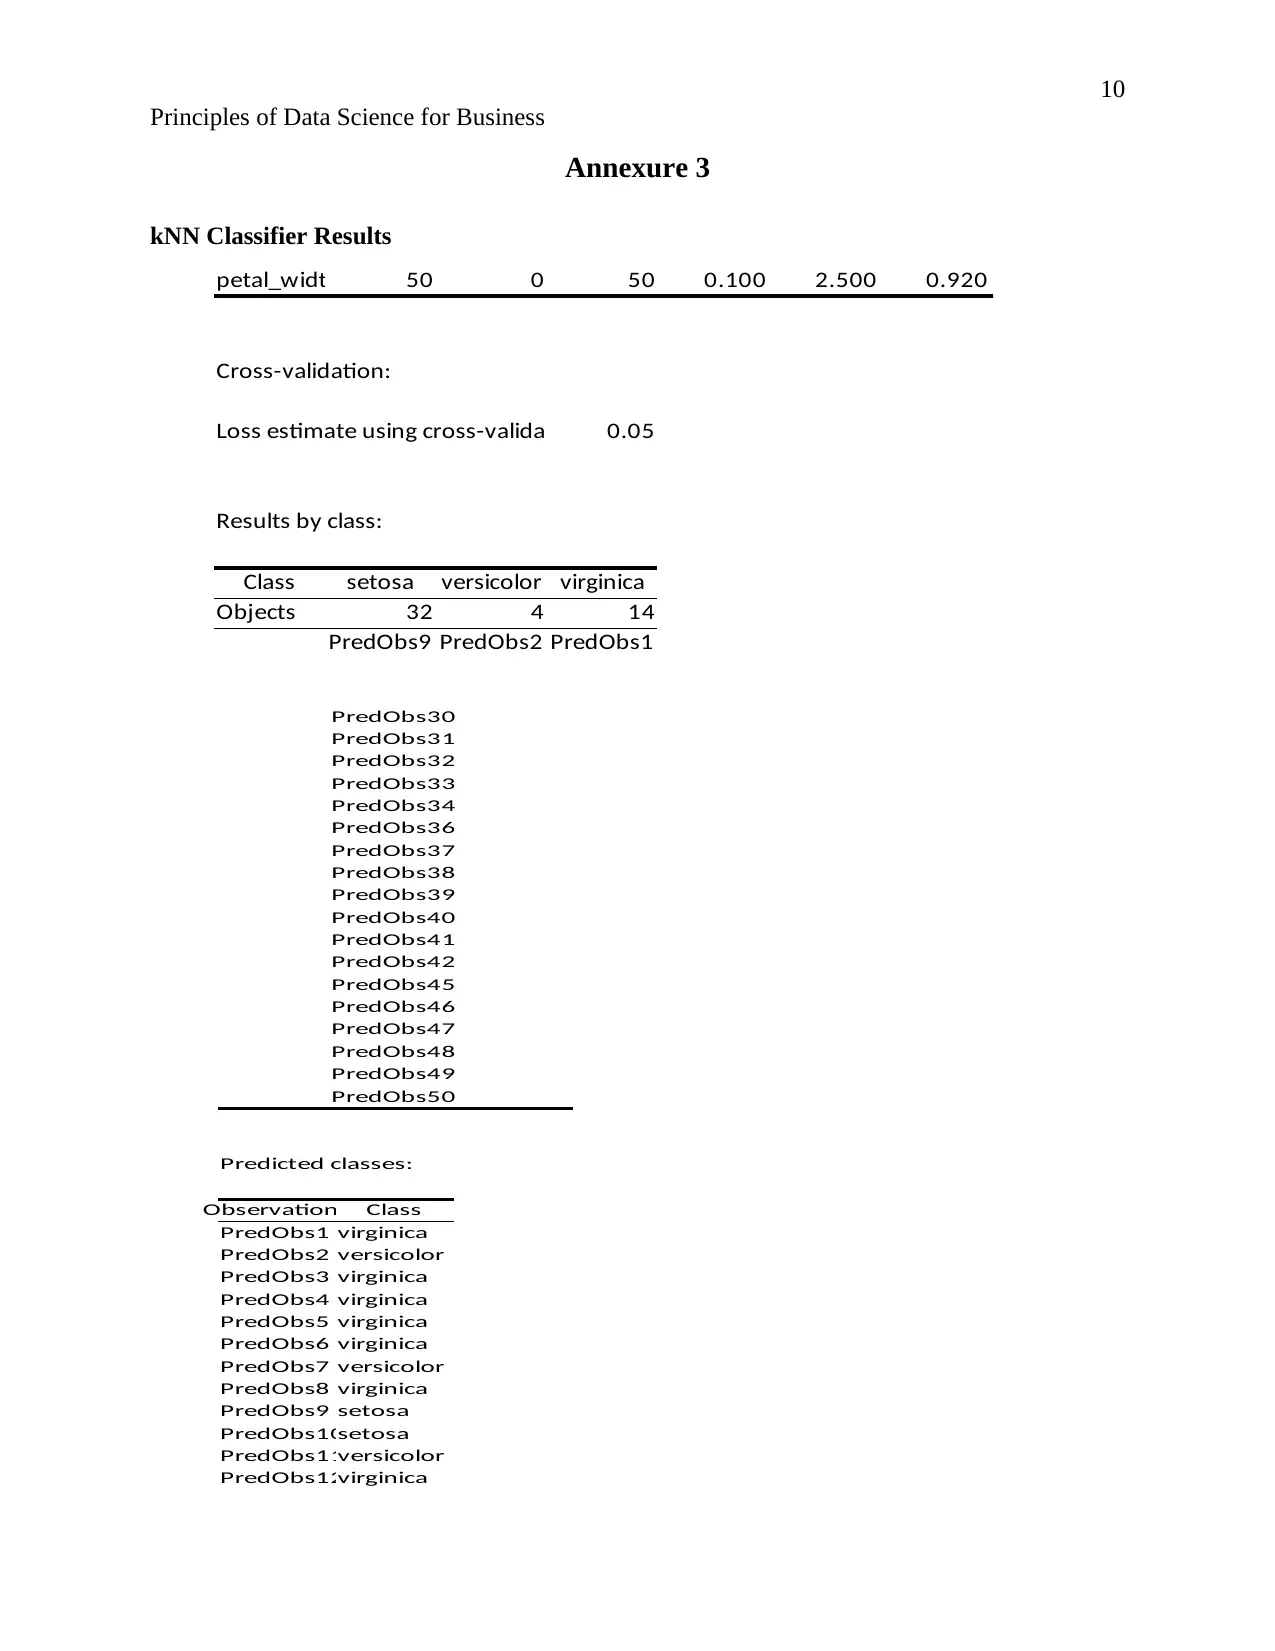
Annexure 3
kNN Classifier Results
petal_widt 50 0 50 0.100 2.500 0.920
Cross-validation:
Loss estimate using cross-valida 0.05
Results by class:
Class setosa versicolor virginica
Objects 32 4 14
PredObs9 PredObs2 PredObs1
PredObs30
PredObs31
PredObs32
PredObs33
PredObs34
PredObs36
PredObs37
PredObs38
PredObs39
PredObs40
PredObs41
PredObs42
PredObs45
PredObs46
PredObs47
PredObs48
PredObs49
PredObs50
Predicted classes:
Observations Class
PredObs1 virginica
PredObs2 versicolor
PredObs3 virginica
PredObs4 virginica
PredObs5 virginica
PredObs6 virginica
PredObs7 versicolor
PredObs8 virginica
PredObs9 setosa
PredObs10setosa
PredObs11versicolor
PredObs12virginica
Principles of Data Science for Business
Annexure 3
kNN Classifier Results
petal_widt 50 0 50 0.100 2.500 0.920
Cross-validation:
Loss estimate using cross-valida 0.05
Results by class:
Class setosa versicolor virginica
Objects 32 4 14
PredObs9 PredObs2 PredObs1
PredObs30
PredObs31
PredObs32
PredObs33
PredObs34
PredObs36
PredObs37
PredObs38
PredObs39
PredObs40
PredObs41
PredObs42
PredObs45
PredObs46
PredObs47
PredObs48
PredObs49
PredObs50
Predicted classes:
Observations Class
PredObs1 virginica
PredObs2 versicolor
PredObs3 virginica
PredObs4 virginica
PredObs5 virginica
PredObs6 virginica
PredObs7 versicolor
PredObs8 virginica
PredObs9 setosa
PredObs10setosa
PredObs11versicolor
PredObs12virginica
Paraphrase This Document
Need a fresh take? Get an instant paraphrase of this document with our AI Paraphraser
11
Principles of Data Science for Business
7. References
Altman, N. S., 2012. An introduction to kernel and nearest-neighbor nonparametric regression.
The American Statistician, 76(19), p. 175–185. .
Garcia, S., Derrac, J., Cano, J. & Herrera, F., 2012. Prototype Selection for Nearest Neighbor
Classification: Taxonomy and Empirical Study. IEEE Transactions on Pattern Analysis and
Machine Intelligence, 34(3), p. 417–435.
Guru, D. S., Sharath, Y. H. & Sharath, Y. H., 2010. Texture Features and KNN in Classification
of Flower Images. IJCA Special Issue on “Recent Trends in Image Processing and Pattern
Recognition”, 12(3), pp. 1-2.
Herzing University, 2019. What is Data Warehousing and Why is it Important?. [Online]
Available at: https://www.herzing.edu/blog/what-data-warehousing-and-why-it-important
[Accessed 8 August 2019].
Painsky, A. & Rosset, S., 2017. Cross-Validated Variable Selection in Tree-Based Methods
Improves Predictive Performance. IEEE Transactions on Pattern Analysis and Machine
Intelligence, 39(1), p. 2142–2153.
SRIVASTAVA, T., 2018. Introduction to k-Nearest Neighbors: A powerful Machine Learning
Algorithm. [Online]
Available at: https://www.analyticsvidhya.com/blog/2018/03/introduction-k-neighbours-
algorithm-clustering/
[Accessed 8 August 2019].
Stefania, D. Z., 2013. The PLS regression model: algorithms and application to chemometric
data, Udine: Universita degli Studi di Udine.
XLSTAT, 2017. K Nearest Neighbors KNN in Excel tutorial. [Online]
Available at: https://help.xlstat.com/customer/en/portal/articles/2062448-k-nearest-neighbors-
knn-in-excel-tutorial?b_id=9283
[Accessed 8 August 2019].

12
Principles of Data Science for Business
Principles of Data Science for Business
⊘ This is a preview!⊘
Do you want full access?
Subscribe today to unlock all pages.
Trusted by 1+ million students worldwide
1 out of 12
Related Documents


Your All-in-One AI-Powered Toolkit for Academic Success.
+13062052269
info@desklib.com
Available 24*7 on WhatsApp / Email
![[object Object]](/_next/static/media/star-bottom.7253800d.svg)
Unlock your academic potential
Copyright © 2020–2026 A2Z Services. All Rights Reserved. Developed and managed by ZUCOL.