Data Skills Report: Analyzing Sample Selection and Wage Dynamics

Verified

Added on  2023/06/08

|9
|1474
|439
Report
AI Summary
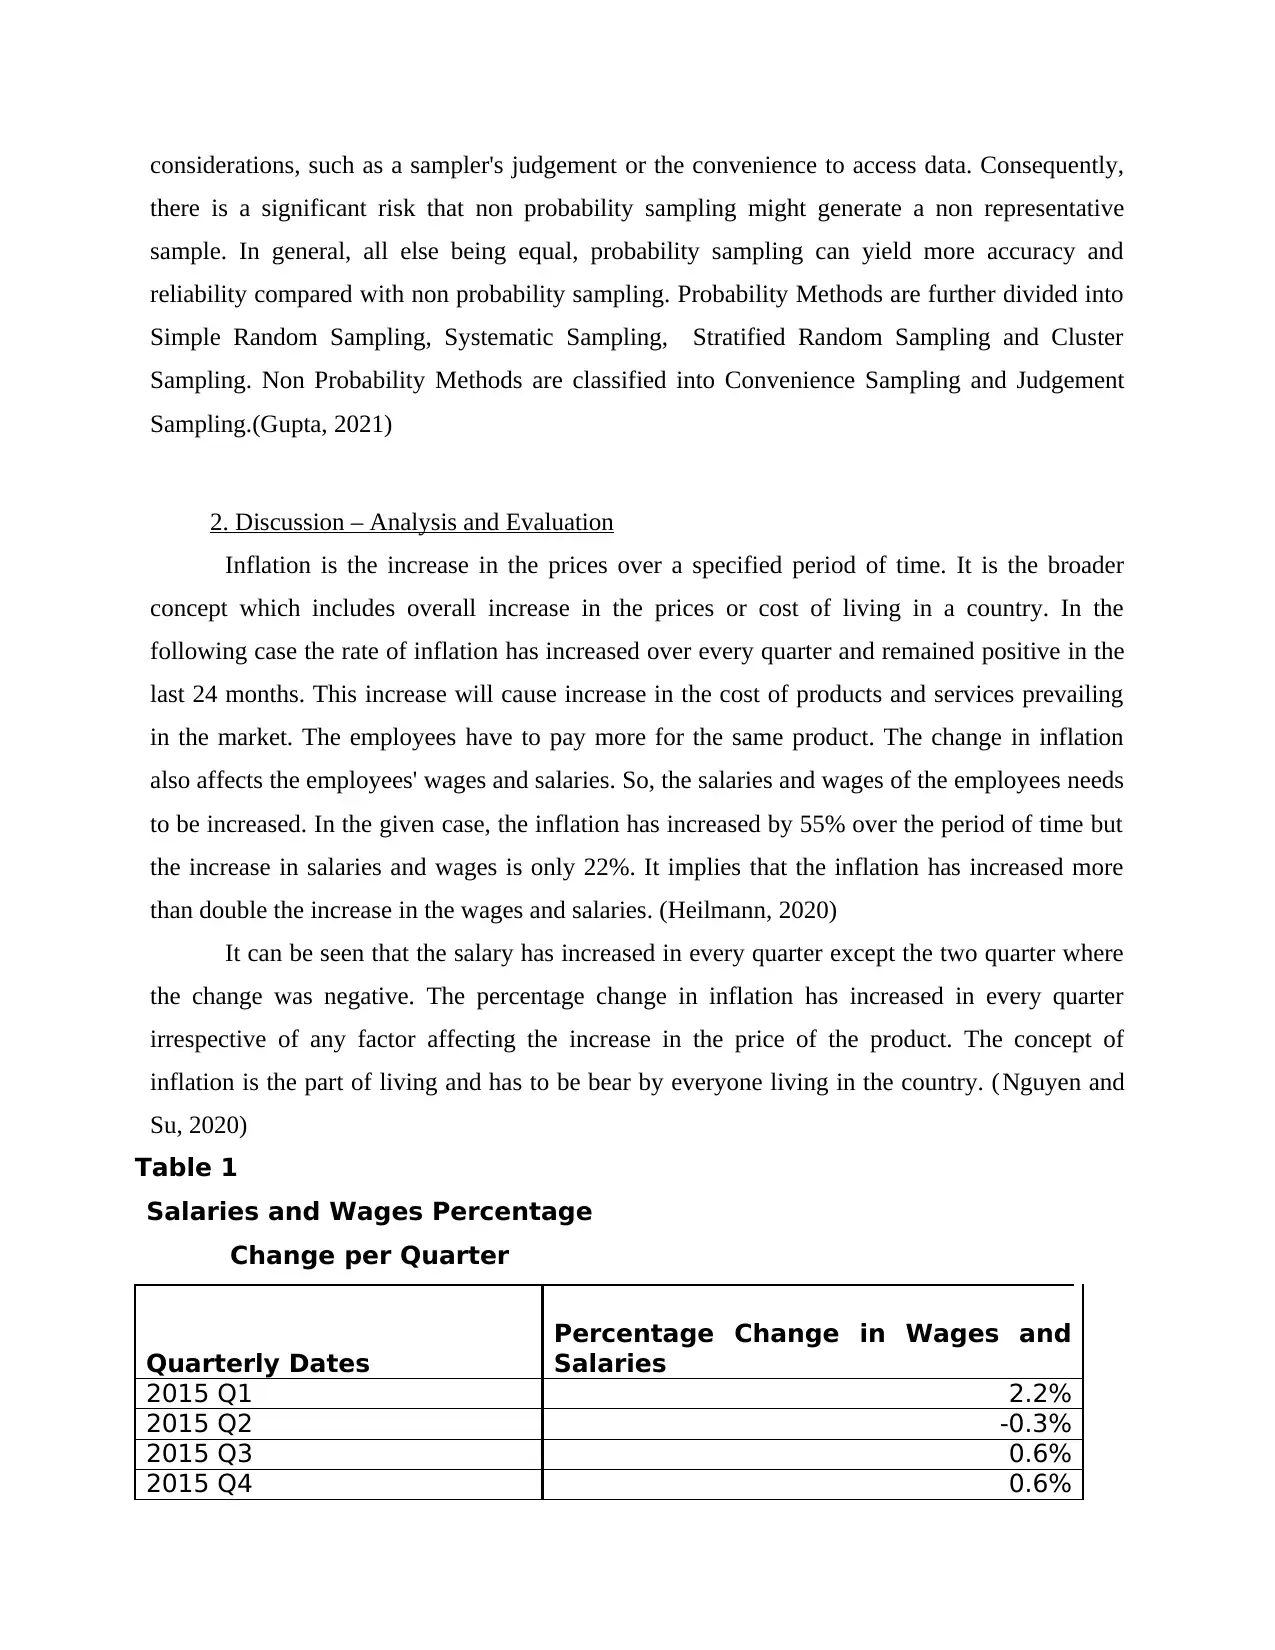
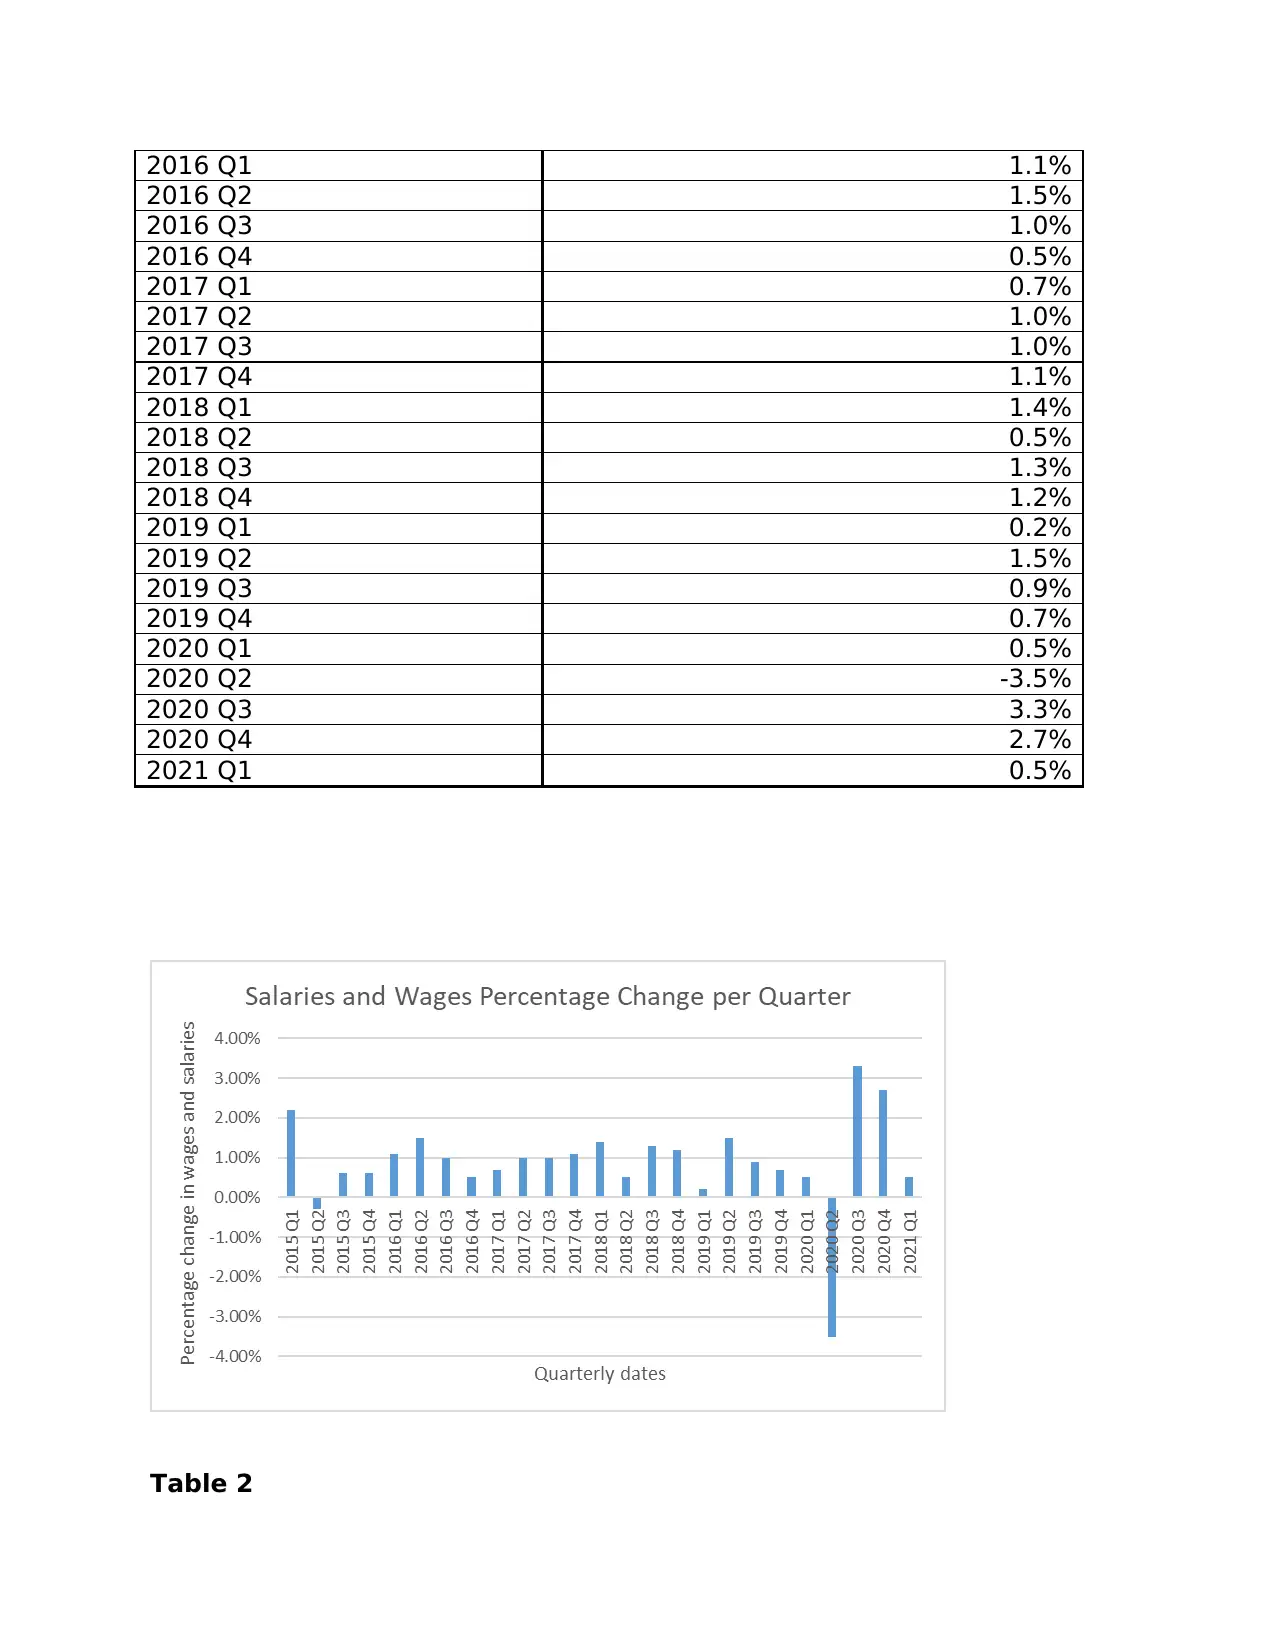
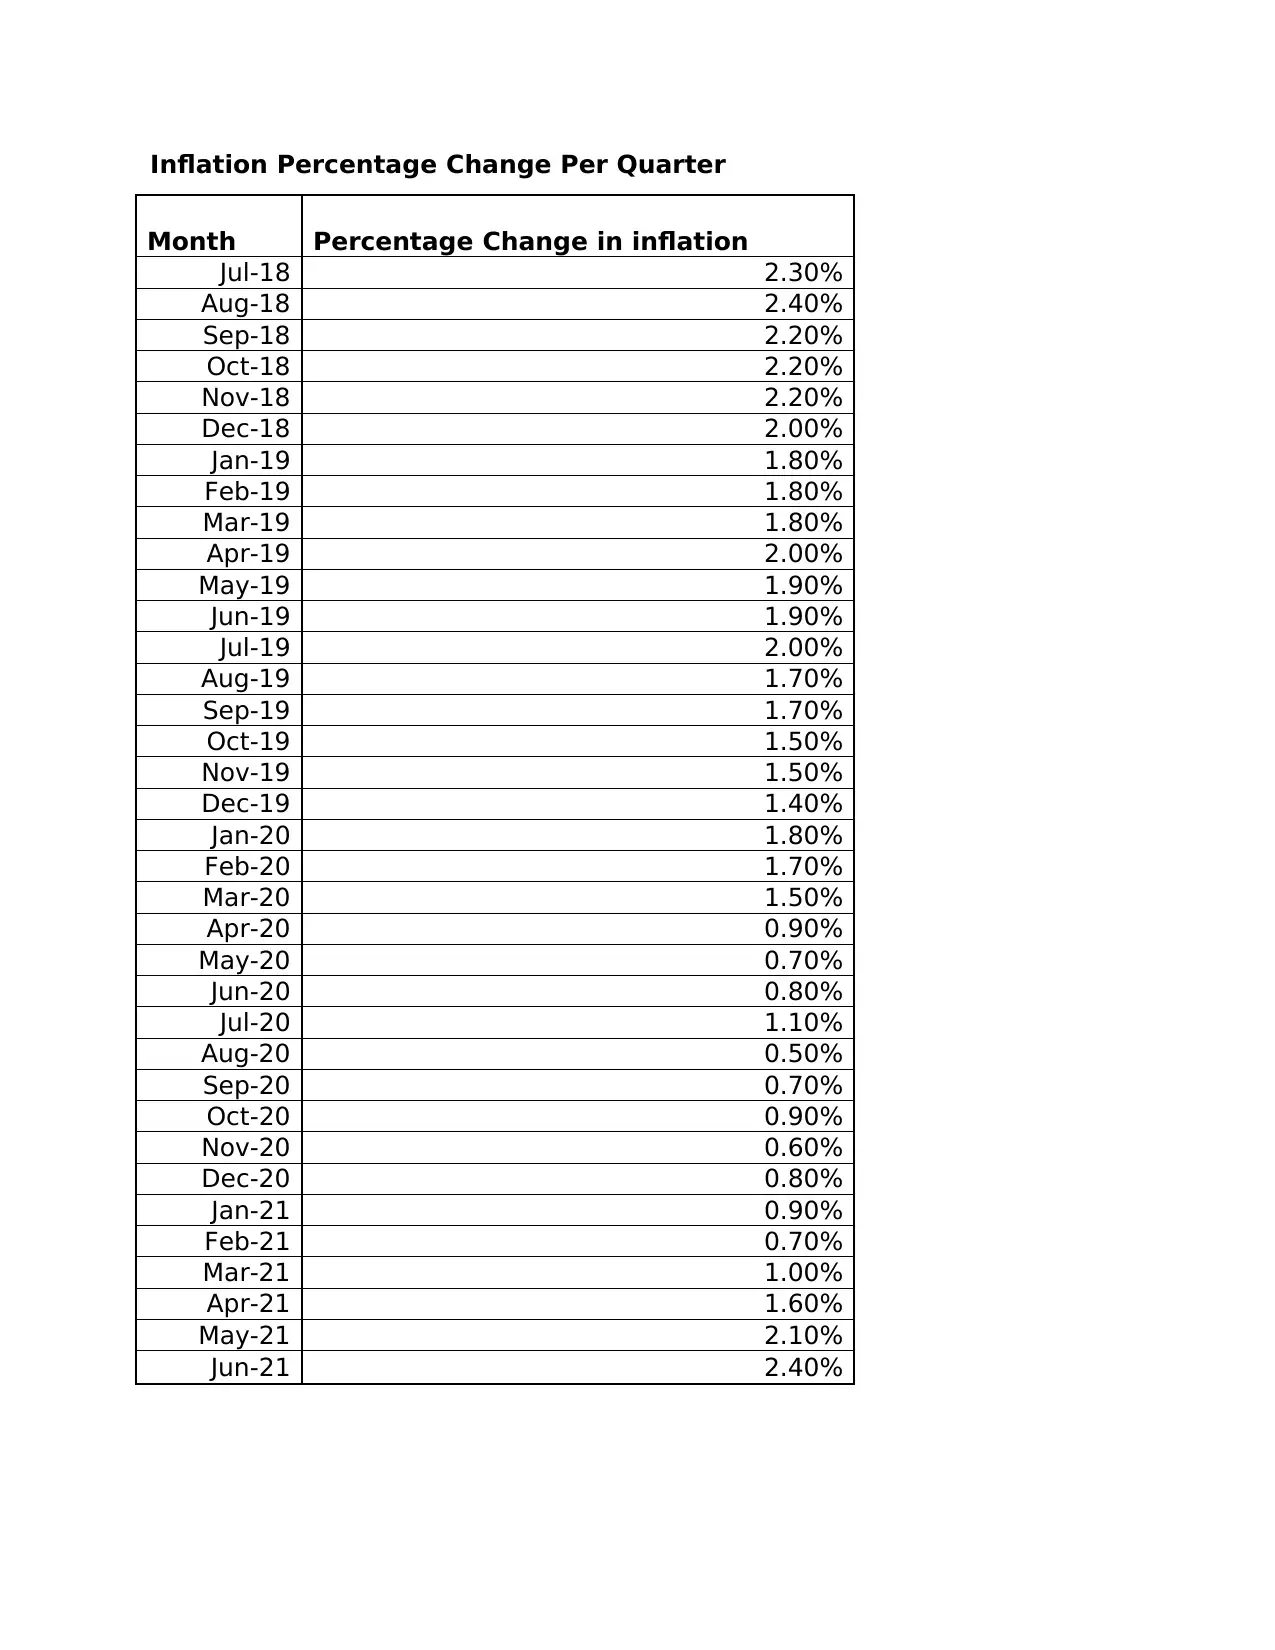
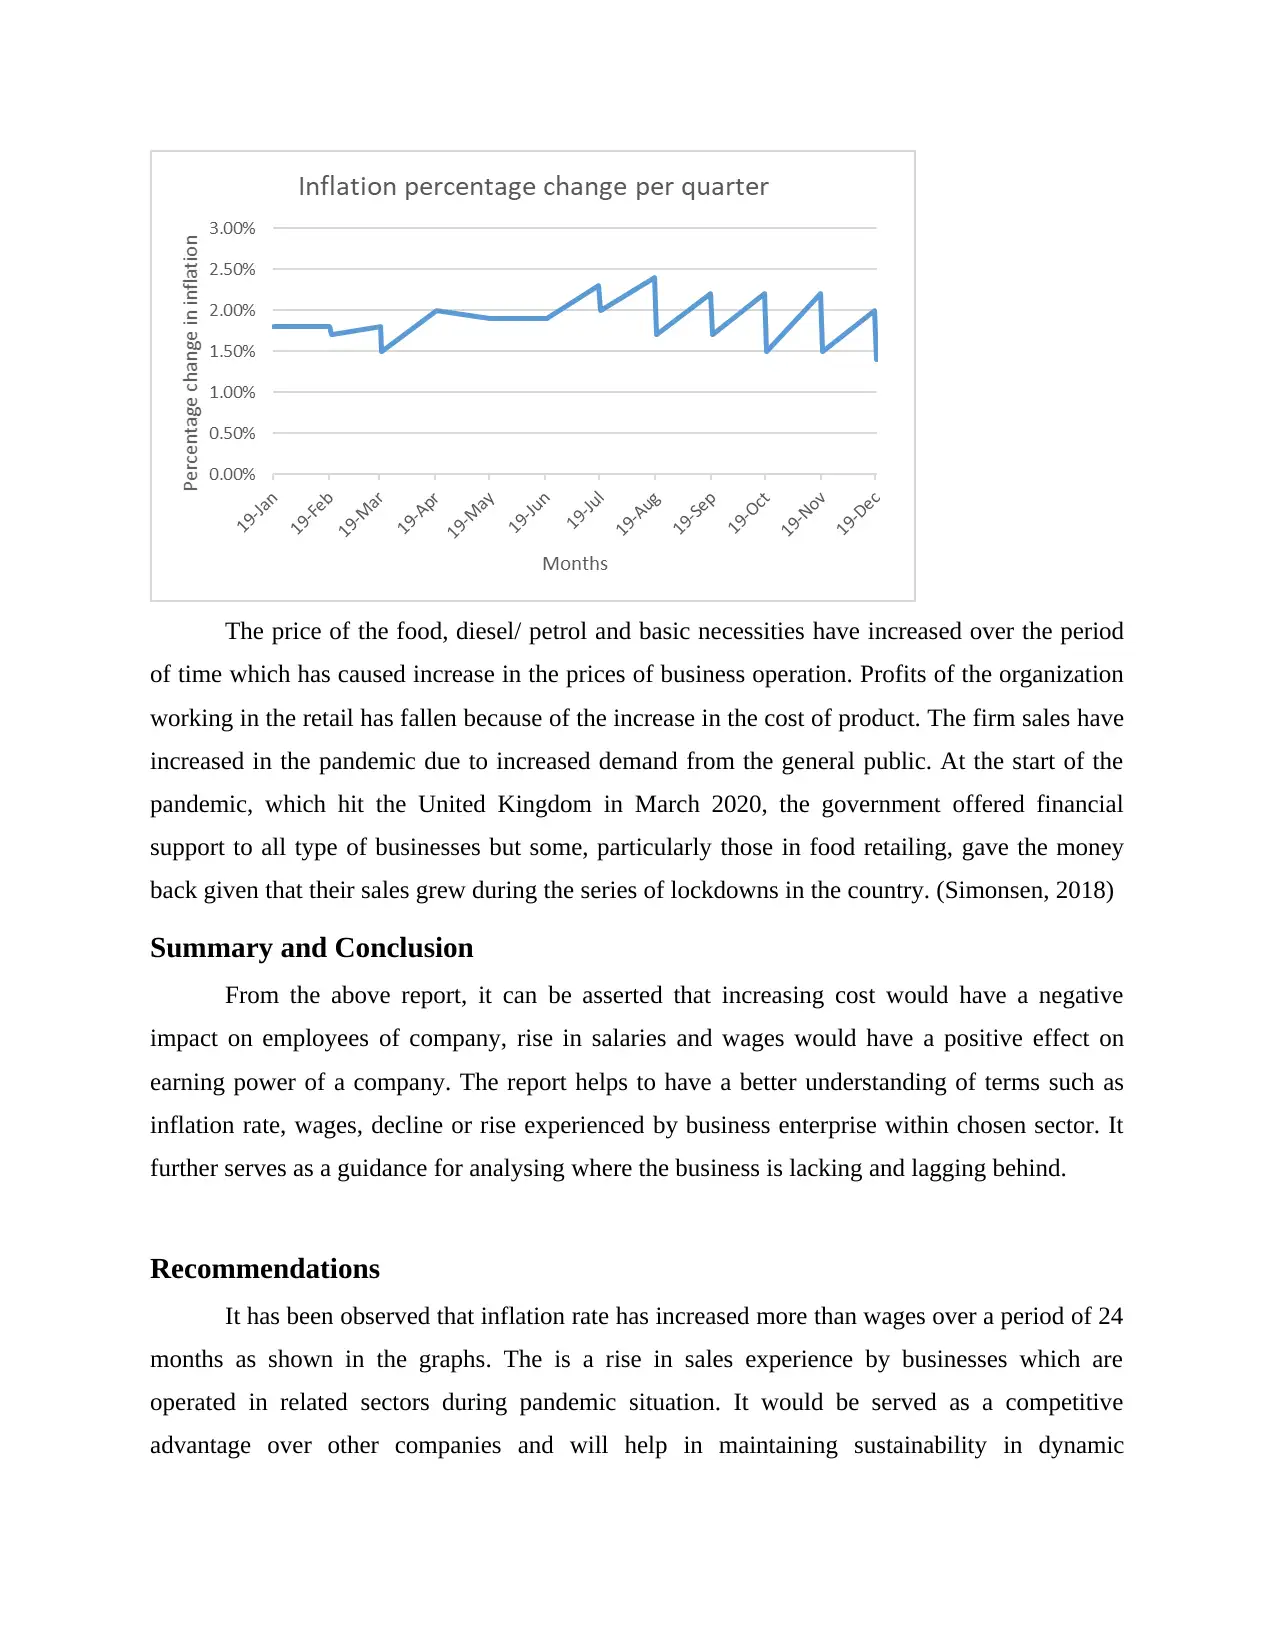
This report explores data skills in the context of business and finance, focusing on statistical sampling methods and wage analysis. It explains why statisticians use samples when dealing with large populations, detailing probability and non-probability sampling techniques. The report also analyzes a case study of wage increases in relation to inflation, using charts and graphs to illustrate the impact of inflation on employee salaries. The analysis reveals that inflation has increased more significantly than wages over a 24-month period, impacting employees' purchasing power. The report concludes with recommendations for businesses to address wage stagnation in the face of rising inflation, emphasizing the importance of maintaining competitive wages to ensure employee well-being and business sustainability. Desklib offers more resources for students seeking similar solved assignments and past papers.
Document Page
Data Skills
tabler-icon-diamond-filled.svg

Secure Best Marks with AI Grader

Need help grading? Try our AI Grader for instant feedback on your assignments.
Document Page
Table of Contents
INTRODUCTION ..........................................................................................................................3
MAIN BODY...................................................................................................................................3
1. The reason why statisticians uses a sample when dealing with large data population and
Two methods of sample selection...............................................................................................3
2. Discussion – Analysis and Evaluation....................................................................................4
Summary and Conclusion................................................................................................................7
Recommendations............................................................................................................................7
REFERENCES................................................................................................................................9
Document Page
INTRODUCTION
Data skills helps in managing accounts by using technology and is in so much demand in
the recent times. The selected topic for the report is business and finance. The report is divided
into two parts. The first part explains the reason why statisticians uses a sample when dealing
with large data population. Further, two methods of sample selection are explained. The second
part shows the analysis of a case for increased wages and salaries for employees with the help of
charts and graphs.
MAIN BODY
1. The reason why statisticians uses a sample when dealing with large data population and Two
methods of sample selection
When it would not be practical to gather data on an entire population, samples are used
provided they are unbiased. A reasonably large sample will normally reflect the characteristics of
the entire population. Statisticians use samples to make predictions and statements about the
general characteristics of a population.
Each day, we observe the high, low and close of stock market indexes from around the
world. Indexes such as the S&P 500 and the Nikkei 225 Stock Average are samples of stocks.
Although the S&P 500 and the Nikkei do not represent the populations of US or Japanese stocks,
they are valid indicators of the whole population's behaviour. Analysts are accustomed to use this
sample information to asses how various markets from around the world are performing. Any
statistics that is computed with sample information, however, are only estimates of the
underlying population parameters.
Sampling is the process of obtaining a sample. The sample could be taken for two
reasons. In some cases, examining every member of the population is not possible. In other
cases, examining every member of the population would not be economically efficient. Thus,
savings of time and money are two primary factors that cause an analyst to use sampling to
answer a question about a population. There are two types of sampling methods: probability
sampling and non probability sampling. Probability sampling gives every member of the
population an equal chance of being selected. Hence it can create a sample that is representative
of the population. In contrast, non probability sampling depends on factors other than probability
Document Page
considerations, such as a sampler's judgement or the convenience to access data. Consequently,
there is a significant risk that non probability sampling might generate a non representative
sample. In general, all else being equal, probability sampling can yield more accuracy and
reliability compared with non probability sampling. Probability Methods are further divided into
Simple Random Sampling, Systematic Sampling, Stratified Random Sampling and Cluster
Sampling. Non Probability Methods are classified into Convenience Sampling and Judgement
Sampling.(Gupta, 2021)
2. Discussion – Analysis and Evaluation
Inflation is the increase in the prices over a specified period of time. It is the broader
concept which includes overall increase in the prices or cost of living in a country. In the
following case the rate of inflation has increased over every quarter and remained positive in the
last 24 months. This increase will cause increase in the cost of products and services prevailing
in the market. The employees have to pay more for the same product. The change in inflation
also affects the employees' wages and salaries. So, the salaries and wages of the employees needs
to be increased. In the given case, the inflation has increased by 55% over the period of time but
the increase in salaries and wages is only 22%. It implies that the inflation has increased more
than double the increase in the wages and salaries. (Heilmann, 2020)
It can be seen that the salary has increased in every quarter except the two quarter where
the change was negative. The percentage change in inflation has increased in every quarter
irrespective of any factor affecting the increase in the price of the product. The concept of
inflation is the part of living and has to be bear by everyone living in the country. (Nguyen and
Su, 2020)
Table 1
Salaries and Wages Percentage
Change per Quarter
Quarterly Dates
Percentage Change in Wages and
Salaries
2015 Q1 2.2%
2015 Q2 -0.3%
2015 Q3 0.6%
2015 Q4 0.6%
tabler-icon-diamond-filled.svg

Secure Best Marks with AI Grader

Need help grading? Try our AI Grader for instant feedback on your assignments.
Document Page
2016 Q1 1.1%
2016 Q2 1.5%
2016 Q3 1.0%
2016 Q4 0.5%
2017 Q1 0.7%
2017 Q2 1.0%
2017 Q3 1.0%
2017 Q4 1.1%
2018 Q1 1.4%
2018 Q2 0.5%
2018 Q3 1.3%
2018 Q4 1.2%
2019 Q1 0.2%
2019 Q2 1.5%
2019 Q3 0.9%
2019 Q4 0.7%
2020 Q1 0.5%
2020 Q2 -3.5%
2020 Q3 3.3%
2020 Q4 2.7%
2021 Q1 0.5%
Table 2
Document Page
Inflation Percentage Change Per Quarter
Month Percentage Change in inflation
Jul-18 2.30%
Aug-18 2.40%
Sep-18 2.20%
Oct-18 2.20%
Nov-18 2.20%
Dec-18 2.00%
Jan-19 1.80%
Feb-19 1.80%
Mar-19 1.80%
Apr-19 2.00%
May-19 1.90%
Jun-19 1.90%
Jul-19 2.00%
Aug-19 1.70%
Sep-19 1.70%
Oct-19 1.50%
Nov-19 1.50%
Dec-19 1.40%
Jan-20 1.80%
Feb-20 1.70%
Mar-20 1.50%
Apr-20 0.90%
May-20 0.70%
Jun-20 0.80%
Jul-20 1.10%
Aug-20 0.50%
Sep-20 0.70%
Oct-20 0.90%
Nov-20 0.60%
Dec-20 0.80%
Jan-21 0.90%
Feb-21 0.70%
Mar-21 1.00%
Apr-21 1.60%
May-21 2.10%
Jun-21 2.40%
Document Page
The price of the food, diesel/ petrol and basic necessities have increased over the period
of time which has caused increase in the prices of business operation. Profits of the organization
working in the retail has fallen because of the increase in the cost of product. The firm sales have
increased in the pandemic due to increased demand from the general public. At the start of the
pandemic, which hit the United Kingdom in March 2020, the government offered financial
support to all type of businesses but some, particularly those in food retailing, gave the money
back given that their sales grew during the series of lockdowns in the country. (Simonsen, 2018)
Summary and Conclusion
From the above report, it can be asserted that increasing cost would have a negative
impact on employees of company, rise in salaries and wages would have a positive effect on
earning power of a company. The report helps to have a better understanding of terms such as
inflation rate, wages, decline or rise experienced by business enterprise within chosen sector. It
further serves as a guidance for analysing where the business is lacking and lagging behind.
Recommendations
It has been observed that inflation rate has increased more than wages over a period of 24
months as shown in the graphs. The is a rise in sales experience by businesses which are
operated in related sectors during pandemic situation. It would be served as a competitive
advantage over other companies and will help in maintaining sustainability in dynamic
tabler-icon-diamond-filled.svg

Paraphrase This Document

Need a fresh take? Get an instant paraphrase of this document with our AI Paraphraser
Document Page
environment. Decline in wages would lead to a tough situation as employees would face
difficulties when inflation hits the economy.
Document Page
REFERENCES
Books and Journals
Choi, S. and Poplawski-Ribeiro, M., 2018. Oil prices and inflation dynamics: Evidence from
advanced and developing economies. Journal of International Money and Finance, 82,
pp.71-96.
Gupta, B.C., 2021. Sampling Methods.
Heilmann, L., 2020. Health and numeracy: The role of numeracy skills in health satisfaction and
health-related behaviour. ZDM, 52(3), pp.407-418.
Nguyen, C.P. and Su, T.D., 2020. Economic policy uncertainty and demand for international
tourism: An empirical study. Tourism Economics, 26(8), pp.1415-1430.
Simonsen, M.H., 2018. Rational expectations, game theory and inflationary inertia. In The
economy as an evolving complex system (pp. 205-241). CRC Press.
chevron_up_icon
1 out of 9
circle_padding
hide_on_mobile
zoom_out_icon
[object Object]