Comprehensive Analysis of BLITZ Department Store Data: Report

Verified

Added on  2020/03/02

|9
|652
|167
Report
AI Summary
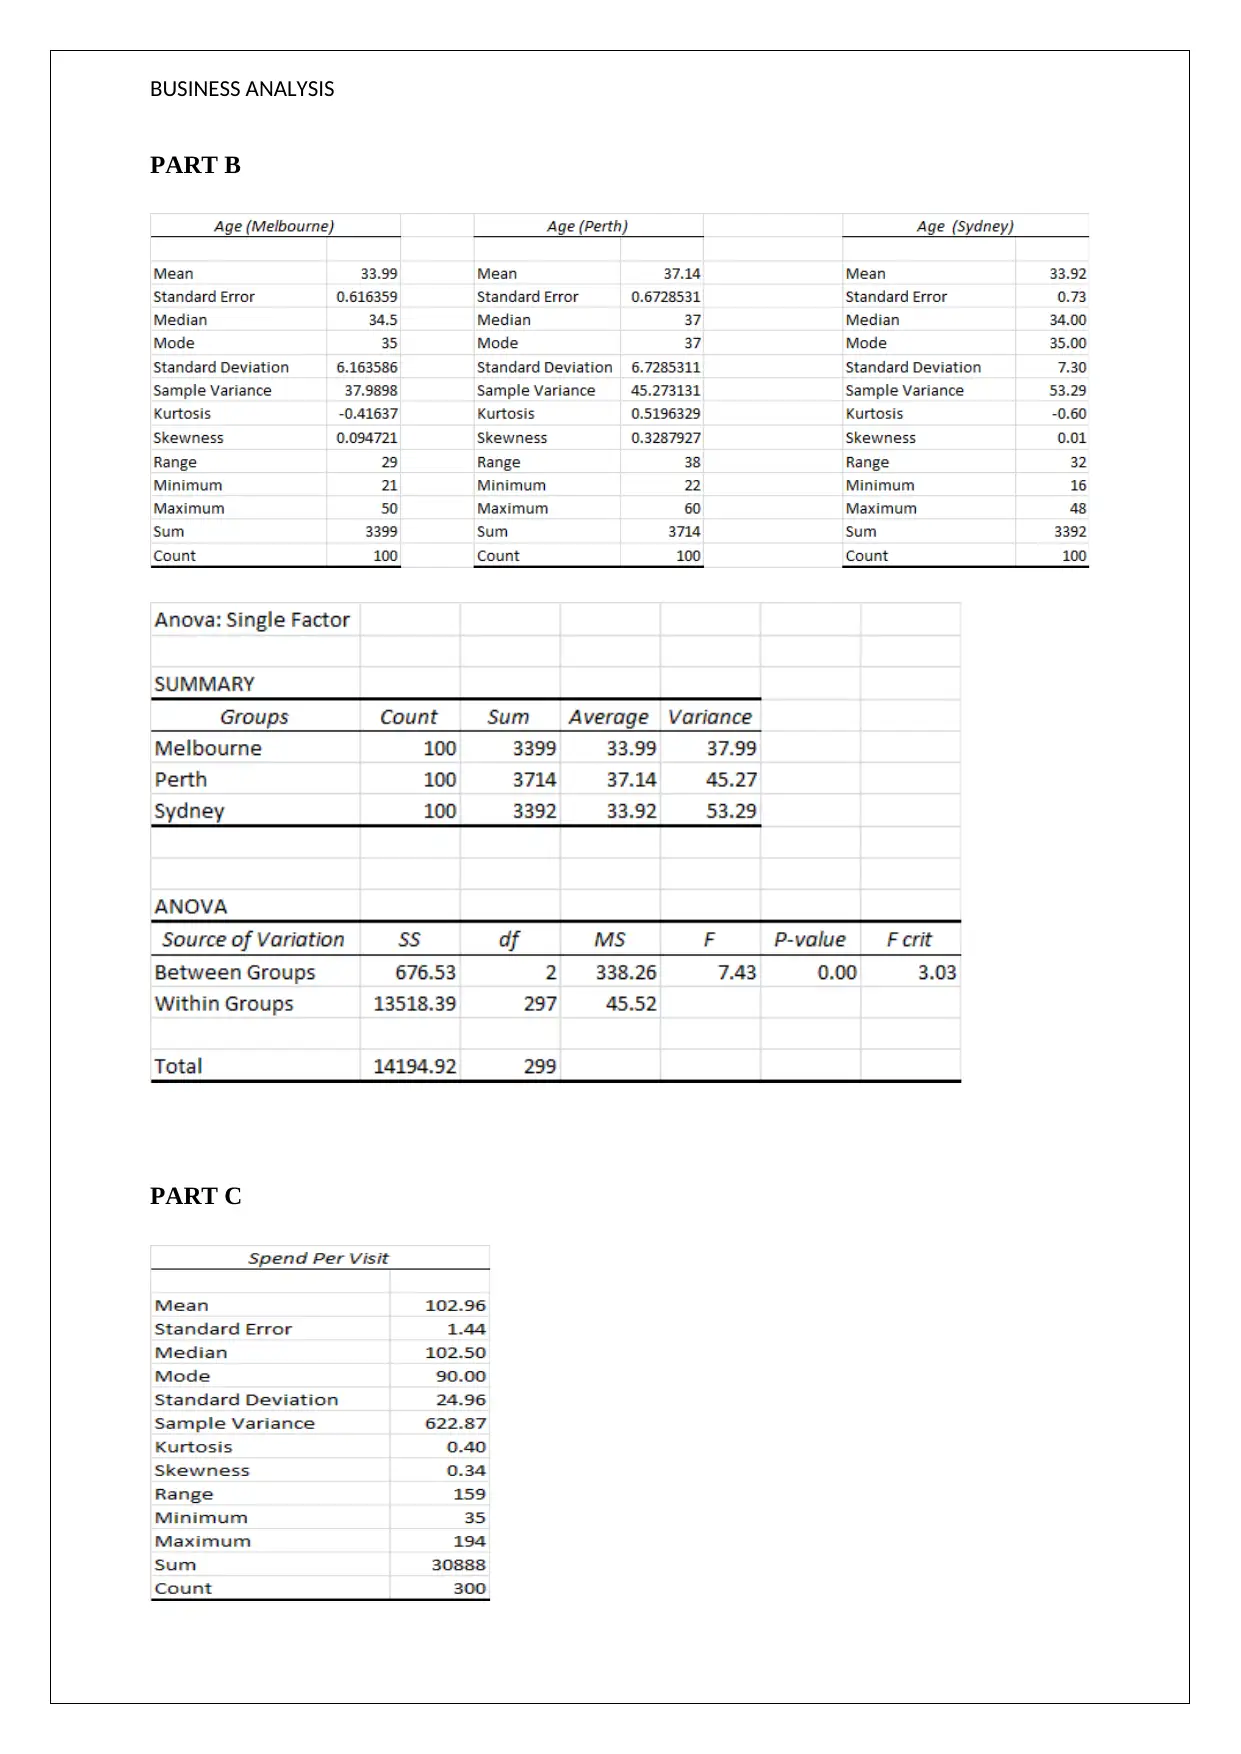
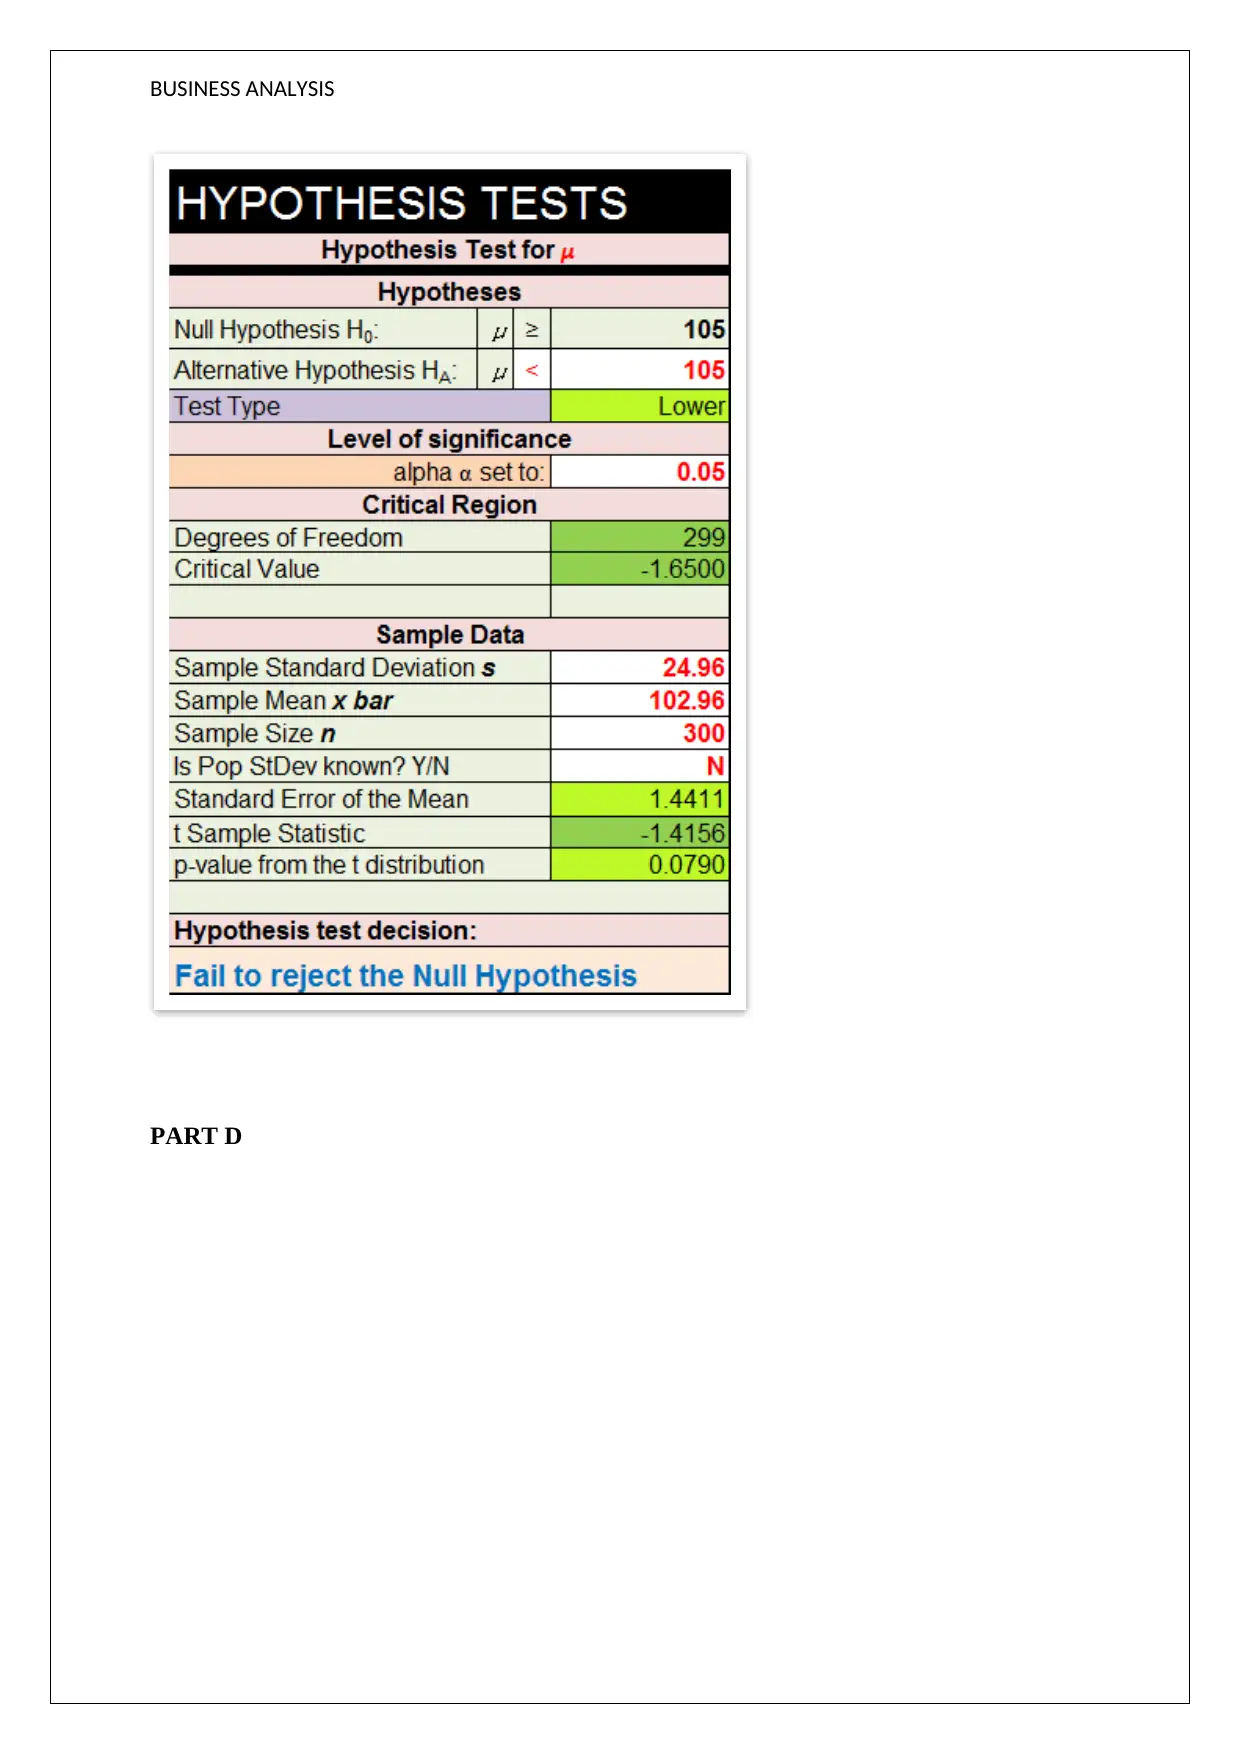
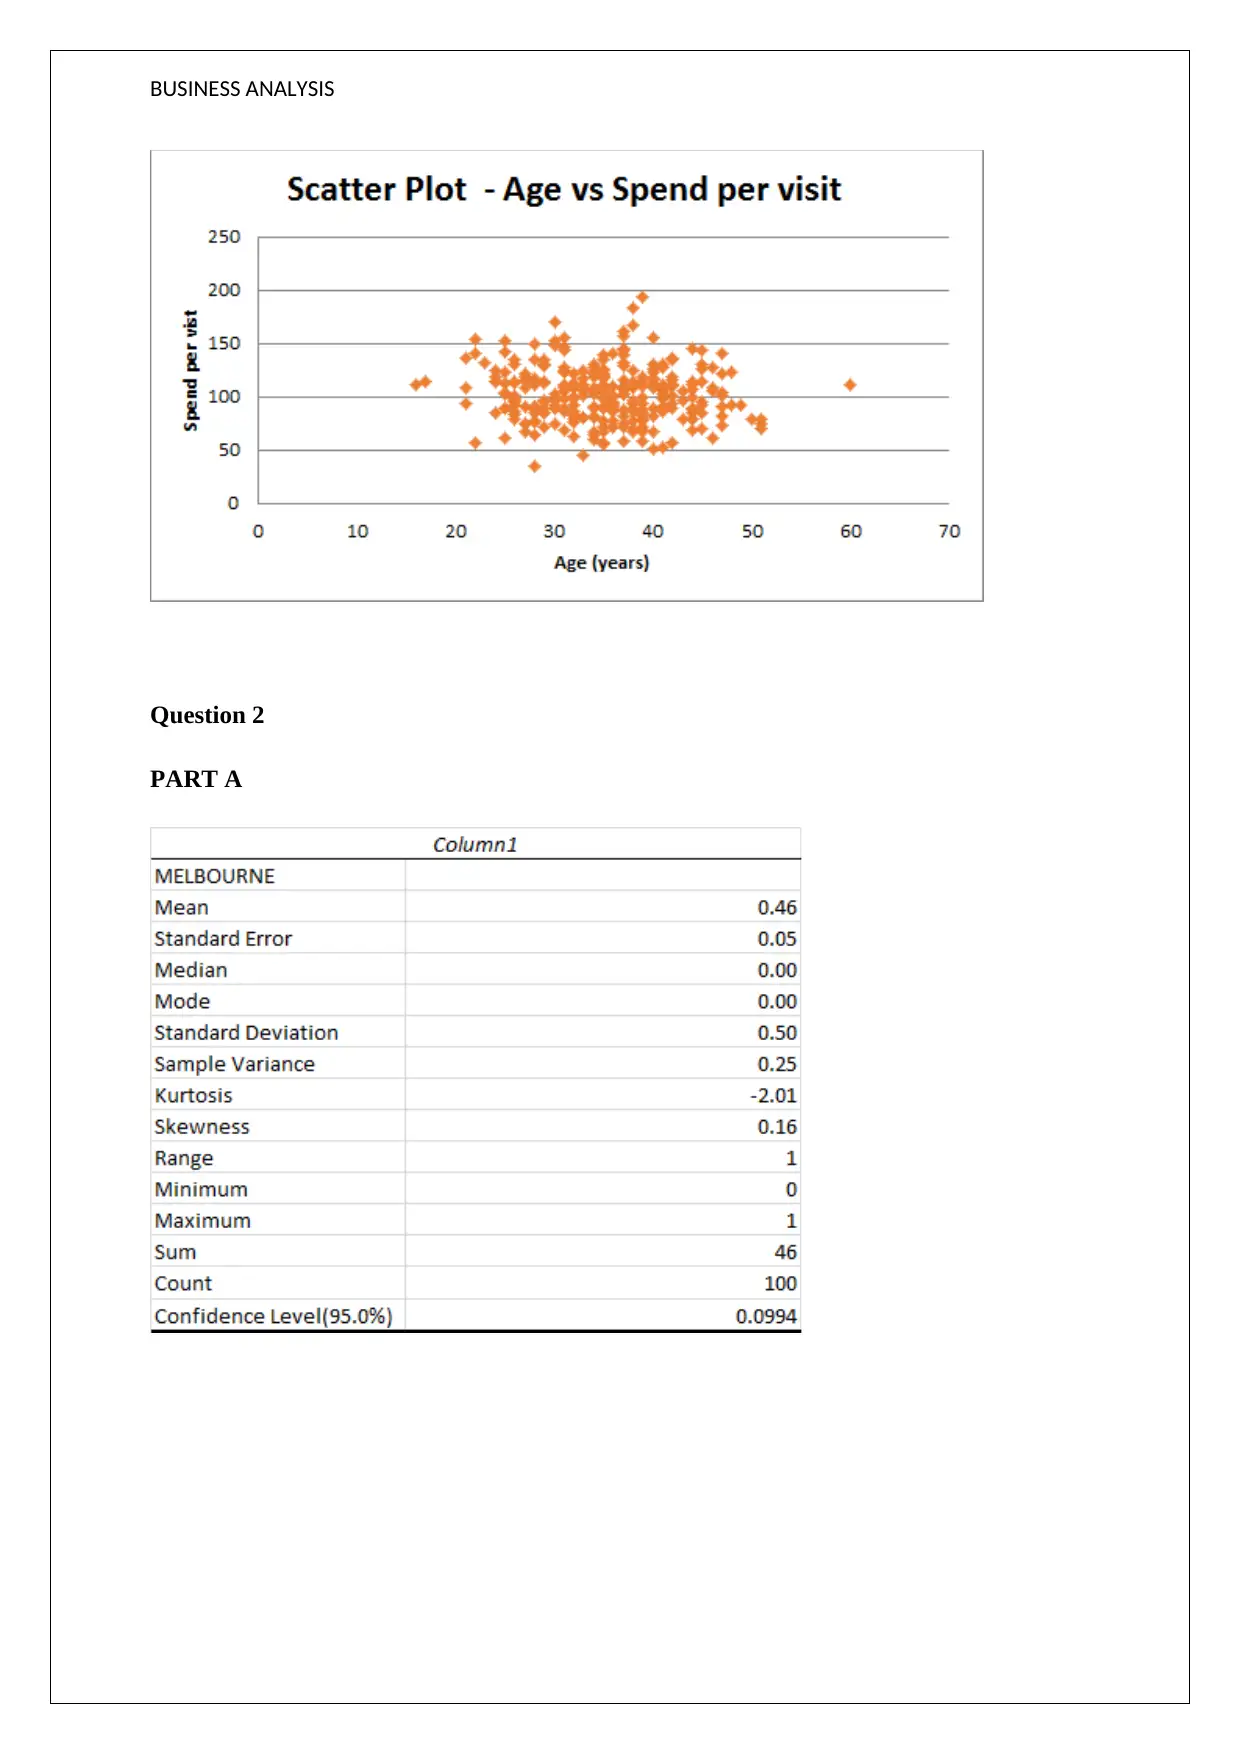
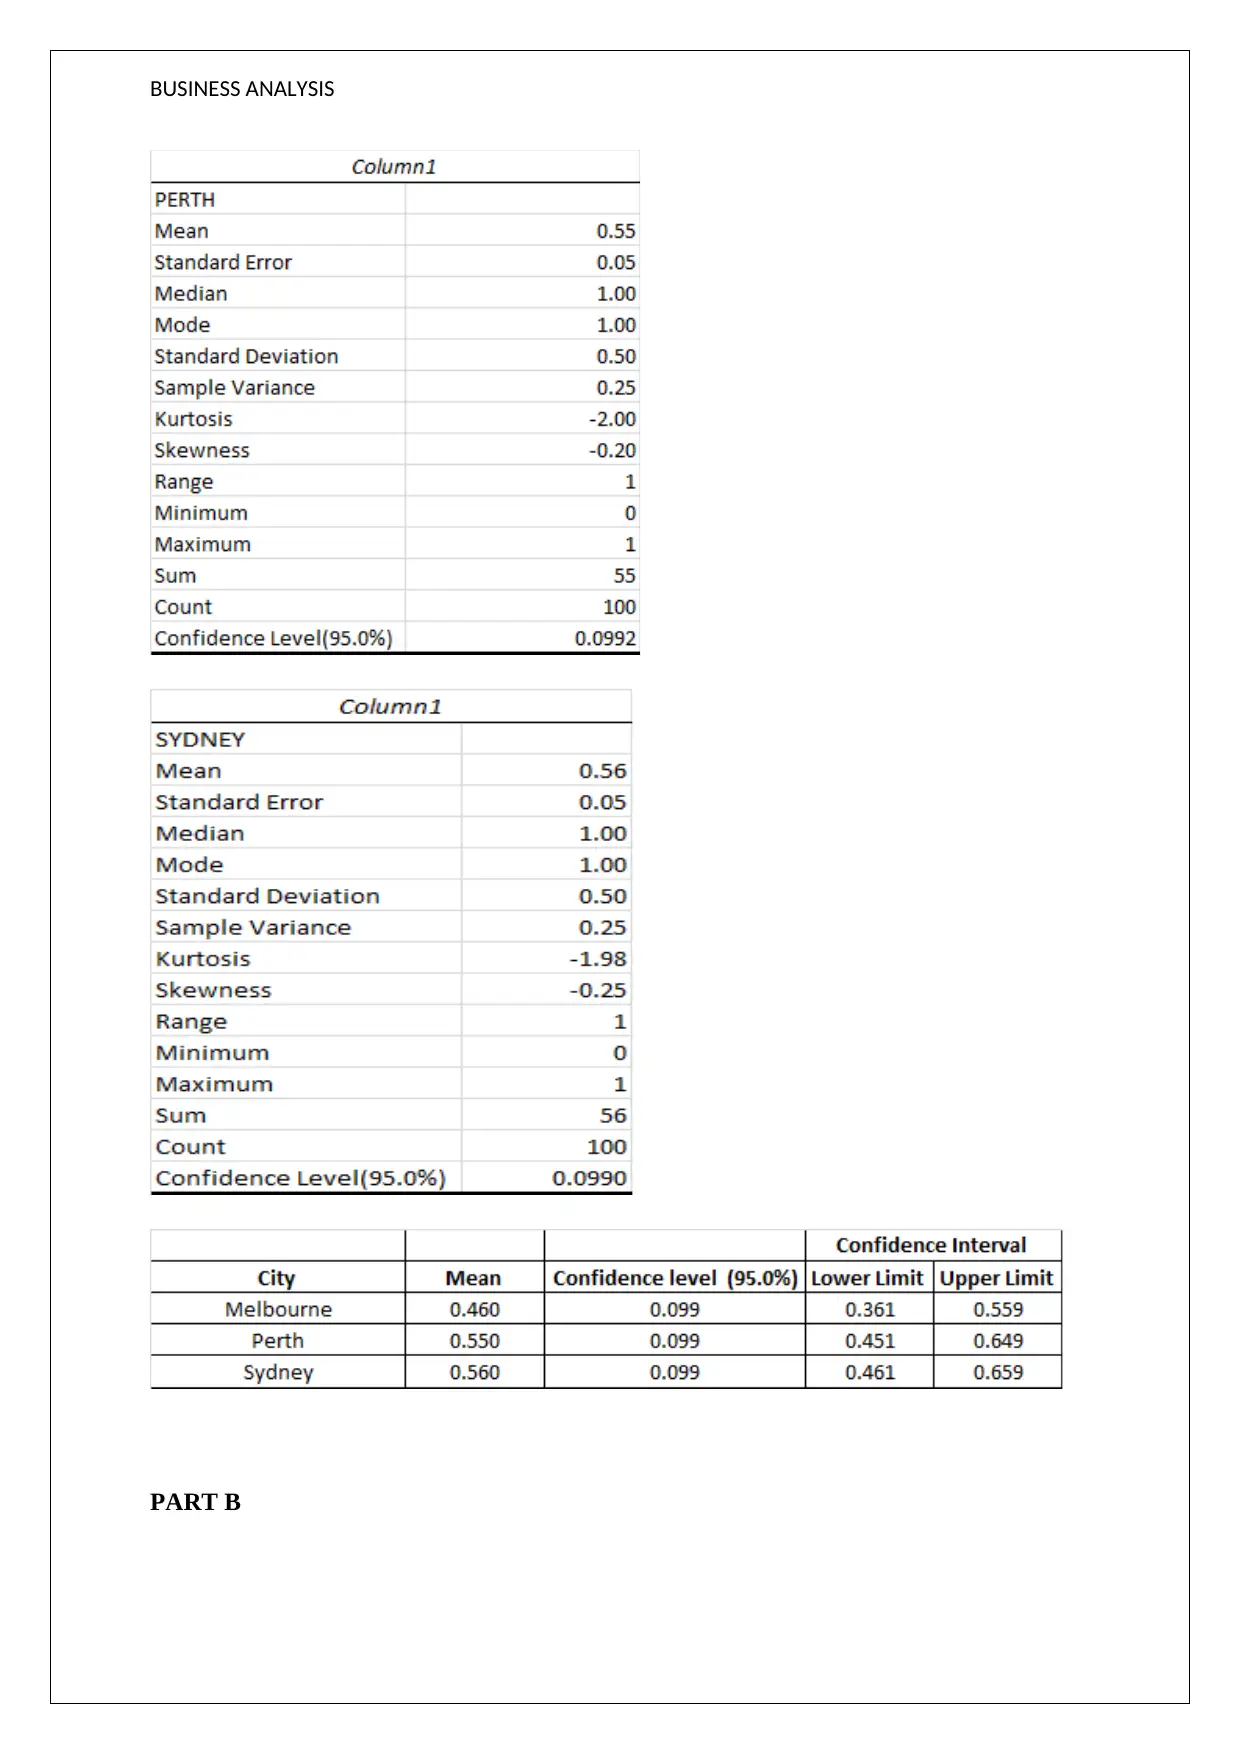
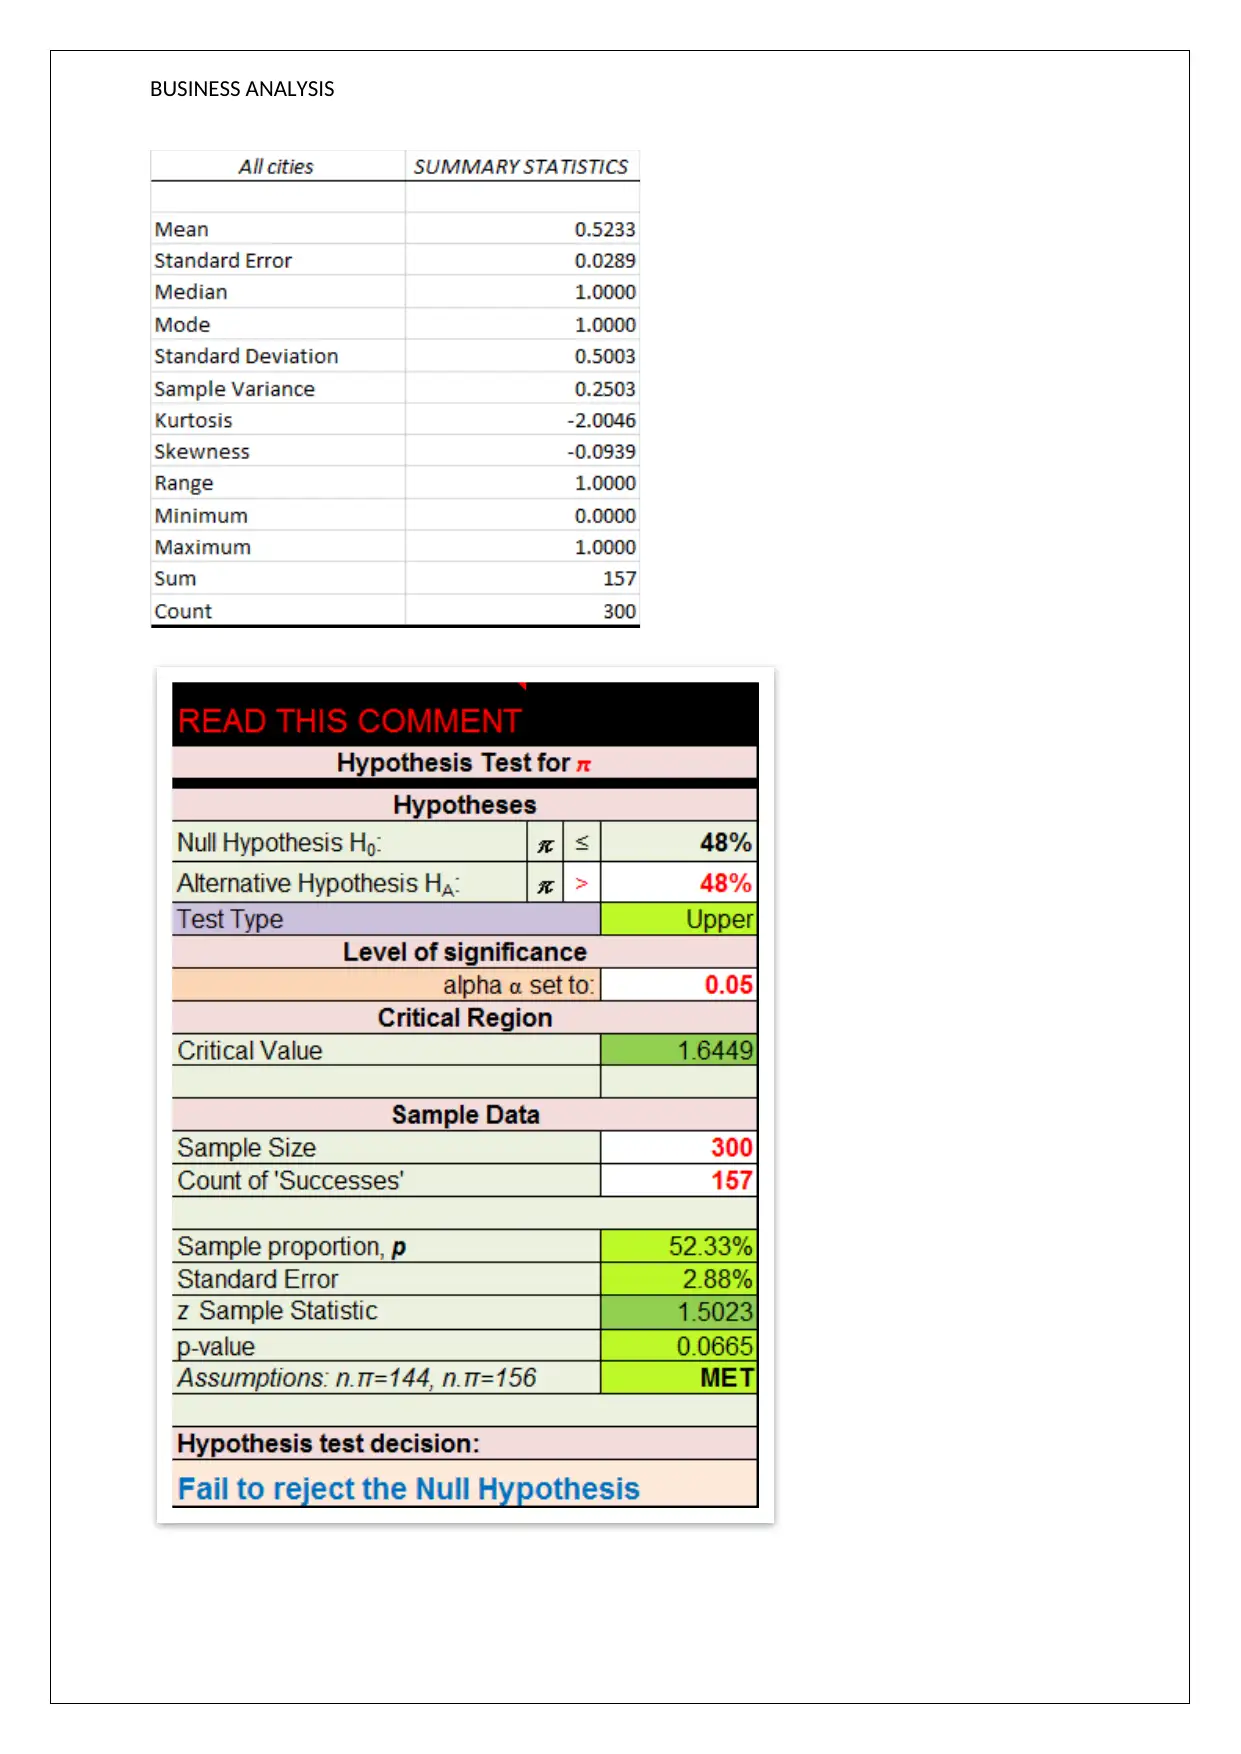
This report analyzes data from the BLITZ Department Store, focusing on customer demographics, spending habits, and shopping behavior. Part 1 includes an email summarizing the statistical analysis of survey data. It covers customer age distribution, comparison of customer age across different cities (Melbourne, Perth, and Sydney), and the relationship between age and spending. The report also examines the proportion of customers shopping in the beauty section, including confidence intervals for each city and the probability of a customer shopping in the beauty section based on their gender. Part 2 presents the Excel output for the analysis, providing a comprehensive view of the data and findings. The analysis uses inferential statistical tests to draw conclusions and recommendations based on the survey data.
Document Page
BUSINESS ANALYSIS
STUDENT ID:
[Pick the date]
tabler-icon-diamond-filled.svg

Paraphrase This Document

Need a fresh take? Get an instant paraphrase of this document with our AI Paraphraser
Document Page
BUSINESS ANALYSIS
PART 1: Email
To: Jacintu Liu
From: Alex Cassidy
Subject: Re: Analysis of the BLITZ Department store data
Dear Jacintu
Pursuant to your mail with regards to questions that the marketing department have, I have
conducted statistical analysis based on the survey data provided. The findings in this regard
are highlighted below.
1a) The average age of the customers based on the given sample is 35 years. Also, the age
variable seems to be normally distributed as the presence of skew is negligible and also there
is convergence in the various measures of central tendency. About 52% of the customers in
the survey were in the age group of 30-40 years while 26% customers belonged to the 20-30
age group and 20% to the 40-50 age group. This implies that about 95% of the customers lie
in the age group of 20-50 years.
b) On the basis of the inferential data analysis test, it is apparent that the mean age of
customers in the three cities tends to differ. The same is also highlighted from the survey data
where the average age of customers from Perth (37.14 years) seems significantly higher than
the average age of customers from Melbourne (33.99 years) or Sydney (33.92 years).
c) A inferential statistical test was applied to test the claim but the evidence obtained from the
survey data was not sufficient to support the claim. It can be claimed with 95% likelihood the
average amount spent by the customer per visit would not be less than $ 105.
d) There does not seem to be any significant relationship between the money spent per visit
and the age of the customer. Hence, it may be concluded that money spent per visit is not
influenced by the underlying age.
Document Page
BUSINESS ANALYSIS
2a) Based on the basis of the survey data given, for all the three cities (i.e. Melbourne, Perth
& Sydney), the proportion of customers who shopped in the beauty section can be estimated.
For Melbourne city, it may be concluded with 95% likelihood that the proportion of shoppers
who shop in the beauty section would lie between 36.1% and 55.9%. For Perth city, it may be
concluded with 95% likelihood that the proportion of shoppers who shop in the beauty
section would lie between 45.1% and 64.9%. For Sydney city, it may be concluded with 95%
likelihood that the proportion of shoppers who shop in the beauty section would lie between
46.1% and 65.9%.
b) Based on the inferential statistical test deployed, there seems to be insufficient evidence to
support the claim that more than 48% of all shoppers tend to shop in the beauty section.
Hence, there is 95% likelihood that the given claim is not true.
c) Assuming that the given customer is a female, there is 78.09% probability that she would
shop in the beauty section.
d) If the given customer is a male, the corresponding probability that he would shop in the
beauty section is 14.75%. There is huge disparity in the beauty section shopping behaviour
which clearly indicates that there the two variables gender and beauty section shopping
behaviour are not independent.
In case of any further queries regarding the above analysis, please feel free to contact me.
Yours Sincerely
Alex
Document Page
BUSINESS ANALYSIS
PART 2: EXCEL OUTPUT
Question 1
Part A
tabler-icon-diamond-filled.svg

Paraphrase This Document

Need a fresh take? Get an instant paraphrase of this document with our AI Paraphraser
Document Page
BUSINESS ANALYSIS
PART B
PART C
Document Page
BUSINESS ANALYSIS
PART D
Document Page
BUSINESS ANALYSIS
Question 2
PART A
tabler-icon-diamond-filled.svg

Paraphrase This Document

Need a fresh take? Get an instant paraphrase of this document with our AI Paraphraser
Document Page
BUSINESS ANALYSIS
PART B
Document Page
BUSINESS ANALYSIS
chevron_up_icon
1 out of 9
circle_padding
hide_on_mobile
zoom_out_icon
[object Object]