Using Data to Build Business Practice: Data Analysis Report
VerifiedAdded on 2020/10/23
|13
|3141
|337
Report
AI Summary
This report provides a comprehensive data analysis of travel patterns in the UK during the third quarter of 2017, utilizing data from the International Passenger Survey. The analysis involves the categorization of passenger data based on various factors such as residential status, mode of travel, purpose of visit, and demographics. The study employs statistical tools to summarize and interpret the data, focusing on descriptive analysis to identify key performance indicators (KPIs) and trends. The report also explores the application of business decision-making tools like SWOT and feasibility analysis, offering insights into how data can inform strategic choices within the tourism sector. The results section presents detailed statistical summaries, including mean, median, and mode values for different variables. The report concludes with recommendations derived from the data analysis, offering valuable insights for businesses seeking to understand and optimize their practices based on consumer behavior.

Using Data to Build
Business Practice
Business Practice
Paraphrase This Document
Need a fresh take? Get an instant paraphrase of this document with our AI Paraphraser
Table of Contents
INTRODUCTION...........................................................................................................................1
MAIN BODY...................................................................................................................................1
Analysis of data in Travel Pac for understanding the pattern of travel of UK residents in third
quarter.........................................................................................................................................1
Tool and techniques of common business decision making.......................................................2
Summarising and interpreting data.............................................................................................3
Results.........................................................................................................................................7
Recommendation.........................................................................................................................8
CONCLUSION................................................................................................................................9

⊘ This is a preview!⊘
Do you want full access?
Subscribe today to unlock all pages.
Trusted by 1+ million students worldwide
INTRODUCTION
Data analysis is the term under which various types of data and information gathered from
different sources is bring interpreted and evaluations are made to reach an effective outcome form
the data. Data analysis can be done through various methods and by use of different tool which
includes statistical and mathematical tools. For the present report the data relevant to the sales of
third quarter of 2017 which is collected by the organisation International Passenger Survey over
passengers and travellers visiting UK. In this respect a detailed analysis of the data is carried out
with use of statistical tool and then the same is interpreted to present and highlight the outcomes
regarding the travel in UK with considering various categories.
MAIN BODY
Analysis of data in Travel Pac for understanding the pattern of travel of UK residents in third
quarter
The data which is collected by the International Passenger Survey have used different categories
to bifurcate the passenger data into different headings. There are total 14 categories which is
divided into continuous and categorical variables. Under all this variables the data is collected on
specified criteria which depended on the the circumstances and natural presences of the
categories. These are:
Year: A years is a period of 12 months which starts from the month of January and ends
with the last day of December month. For the preset data the year for collection of information is
taken as year 2017 over which the data related to the traveller in UK is gathered.
Quarter: Quarters is a time period of 3 months in a year with a total of 4 quarters in a
year. The first quarters starts with January and ends in march and this continues till the last
quarter ending in month on December (Silverman, 2018). Over the passenger data third quarter
of year 2107 is selected which start in month on July and ends in September.
Passenger's residential status: This is the category which defines the residential status
of the traveller. In the given data he resident are divided into to section only. One is defined as
UK residents and those who are from other nations are defined as Oversea resident.
Mode of travelling: is the one route and mode of travelling used by the passengers to
visit UK. The methods of travel used by travellers visiting UK are broadly classified in 3
1
Paraphrase This Document
Need a fresh take? Get an instant paraphrase of this document with our AI Paraphraser
sections. These are air, sea or tunnel. This means the passenger have came to UK by these three
mode of travelling only.
Purpose of Visit: can be defined as the motive and intention behind visit ng UK in
specific quarter of a particular year. This is divided into different categories including, holiday,
VFR, business, study and miscellaneous.
Packages: means the travelling mode of passengers which can either be along with a
package tour or they have travelled independently. The travellers who are not along with any
package tour are identifies as independent (Wickham, 2016). Those who have came along a tour
package are categorised as non independent.
Gender: this is a section which do not require to set a criteria to set a category of the
traveller, this is a natural one where the travellers are identifies as male and female.
Age: criteria defines the age of the travel that is a travel belong to which age group and
where it fits under the specific section of this data. In the present data the different section of age
are made which are. 0-15, 16-24, 25-34, 35-44, 45-54, 55-64 and 65 & over. This can be seen the
age group is set with a interval of 10 years with setting 7 gage groups of travellers.
Duration: defines the time and days traveller stayed in UK for the purpose of visiting the
nation. The categorises of duration is set as 1-3, 4-13, 14-27, 28-90 nights, nil stay, stay not
known , 3-6 month and 6 Months to year. The stay is defined from a single day stay to a stay for
whole year.
Sample size: is the range of the sample for each category over which data is collected
under different section. The sample range for this data is from 1-76, which collecting data from
total sample of 25180 travellers who have visiting UK in third quarter of 2017.
Tool and techniques of common business decision making
The tools and techniques used by the management of a business for managing strategic
decision. The data gathered by IPS is related with traveller visiting UK with different purpose,
belong to different age, country, duration of stay, packages and modes of travelling. All this
information is analysed by use of statistical tool and final evaluation made can be used aid the
decision making process (Agresti, 2018). The different type of tools and techniques which are
used for business decision making are:
SWOT Analysis:
2
With SWOT analysis is a strategic tool which assist in determining the strength and
weaknesses of IPS. Along with this threats and opportunities which tourism business can fact are
identified. This helps business to take advantages of their strength and implement strategies to
reduce weaknesses to convert them into strengths (Chambers, 2017). With assessing he external
opportunities and threats the decision making becomes more precise at the business knows the
presence of competition and other condition that can effect the business both adversely as well as
positively.
Feasibility Analysis:
A feasibility study or feasibility analysis is a business-planning tool that involves
assessing whether a certain project or goal can actually be created or achieved and whether the
project can make a profit ((Mitzenmacher and Upfal, 2017). A feasibility analysis can help
entrepreneurs in the beginning planning stages of launching a company decide whether to pursue
a certain opportunity or not.
With the above tools and techniques the IPS and other business can use the information
and identity the various aspects and then use them in taking a business decision in right direction.
Summarising and interpreting data
Method Used or interpretation of data:
The data analysis is a process through which data gathered over a particular subject
matters is analyses with used of statistical and mathematical tools. For the present data over UK
travellers descriptive analysis is used to analyse the data. Descriptive analysis answers the “what
happened” by summarizing past data usually in the form of dashboards (Menke, 2018). The
biggest use of descriptive analysis in business is to track Key Performance Indicators (KPI’s).
KPI’s describe how a business is performing based on chosen benchmarks (Descriptive Statistics,
2019).
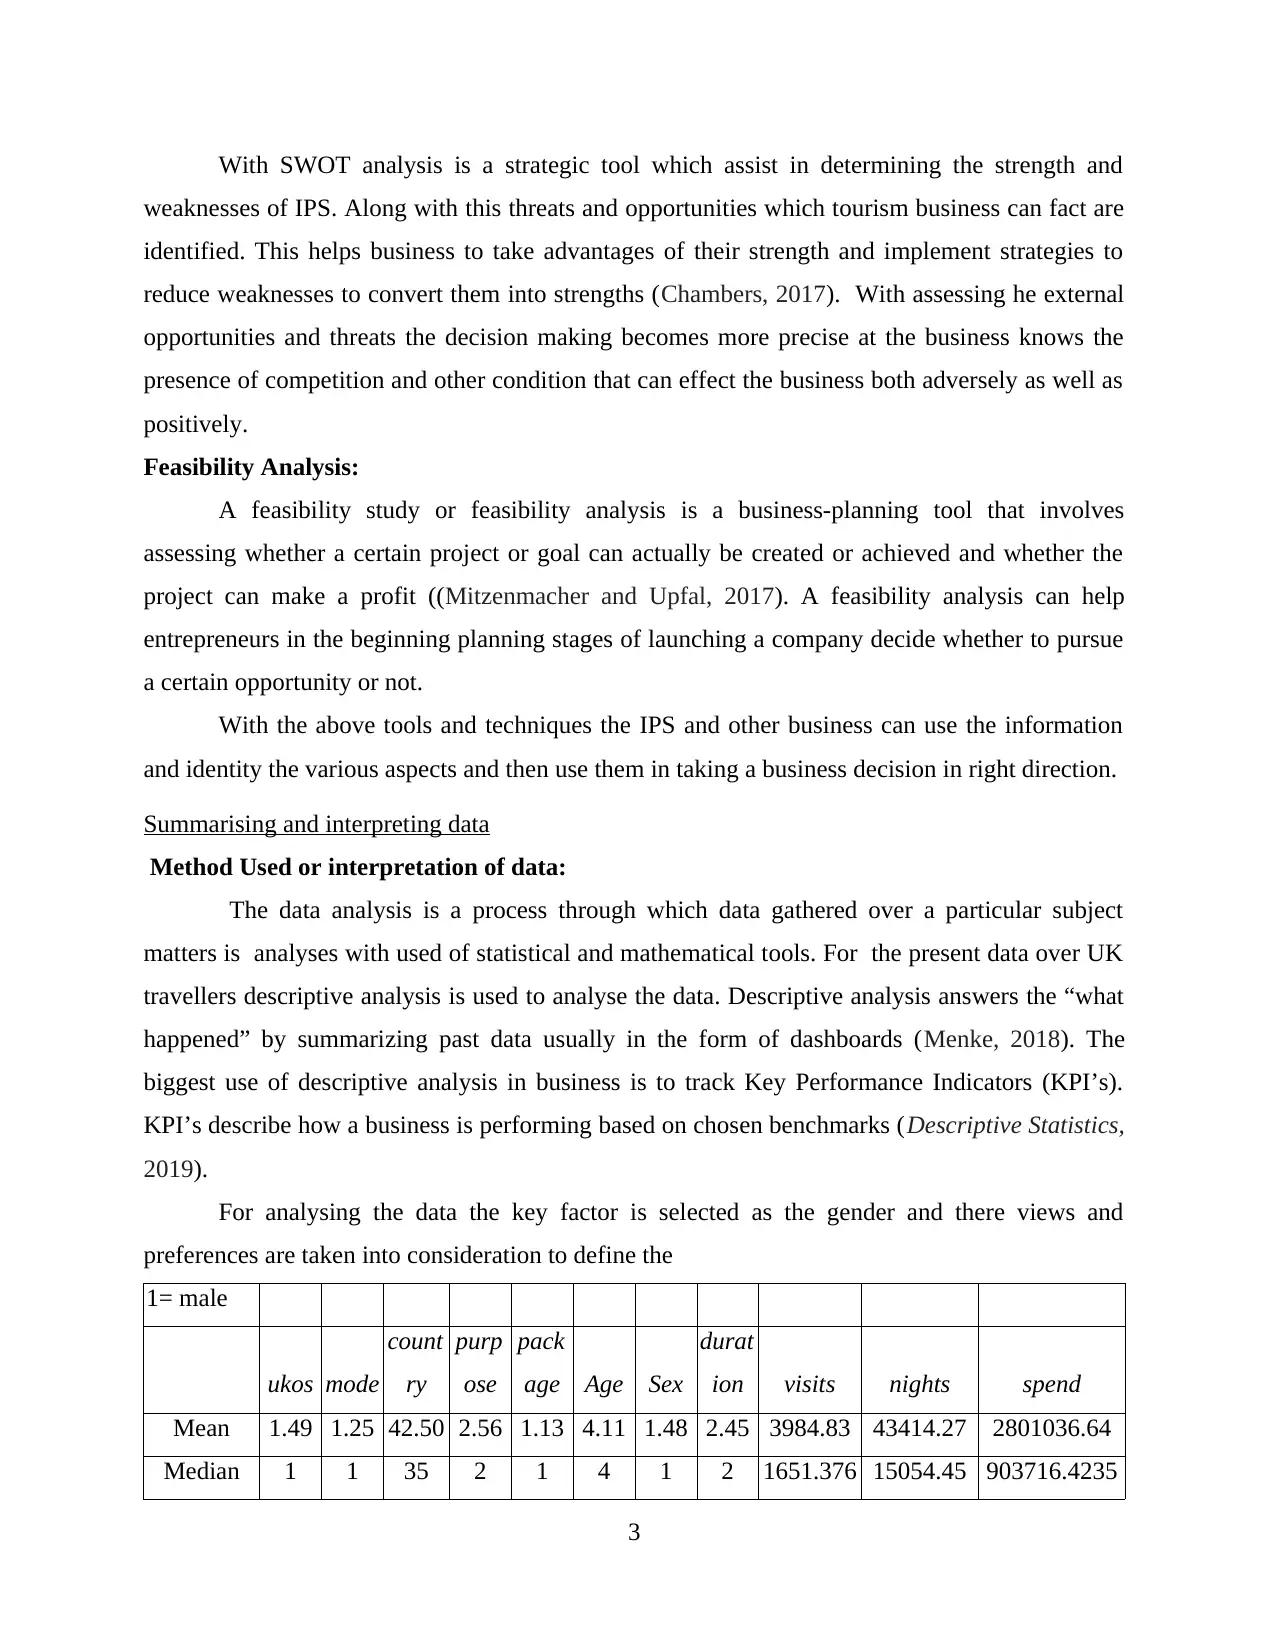
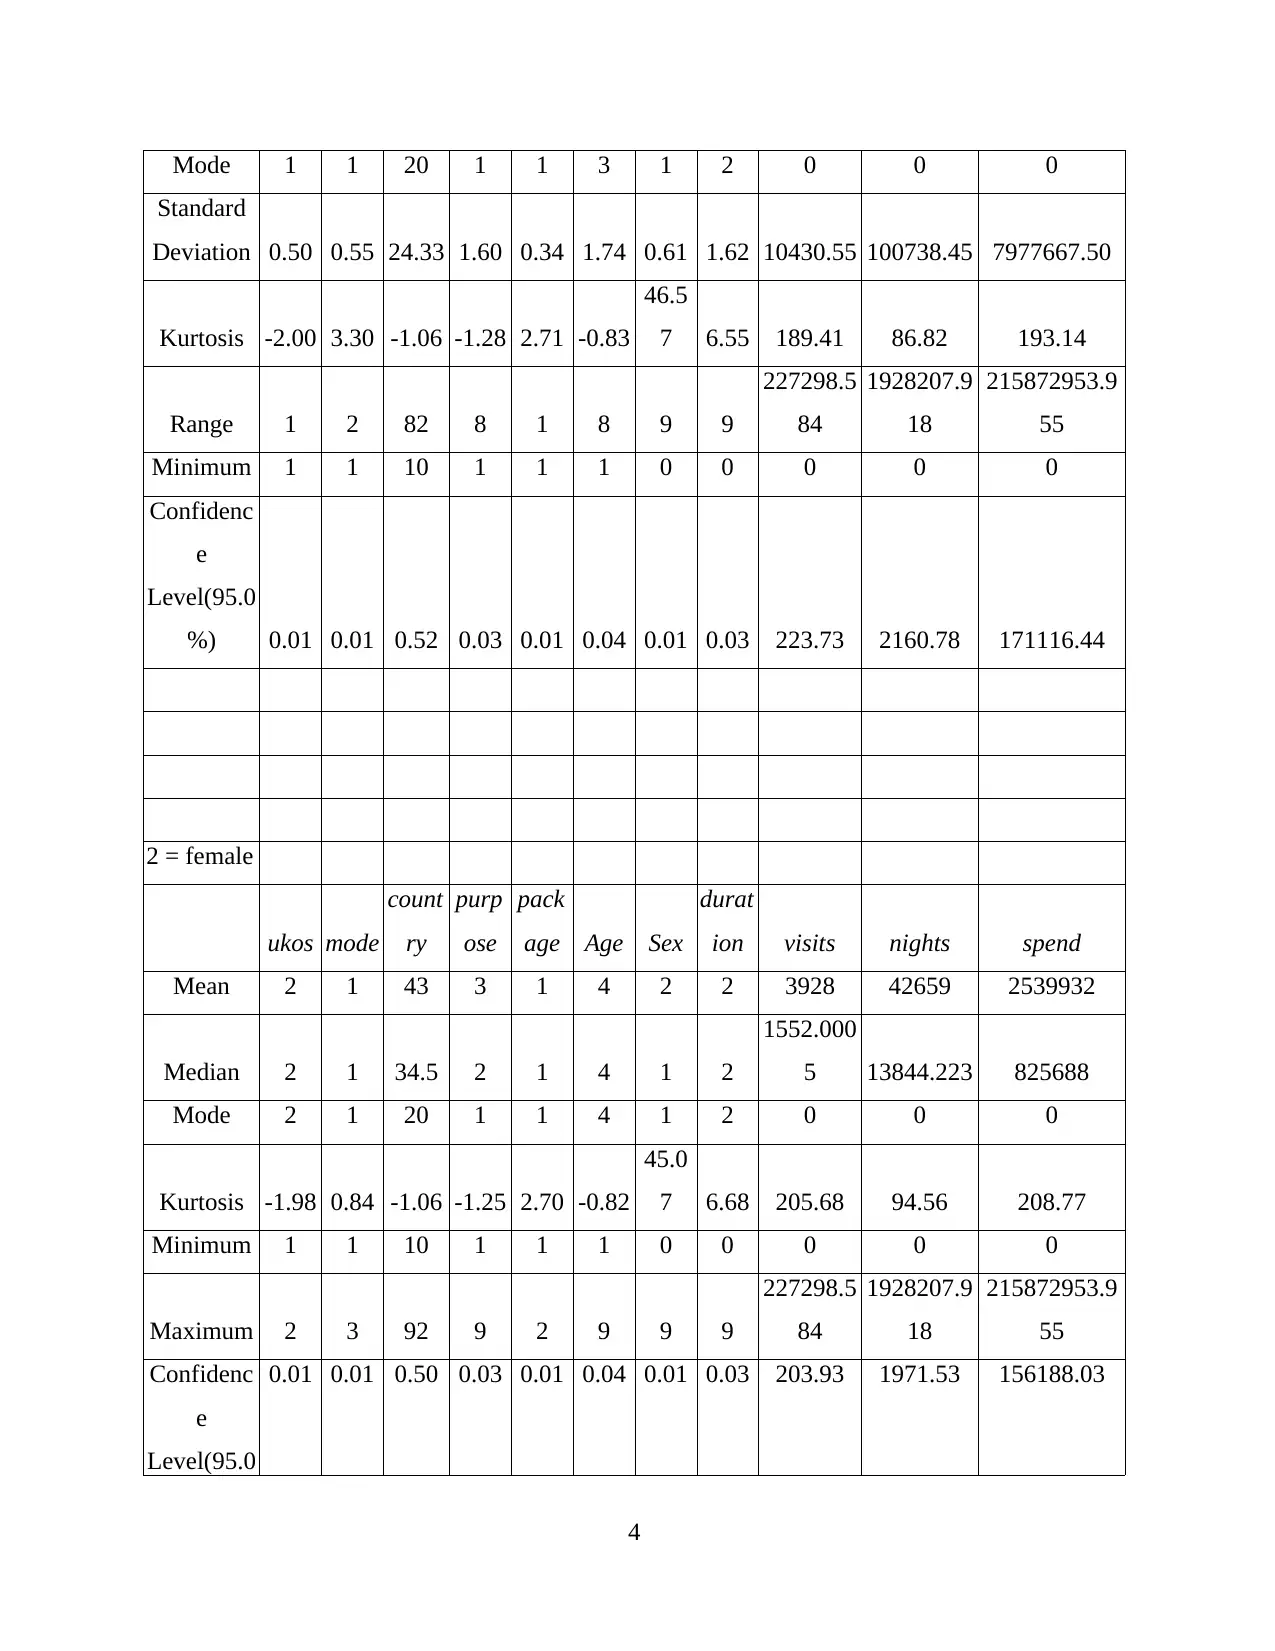
For analysing the data the key factor is selected as the gender and there views and
preferences are taken into consideration to define the
1= male
ukos mode
count
ry
purp
ose
pack
age Age Sex
durat
ion visits nights spend
Mean 1.49 1.25 42.50 2.56 1.13 4.11 1.48 2.45 3984.83 43414.27 2801036.64
Median 1 1 35 2 1 4 1 2 1651.376 15054.45 903716.4235
3
weaknesses of IPS. Along with this threats and opportunities which tourism business can fact are
identified. This helps business to take advantages of their strength and implement strategies to
reduce weaknesses to convert them into strengths (Chambers, 2017). With assessing he external
opportunities and threats the decision making becomes more precise at the business knows the
presence of competition and other condition that can effect the business both adversely as well as
positively.
Feasibility Analysis:
A feasibility study or feasibility analysis is a business-planning tool that involves
assessing whether a certain project or goal can actually be created or achieved and whether the
project can make a profit ((Mitzenmacher and Upfal, 2017). A feasibility analysis can help
entrepreneurs in the beginning planning stages of launching a company decide whether to pursue
a certain opportunity or not.
With the above tools and techniques the IPS and other business can use the information
and identity the various aspects and then use them in taking a business decision in right direction.
Summarising and interpreting data
Method Used or interpretation of data:
The data analysis is a process through which data gathered over a particular subject
matters is analyses with used of statistical and mathematical tools. For the present data over UK
travellers descriptive analysis is used to analyse the data. Descriptive analysis answers the “what
happened” by summarizing past data usually in the form of dashboards (Menke, 2018). The
biggest use of descriptive analysis in business is to track Key Performance Indicators (KPI’s).
KPI’s describe how a business is performing based on chosen benchmarks (Descriptive Statistics,
2019).
For analysing the data the key factor is selected as the gender and there views and
preferences are taken into consideration to define the
1= male
ukos mode
count
ry
purp
ose
pack
age Age Sex
durat
ion visits nights spend
Mean 1.49 1.25 42.50 2.56 1.13 4.11 1.48 2.45 3984.83 43414.27 2801036.64
Median 1 1 35 2 1 4 1 2 1651.376 15054.45 903716.4235
3
⊘ This is a preview!⊘
Do you want full access?
Subscribe today to unlock all pages.
Trusted by 1+ million students worldwide
Mode 1 1 20 1 1 3 1 2 0 0 0
Standard
Deviation 0.50 0.55 24.33 1.60 0.34 1.74 0.61 1.62 10430.55 100738.45 7977667.50
Kurtosis -2.00 3.30 -1.06 -1.28 2.71 -0.83
46.5
7 6.55 189.41 86.82 193.14
Range 1 2 82 8 1 8 9 9
227298.5
84
1928207.9
18
215872953.9
55
Minimum 1 1 10 1 1 1 0 0 0 0 0
Confidenc
e
Level(95.0
%) 0.01 0.01 0.52 0.03 0.01 0.04 0.01 0.03 223.73 2160.78 171116.44
2 = female
ukos mode
count
ry
purp
ose
pack
age Age Sex
durat
ion visits nights spend
Mean 2 1 43 3 1 4 2 2 3928 42659 2539932
Median 2 1 34.5 2 1 4 1 2
1552.000
5 13844.223 825688
Mode 2 1 20 1 1 4 1 2 0 0 0
Kurtosis -1.98 0.84 -1.06 -1.25 2.70 -0.82
45.0
7 6.68 205.68 94.56 208.77
Minimum 1 1 10 1 1 1 0 0 0 0 0
Maximum 2 3 92 9 2 9 9 9
227298.5
84
1928207.9
18
215872953.9
55
Confidenc
e
Level(95.0
0.01 0.01 0.50 0.03 0.01 0.04 0.01 0.03 203.93 1971.53 156188.03
4
Paraphrase This Document
Need a fresh take? Get an instant paraphrase of this document with our AI Paraphraser
%)
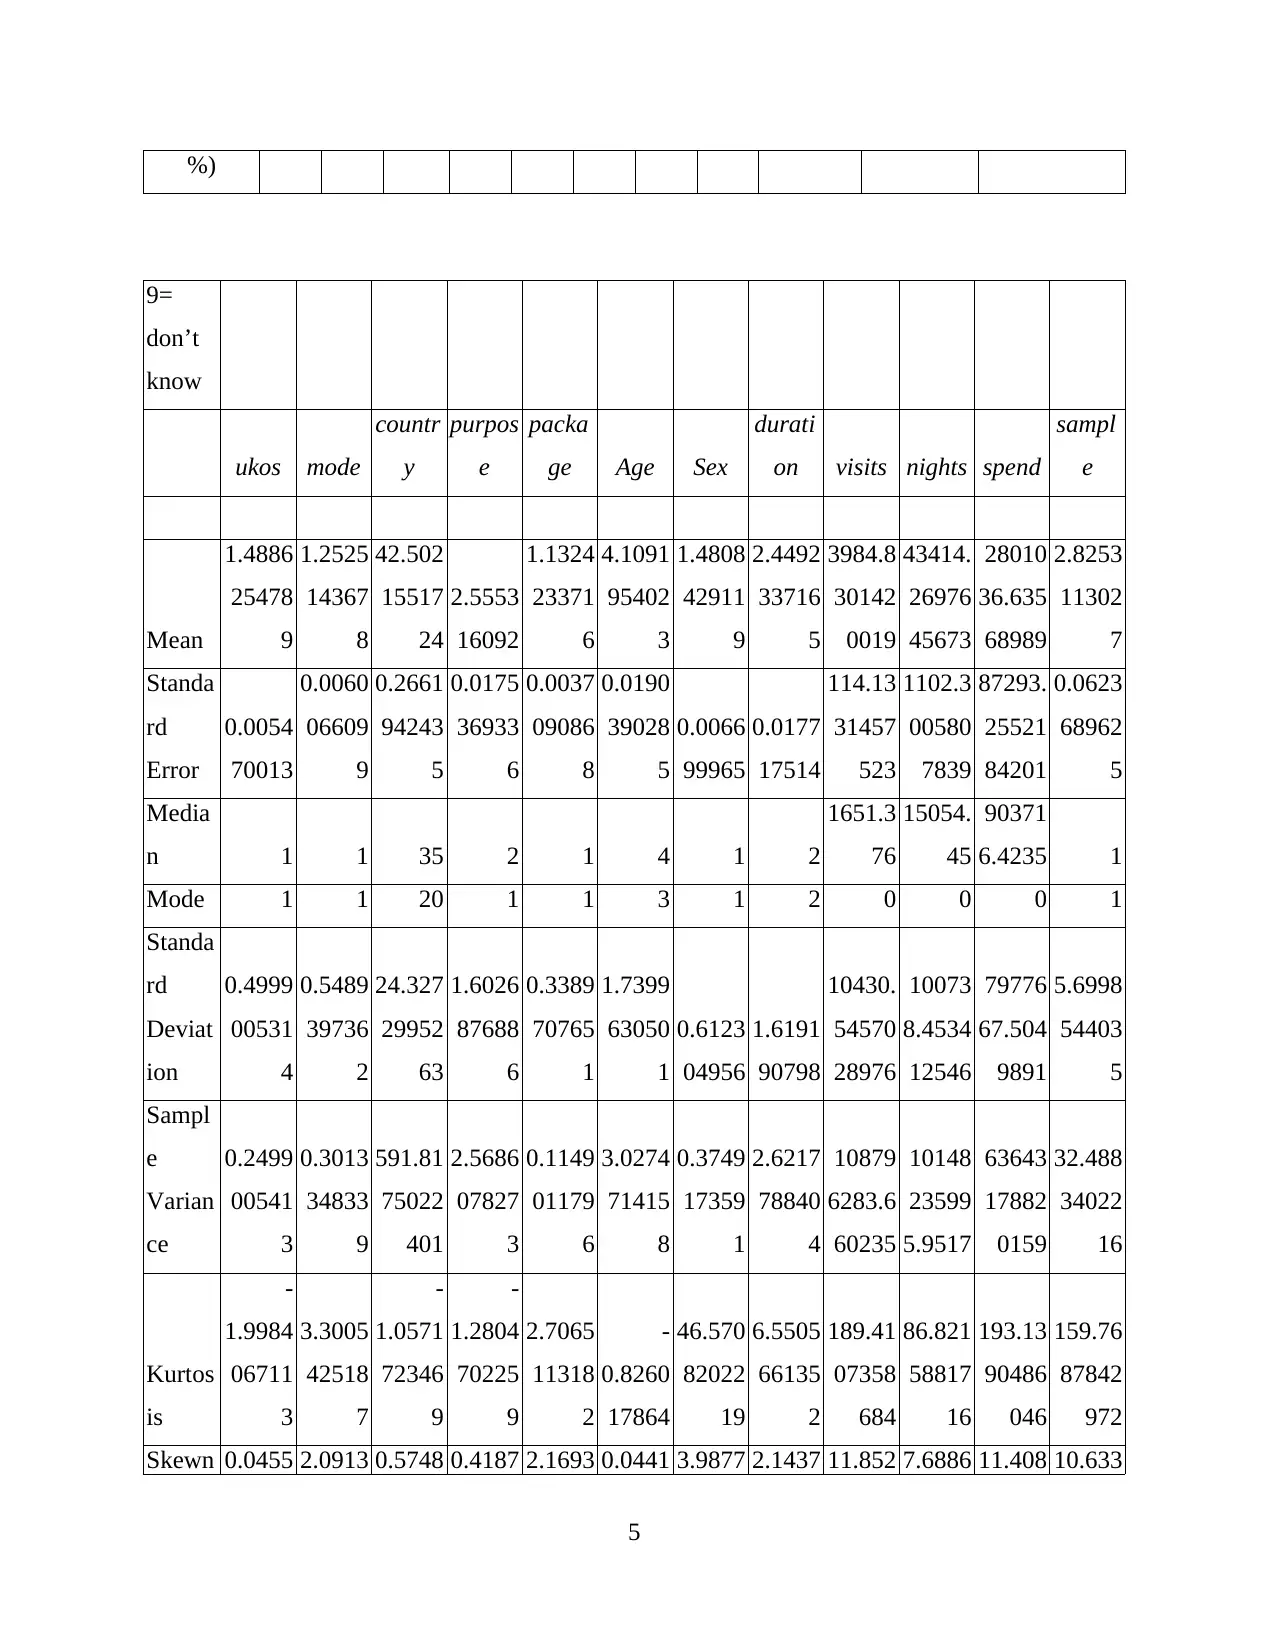
9=
don’t
know
ukos mode
countr
y
purpos
e
packa
ge Age Sex
durati
on visits nights spend
sampl
e
Mean
1.4886
25478
9
1.2525
14367
8
42.502
15517
24
2.5553
16092
1.1324
23371
6
4.1091
95402
3
1.4808
42911
9
2.4492
33716
5
3984.8
30142
0019
43414.
26976
45673
28010
36.635
68989
2.8253
11302
7
Standa
rd
Error
0.0054
70013
0.0060
06609
9
0.2661
94243
5
0.0175
36933
6
0.0037
09086
8
0.0190
39028
5
0.0066
99965
0.0177
17514
114.13
31457
523
1102.3
00580
7839
87293.
25521
84201
0.0623
68962
5
Media
n 1 1 35 2 1 4 1 2
1651.3
76
15054.
45
90371
6.4235 1
Mode 1 1 20 1 1 3 1 2 0 0 0 1
Standa
rd
Deviat
ion
0.4999
00531
4
0.5489
39736
2
24.327
29952
63
1.6026
87688
6
0.3389
70765
1
1.7399
63050
1
0.6123
04956
1.6191
90798
10430.
54570
28976
10073
8.4534
12546
79776
67.504
9891
5.6998
54403
5
Sampl
e
Varian
ce
0.2499
00541
3
0.3013
34833
9
591.81
75022
401
2.5686
07827
3
0.1149
01179
6
3.0274
71415
8
0.3749
17359
1
2.6217
78840
4
10879
6283.6
60235
10148
23599
5.9517
63643
17882
0159
32.488
34022
16
Kurtos
is
-
1.9984
06711
3
3.3005
42518
7
-
1.0571
72346
9
-
1.2804
70225
9
2.7065
11318
2
-
0.8260
17864
46.570
82022
19
6.5505
66135
2
189.41
07358
684
86.821
58817
16
193.13
90486
046
159.76
87842
972
Skewn 0.0455 2.0913 0.5748 0.4187 2.1693 0.0441 3.9877 2.1437 11.852 7.6886 11.408 10.633
5
ess
18037
3 15789 57925
47968
3
00178
5
78231
6
31605
8
21808
4
55495
66
43023
3
97067
55
15270
11
Range 1 2 82 8 1 8 9 9
22729
8.584
19282
07.918
21587
2953.9
55 125
Minim
um 1 1 10 1 1 1 0 0 0 0 0 0
Maxi
mum
2 3 92 9 2 9 9 9
22729
8.584
19282
07.918
21587
2953.9
55
125
Sum 12433 10461
35497
8 21342 9458 34320 12368 20456
33281
301.34
59996
36259
5981.0
73666
23394
25798
1.2819 23597
Count 8352 8352 8352 8352 8352 8352 8352 8352 8352 8352 8352 8352
Confid
ence
Level(
95.0%
)
0.0107
22582
5
0.0117
74445
6
0.5218
06758
8
0.0343
76740
7
0.0072
70730
4
0.0373
21219
3
0.0131
33593
6
0.0347
30723
223.72
92815
756
2160.7
82613
9686
17111
6.4372
77524
0.1222
58639
9
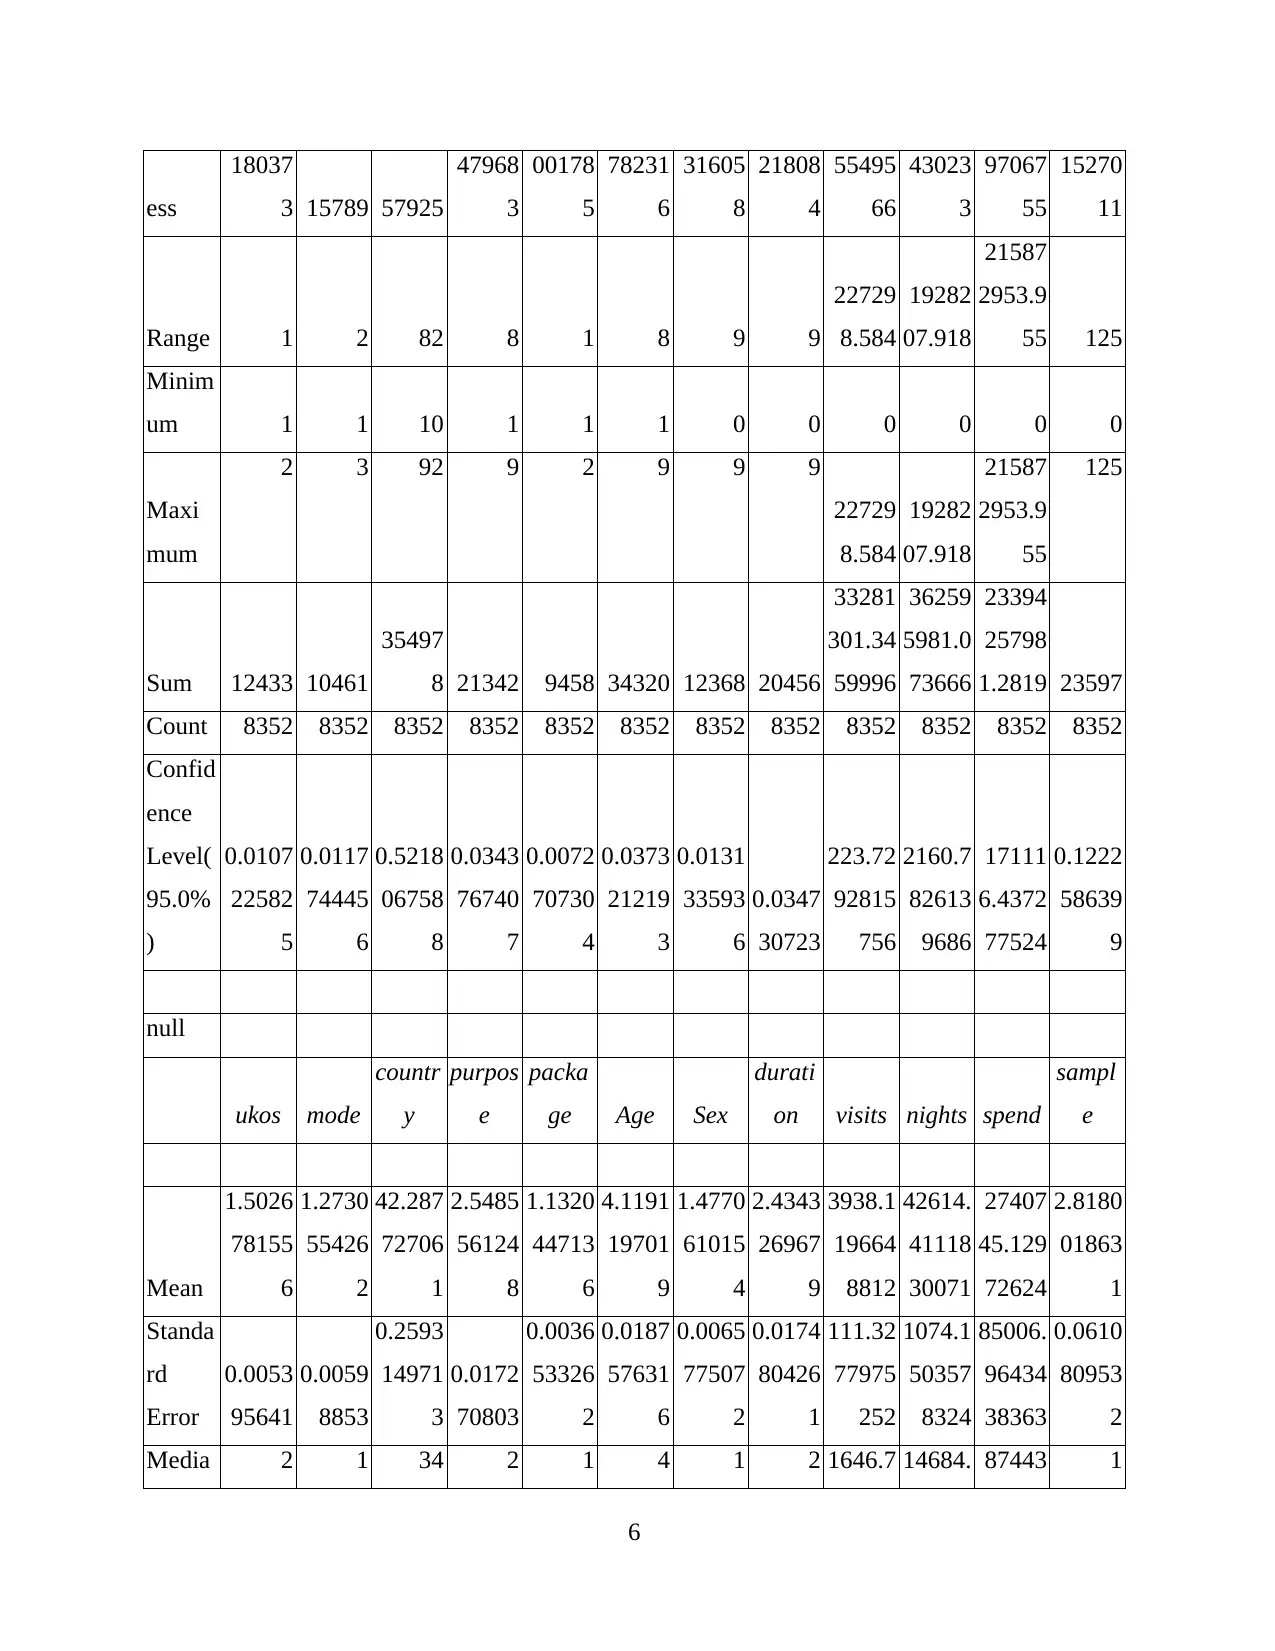
null
ukos mode
countr
y
purpos
e
packa
ge Age Sex
durati
on visits nights spend
sampl
e
Mean
1.5026
78155
6
1.2730
55426
2
42.287
72706
1
2.5485
56124
8
1.1320
44713
6
4.1191
19701
9
1.4770
61015
4
2.4343
26967
9
3938.1
19664
8812
42614.
41118
30071
27407
45.129
72624
2.8180
01863
1
Standa
rd
Error
0.0053
95641
0.0059
8853
0.2593
14971
3
0.0172
70803
0.0036
53326
2
0.0187
57631
6
0.0065
77507
2
0.0174
80426
1
111.32
77975
252
1074.1
50357
8324
85006.
96434
38363
0.0610
80953
2
Media 2 1 34 2 1 4 1 2 1646.7 14684. 87443 1
6
18037
3 15789 57925
47968
3
00178
5
78231
6
31605
8
21808
4
55495
66
43023
3
97067
55
15270
11
Range 1 2 82 8 1 8 9 9
22729
8.584
19282
07.918
21587
2953.9
55 125
Minim
um 1 1 10 1 1 1 0 0 0 0 0 0
Maxi
mum
2 3 92 9 2 9 9 9
22729
8.584
19282
07.918
21587
2953.9
55
125
Sum 12433 10461
35497
8 21342 9458 34320 12368 20456
33281
301.34
59996
36259
5981.0
73666
23394
25798
1.2819 23597
Count 8352 8352 8352 8352 8352 8352 8352 8352 8352 8352 8352 8352
Confid
ence
Level(
95.0%
)
0.0107
22582
5
0.0117
74445
6
0.5218
06758
8
0.0343
76740
7
0.0072
70730
4
0.0373
21219
3
0.0131
33593
6
0.0347
30723
223.72
92815
756
2160.7
82613
9686
17111
6.4372
77524
0.1222
58639
9
null
ukos mode
countr
y
purpos
e
packa
ge Age Sex
durati
on visits nights spend
sampl
e
Mean
1.5026
78155
6
1.2730
55426
2
42.287
72706
1
2.5485
56124
8
1.1320
44713
6
4.1191
19701
9
1.4770
61015
4
2.4343
26967
9
3938.1
19664
8812
42614.
41118
30071
27407
45.129
72624
2.8180
01863
1
Standa
rd
Error
0.0053
95641
0.0059
8853
0.2593
14971
3
0.0172
70803
0.0036
53326
2
0.0187
57631
6
0.0065
77507
2
0.0174
80426
1
111.32
77975
252
1074.1
50357
8324
85006.
96434
38363
0.0610
80953
2
Media 2 1 34 2 1 4 1 2 1646.7 14684. 87443 1
6
⊘ This is a preview!⊘
Do you want full access?
Subscribe today to unlock all pages.
Trusted by 1+ million students worldwide
n 69 674 9.307
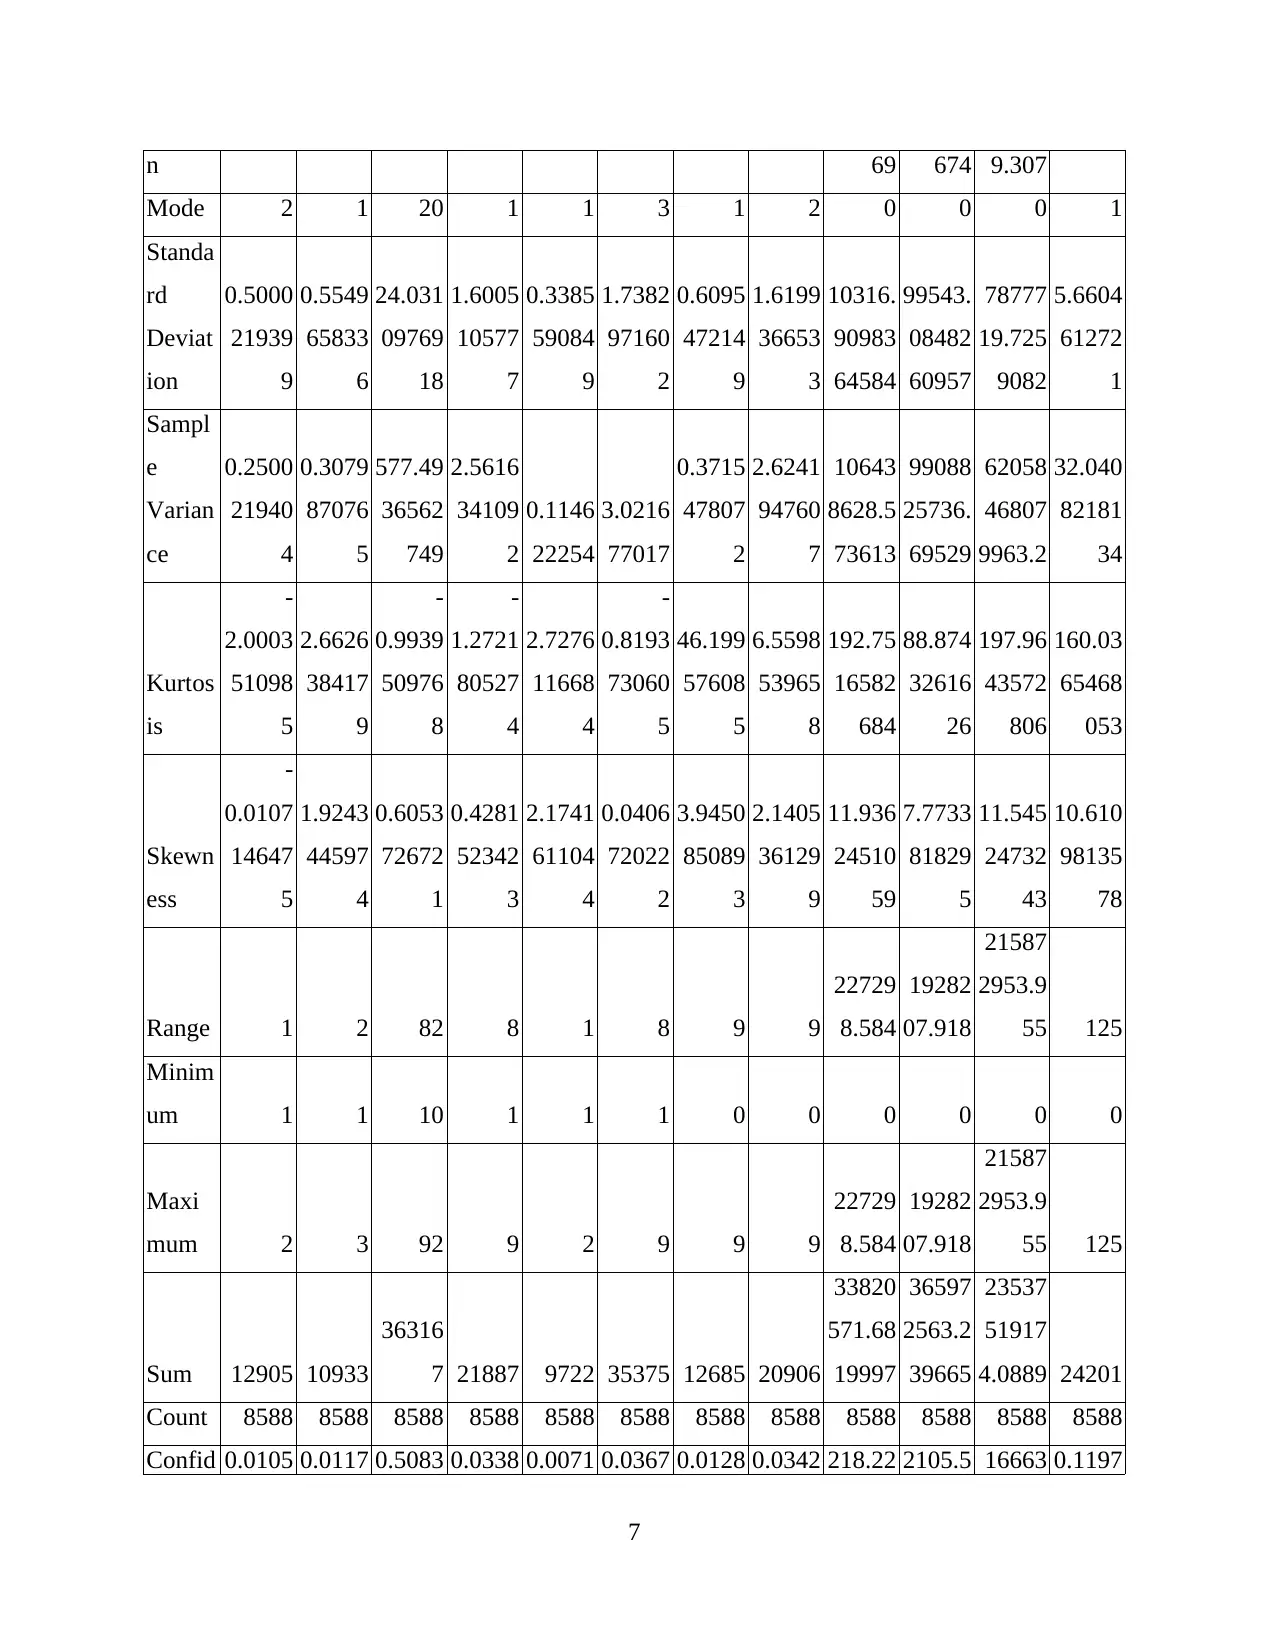
Mode 2 1 20 1 1 3 1 2 0 0 0 1
Standa
rd
Deviat
ion
0.5000
21939
9
0.5549
65833
6
24.031
09769
18
1.6005
10577
7
0.3385
59084
9
1.7382
97160
2
0.6095
47214
9
1.6199
36653
3
10316.
90983
64584
99543.
08482
60957
78777
19.725
9082
5.6604
61272
1
Sampl
e
Varian
ce
0.2500
21940
4
0.3079
87076
5
577.49
36562
749
2.5616
34109
2
0.1146
22254
3.0216
77017
0.3715
47807
2
2.6241
94760
7
10643
8628.5
73613
99088
25736.
69529
62058
46807
9963.2
32.040
82181
34
Kurtos
is
-
2.0003
51098
5
2.6626
38417
9
-
0.9939
50976
8
-
1.2721
80527
4
2.7276
11668
4
-
0.8193
73060
5
46.199
57608
5
6.5598
53965
8
192.75
16582
684
88.874
32616
26
197.96
43572
806
160.03
65468
053
Skewn
ess
-
0.0107
14647
5
1.9243
44597
4
0.6053
72672
1
0.4281
52342
3
2.1741
61104
4
0.0406
72022
2
3.9450
85089
3
2.1405
36129
9
11.936
24510
59
7.7733
81829
5
11.545
24732
43
10.610
98135
78
Range 1 2 82 8 1 8 9 9
22729
8.584
19282
07.918
21587
2953.9
55 125
Minim
um 1 1 10 1 1 1 0 0 0 0 0 0
Maxi
mum 2 3 92 9 2 9 9 9
22729
8.584
19282
07.918
21587
2953.9
55 125
Sum 12905 10933
36316
7 21887 9722 35375 12685 20906
33820
571.68
19997
36597
2563.2
39665
23537
51917
4.0889 24201
Count 8588 8588 8588 8588 8588 8588 8588 8588 8588 8588 8588 8588
Confid 0.0105 0.0117 0.5083 0.0338 0.0071 0.0367 0.0128 0.0342 218.22 2105.5 16663 0.1197
7
Paraphrase This Document
Need a fresh take? Get an instant paraphrase of this document with our AI Paraphraser
ence
Level(
95.0%
)
76752
8
38957
7
19653
5
54923
8
61397
2
69465
2
93494
6
65835
4
92336
518
92804
5594
4.0760
90629
33345
1
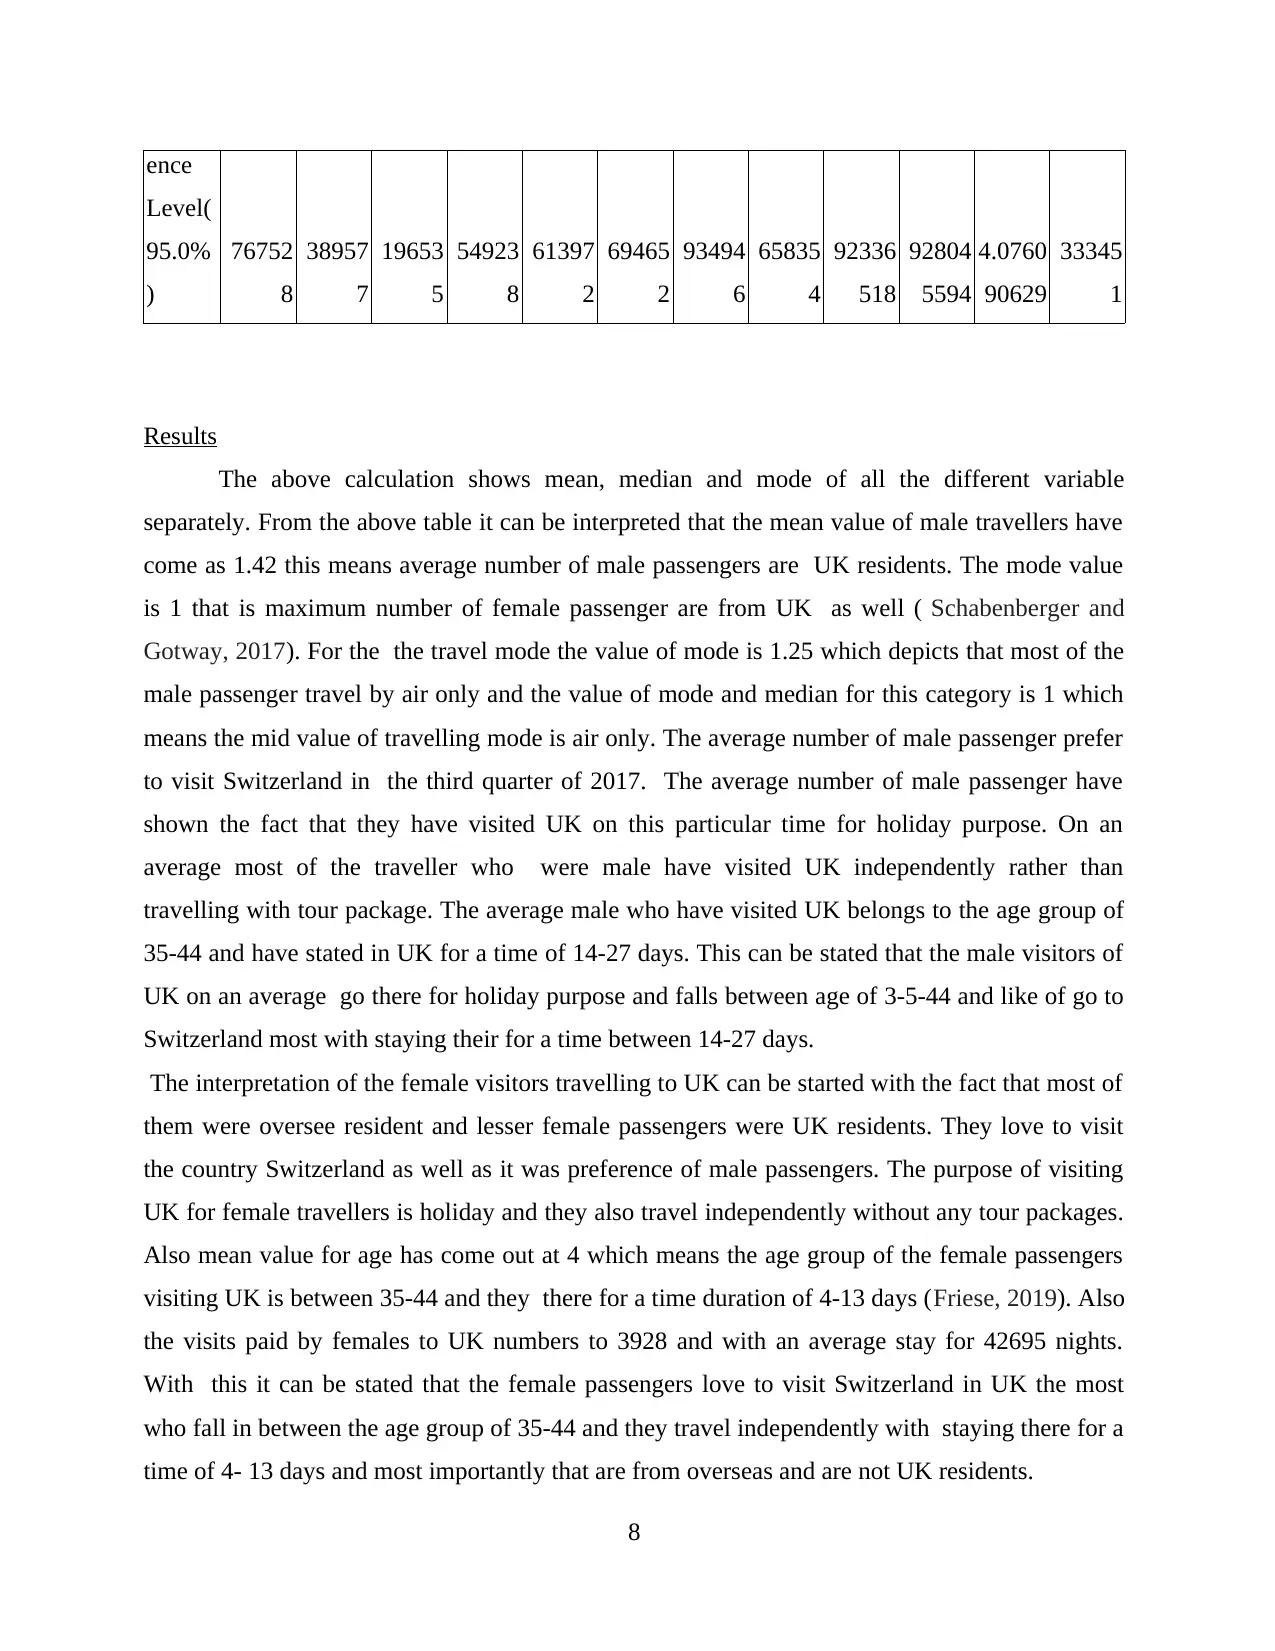
Results
The above calculation shows mean, median and mode of all the different variable
separately. From the above table it can be interpreted that the mean value of male travellers have
come as 1.42 this means average number of male passengers are UK residents. The mode value
is 1 that is maximum number of female passenger are from UK as well ( Schabenberger and
Gotway, 2017). For the the travel mode the value of mode is 1.25 which depicts that most of the
male passenger travel by air only and the value of mode and median for this category is 1 which
means the mid value of travelling mode is air only. The average number of male passenger prefer
to visit Switzerland in the third quarter of 2017. The average number of male passenger have
shown the fact that they have visited UK on this particular time for holiday purpose. On an
average most of the traveller who were male have visited UK independently rather than
travelling with tour package. The average male who have visited UK belongs to the age group of
35-44 and have stated in UK for a time of 14-27 days. This can be stated that the male visitors of
UK on an average go there for holiday purpose and falls between age of 3-5-44 and like of go to
Switzerland most with staying their for a time between 14-27 days.
The interpretation of the female visitors travelling to UK can be started with the fact that most of
them were oversee resident and lesser female passengers were UK residents. They love to visit
the country Switzerland as well as it was preference of male passengers. The purpose of visiting
UK for female travellers is holiday and they also travel independently without any tour packages.
Also mean value for age has come out at 4 which means the age group of the female passengers
visiting UK is between 35-44 and they there for a time duration of 4-13 days (Friese, 2019). Also
the visits paid by females to UK numbers to 3928 and with an average stay for 42695 nights.
With this it can be stated that the female passengers love to visit Switzerland in UK the most
who fall in between the age group of 35-44 and they travel independently with staying there for a
time of 4- 13 days and most importantly that are from overseas and are not UK residents.
8
Level(
95.0%
)
76752
8
38957
7
19653
5
54923
8
61397
2
69465
2
93494
6
65835
4
92336
518
92804
5594
4.0760
90629
33345
1
Results
The above calculation shows mean, median and mode of all the different variable
separately. From the above table it can be interpreted that the mean value of male travellers have
come as 1.42 this means average number of male passengers are UK residents. The mode value
is 1 that is maximum number of female passenger are from UK as well ( Schabenberger and
Gotway, 2017). For the the travel mode the value of mode is 1.25 which depicts that most of the
male passenger travel by air only and the value of mode and median for this category is 1 which
means the mid value of travelling mode is air only. The average number of male passenger prefer
to visit Switzerland in the third quarter of 2017. The average number of male passenger have
shown the fact that they have visited UK on this particular time for holiday purpose. On an
average most of the traveller who were male have visited UK independently rather than
travelling with tour package. The average male who have visited UK belongs to the age group of
35-44 and have stated in UK for a time of 14-27 days. This can be stated that the male visitors of
UK on an average go there for holiday purpose and falls between age of 3-5-44 and like of go to
Switzerland most with staying their for a time between 14-27 days.
The interpretation of the female visitors travelling to UK can be started with the fact that most of
them were oversee resident and lesser female passengers were UK residents. They love to visit
the country Switzerland as well as it was preference of male passengers. The purpose of visiting
UK for female travellers is holiday and they also travel independently without any tour packages.
Also mean value for age has come out at 4 which means the age group of the female passengers
visiting UK is between 35-44 and they there for a time duration of 4-13 days (Friese, 2019). Also
the visits paid by females to UK numbers to 3928 and with an average stay for 42695 nights.
With this it can be stated that the female passengers love to visit Switzerland in UK the most
who fall in between the age group of 35-44 and they travel independently with staying there for a
time of 4- 13 days and most importantly that are from overseas and are not UK residents.
8
Recommendation
From the above interpretation of descriptive analysis of the travelling data collected over
the passengers visiting UK the with key factor being taken as male and female passengers to
identifying their preferences and desirability. The recontamination are made for the target
segment of the gender of passengers. With above analysis it has been identifies that both male
and female passenger love to visit Switzerland the most and they belong to age of 35-44 and they
prefer to move independently rather than going with tour packages. For this it is recommended
that the tour packages must be developed which serves what they want and get attracted towards
the package Also the tourism and destination must be enhanced in Switzerland to maintain the
current flow of tourist in this country. Also this is suggested that for UK resident male face must
be provided that this number of tourist do not fall behind. The average number of female tourist
are from overseas so they mus be provided with such facilitate and amenities with making their
immigration less complicated that they can visiting UK more often. In this regard a advise is
also given to the travel and tourism industry that as the the different preference of male and
female services must be provided to them. The larger section of male population from UK likes
to visit Switzerland in 3rd quarters rather the female from overseas like to travel this country
with dame purpose. As the nationality is different the preferences vary so according services must
be provided.
CONCLUSION
From the above report it can be concluded that data analysis is a technique to evaluate
data which has been collected over a particular subject matter for the present report data gathered
over the travelling in UK has been analysed. In this regard it has been interpreted that the data is
collected for 14 different categories which defines the preferences and likes of the people over
visiting UK. Form the data analysis it has been found out that the male and female have similar
kind of preference where the male are UK residents but the average number of with similar liking
over travelling UK are from other countries and lives overseas. Furthermore the country most
visited by both ale and females is identified as Switzerland ad they belong to the age group of
35-44. For the same recommendation have been made regarding the precedence from different
categorises of the gender visiting UK for different purpose but mostly with holiday motive.
9
⊘ This is a preview!⊘
Do you want full access?
Subscribe today to unlock all pages.
Trusted by 1+ million students worldwide
1 out of 13
Related Documents


Your All-in-One AI-Powered Toolkit for Academic Success.
+13062052269
info@desklib.com
Available 24*7 on WhatsApp / Email
![[object Object]](/_next/static/media/star-bottom.7253800d.svg)
Unlock your academic potential
Copyright © 2020–2026 A2Z Services. All Rights Reserved. Developed and managed by ZUCOL.