STU58269: Comprehensive Report on Data Visualisation & Interpretation
VerifiedAdded on 2023/06/11
|10
|1678
|229
Report
AI Summary
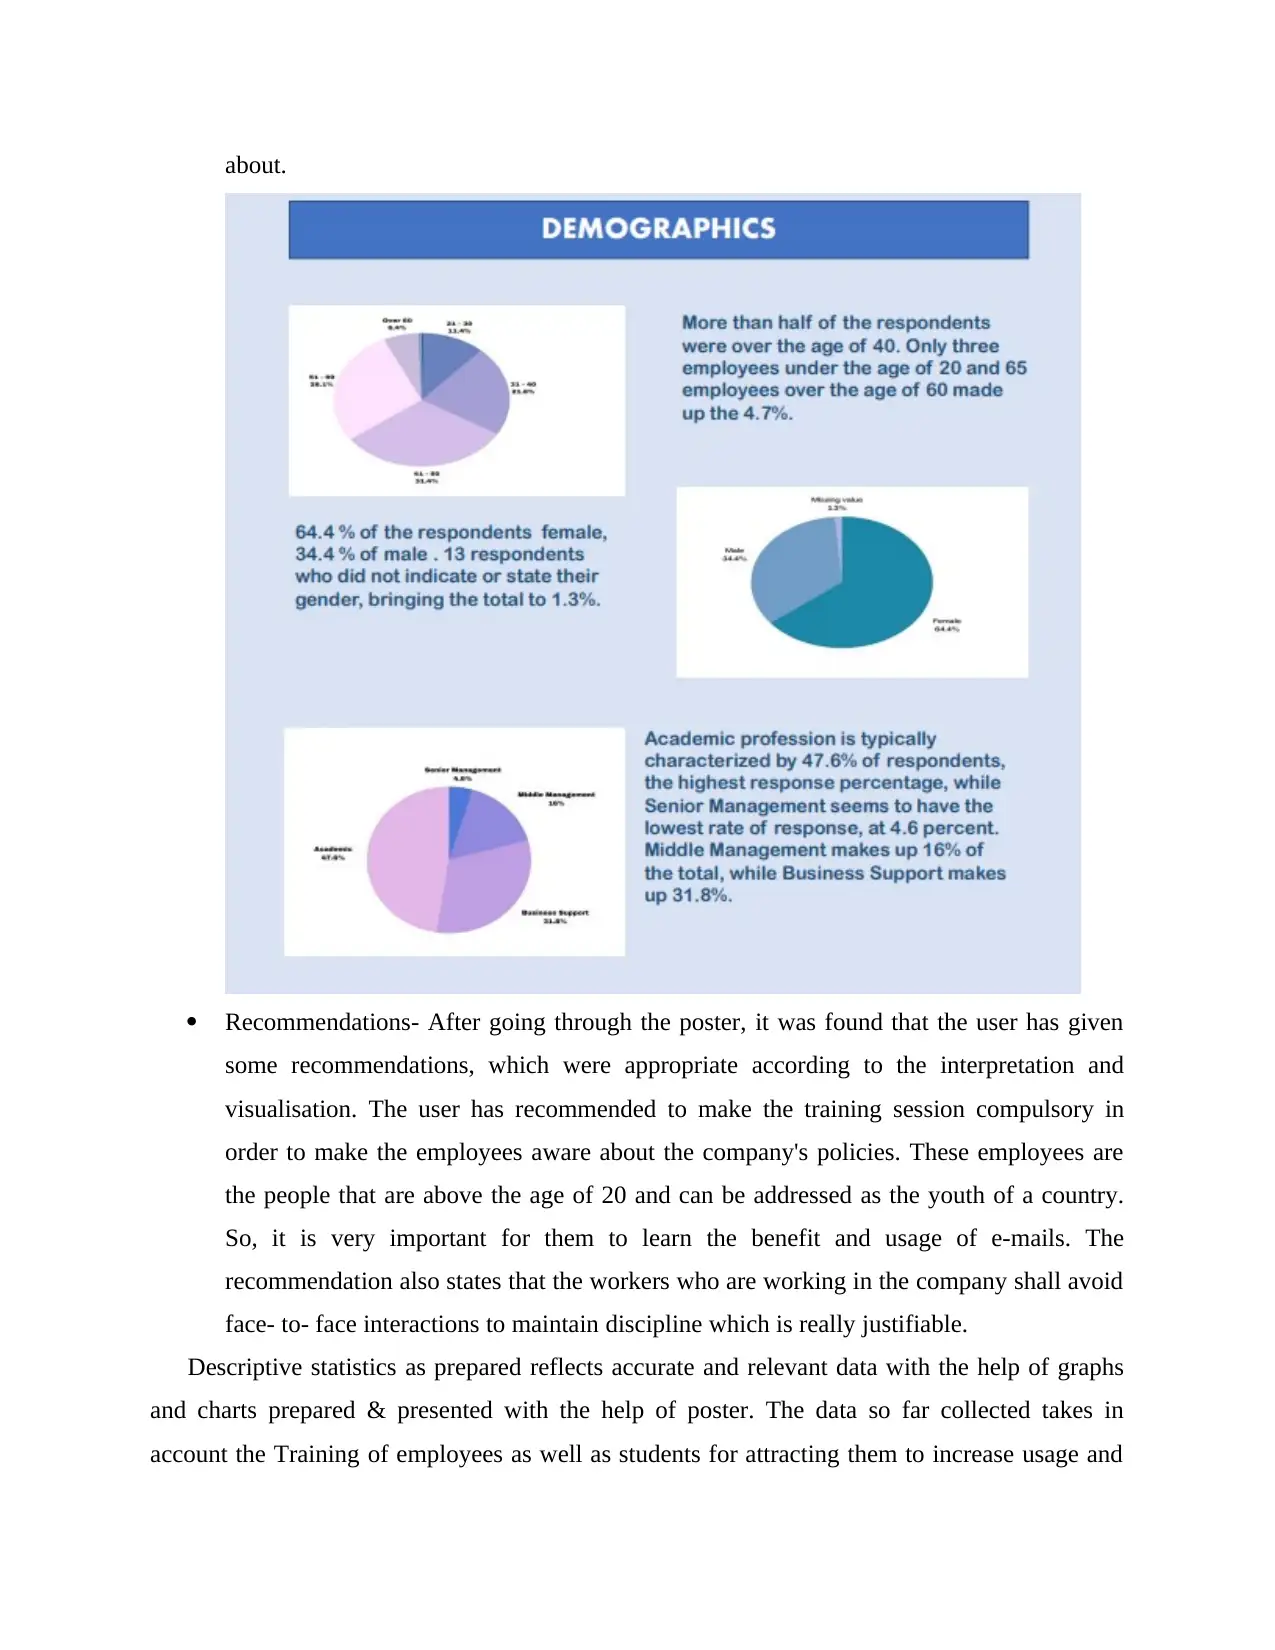
This report provides an analysis of data visualisation and interpretation, focusing on a new training program aimed at improving email usage in higher education institutions. It assesses the merits and demerits of a student's work, highlighting areas addressed properly such as the introduction, demographics, and recommendations. The report also offers suggestions for improvement, including clearer data presentation and more comprehensive solutions to drawbacks associated with email usage. It concludes by emphasizing the importance of data visualisation and interpretation in decision-making and the role of training programs in enhancing email accessibility and awareness among students.

DATA
VISUALISATION
AND
INTERPRETATION
VISUALISATION
AND
INTERPRETATION
Paraphrase This Document
Need a fresh take? Get an instant paraphrase of this document with our AI Paraphraser

Table of Contents
INTRODUCTION...........................................................................................................................3
MAIN BODY...................................................................................................................................3
Merits and Demerits of the work done...................................................................................3
Elements/Areas that are addressed properly...........................................................................4
Suggestions/Recommendations provided on presentation and poster....................................6
Improvements required or Drawbacks seen in a poster..........................................................6
CONCLUSION................................................................................................................................7
REFERENCES................................................................................................................................8

INTRODUCTION
Data visualisation and interpretation of data means to think about the data which present
in the form of maps or graphs so it easy to analyse the data and give recommendation on the
basis of it becomes easier for the universities/colleges (Egger and Yu, 2022). In general, data
visualisation means it translate the details into a visible content and the content present in the
form of maps and varieties of graph to make the data simple and easy to understand by the
human brain. After visualisation of data it important for the universities to interpret the data
correctly and then give recommendation on the basis of interpretation it helps to universities to
take appropriate decision making. In this report it provides training related to how students can
access email and what are the advantages and disadvantages of using email and then on the basis
of whole interpretation give recommendation which based on the complete report.
MAIN BODY
Merits and Demerits of the work done.
The work performed by the student required high amount of time and analysis.
Merits:
The data is presented in a structural way, which makes it easy to understand and analyse;
so that the correct suggestions could be given.
The data could be easily memorised, because it will enable the interest of other students
and make it effective to recall the data when needed.
The work will help in analysing and studying the whole report faster, which will save
time and the complicated information is also presented in a simpler way through the help
of charts and graphs.
It helped in establishing the relationship between various factors and numerous types of
information through the medium of graphs, charts and tables.
Demerits:
The data is not properly analysed and evaluated, and when the students gone through the
poster, they are unable to interpret the data and the report properly.
The students will not be able to maintain a connection between the findings,
recommendations. The interpretation and information analysed could be improved more
efficiently.
⊘ This is a preview!⊘
Do you want full access?
Subscribe today to unlock all pages.

Trusted by 1+ million students worldwide

The documents required by the high education universities cannot be managed through e-
mail.
The pros and cons of using the email habits could have been explained more efficiently.
Elements/Areas that are addressed properly.
The poster that is presented takes in account the various headings like introduction,
demographics, trainings, benefits and drawbacks, recommendations, e-mail usage habits,
conclusion out of these three elements are presented in an appropriate manner. These three areas
are listed below-
Introduction- In this part, the brief on the usage of e-mail with the technological
advancement in the educational industry, daily lives and the respondents of the data have
also been mentioned in a proper manner. It is written in a precise manner which is able to
give an idea to the reader on what this poster is all about.
Demographics- The data has been presented by keeping the note on the certain factors
that hold age, gender and profession. The pie-chart is drawn in a correct manner which is
very easy to understand and analyse. Along with this, the data interpretation done for the
different factors gives the clear picture on what the diagrammatic representation is all
Paraphrase This Document
Need a fresh take? Get an instant paraphrase of this document with our AI Paraphraser

about.
Recommendations- After going through the poster, it was found that the user has given
some recommendations, which were appropriate according to the interpretation and
visualisation. The user has recommended to make the training session compulsory in
order to make the employees aware about the company's policies. These employees are
the people that are above the age of 20 and can be addressed as the youth of a country.
So, it is very important for them to learn the benefit and usage of e-mails. The
recommendation also states that the workers who are working in the company shall avoid
face- to- face interactions to maintain discipline which is really justifiable.
Descriptive statistics as prepared reflects accurate and relevant data with the help of graphs
and charts prepared & presented with the help of poster. The data so far collected takes in
account the Training of employees as well as students for attracting them to increase usage and

understanding to have full knowledge about benefits and drawbacks that are associated with
same. It further guides through demographic title as how many users are engaged on basis of
gender, profession and age as well. It further takes in account advantages and disadvantages in
usage of emails. It further counts introduction of the topic and conclusion as well which helps to
understand accuracy of information. It is evident that there is new training program launched
which helps to provide an idea as what is the need, necessity and importance of information
being used in email.
Suggestions/Recommendations provided on presentation and poster.
It suggests that the people must be well aware and known towards the benefits &
drawbacks that are associated with the usage of emails.
It suggested that employees must focus on accessing proper training and motivate people
for using emails that would be helpful in saving time, cost and reaching out to group in
lesser time duration (Lu and et.al., 2020.).
It is further recommended that the employees must be using suitable headings and
highlighting the points which gives a clear picture of what is being discussed in Email.
It is observed and noted that on the basis of demographic variable the people who are in
higher education institutions in the age group of 20 years are using lesser emails.
Areas such as describing habits related to usage of emails is not giving any clear picture
and thus nothing can be asserted or predicted by the laid data. Further it is suggested that
the poster must be more briefly defining points and headings included in the presented
information.
It is suggested that the emails must include professional and related content which would
be helpful in saving time and ignore spam content that is of no use. It must also take in
account actions that would be helpful for carrying out best results in minimum time
period (Munguia and et.al., 2020).
Improvements required or Drawbacks seen in a poster.
There are many improvements that are to be counted while making a poster such are stated as
under:
⊘ This is a preview!⊘
Do you want full access?
Subscribe today to unlock all pages.

Trusted by 1+ million students worldwide

The presentation must be more precise and clear in case of unidentified gender which
remains unclosed. It must count more clarity in data collected and presented with the help
of Poster (Piccolo, Simone and Iannario, 2019).
Drawback which are observed in case of poster takes in account negative aspects that are
related with emails and there are no solutions provided for improving the performance
linked with using emails.
Poster can be improved by using better charts which would give a better picture of
performance served. It must help to understand how email can be discovered to be useful
or shall be ignored for minimizing the time invested and wasted on reading it which can
further be used at some better place.
CONCLUSION
As it is concluded from the above report it states about the data visualisation and
interpretation and give judgement on the basis of the maps and graphs so, the company can
clearly see the content and make decision on the basis of charts although it also help the
university to recognize the data easily and it also important to interpret the data correctly so, they
can provide recommendation which is truly based on the demographics charts. Basically the
above report also concluded that the universities also provide training to the students which is
based on the email so, the students can access the email easily. Also, it shows the positive and
negative side of email and aware the students so, it will help them in future use. After completion
of all the topics they need to give recommendation on the basis of the above report and tells
about which training method is more suitable to use.
Paraphrase This Document
Need a fresh take? Get an instant paraphrase of this document with our AI Paraphraser

REFERENCES
Books and Journals
Egger, R. and Yu, J., 2022. Epistemological challenges. In Applied Data Science in Tourism (pp.
17-34). Springer, Cham.
Lu, G., et.al., 2020. Multi-frequency and multi-attribute GPR data fusion based on 2-D wavelet
transform. Measurement. 166. p.108243.
Munguia, P., et.al., 2020. A learning analytics journey: Bridging the gap between technology
services and the academic need. The Internet and Higher Education. 46. p.100744.
Piccolo, D., Simone, R. and Iannario, M., 2019. Cumulative and CUB models for rating data: a
comparative analysis. International Statistical Review. 87(2). pp.207-236.
Tsai, Y.H., et.al., 2019. A BIM-based approach for predicting corrosion under
insulation. Automation in Construction. 107. p.102923.
Uludağ, M., et.al., 2018. On the interpretation of melt quality assessment of A356 aluminum
alloy by the reduced pressure test: the Bifilm index and its physical
meaning. International Journal of Metalcasting. 12(4). pp.853-860.

⊘ This is a preview!⊘
Do you want full access?
Subscribe today to unlock all pages.

Trusted by 1+ million students worldwide

1 out of 10
Related Documents

Your All-in-One AI-Powered Toolkit for Academic Success.
+13062052269
info@desklib.com
Available 24*7 on WhatsApp / Email
Unlock your academic potential
Copyright © 2020–2025 A2Z Services. All Rights Reserved. Developed and managed by ZUCOL.