Data Mining and Visualization Assessment - Data Analysis Report

Verified

Added on  2020/03/28

|10
|1183
|87
Homework Assignment
AI Summary
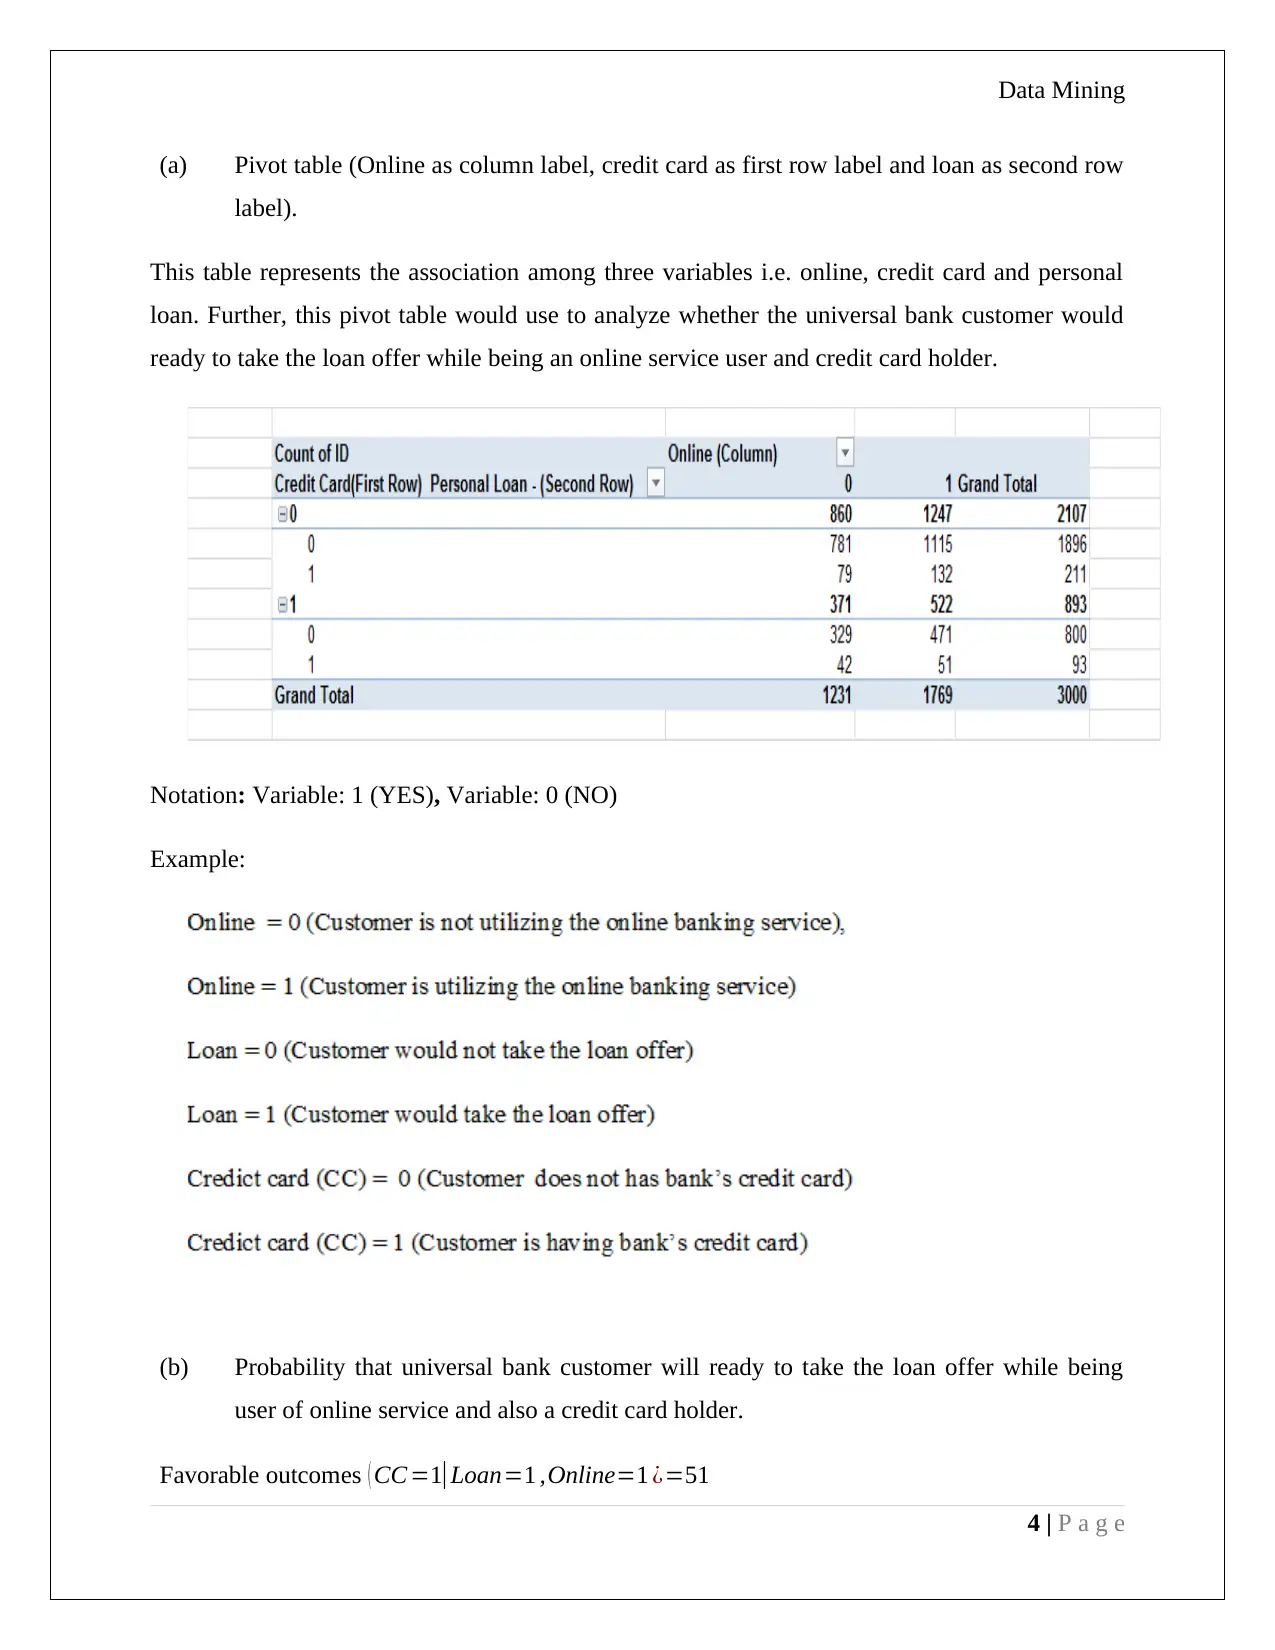
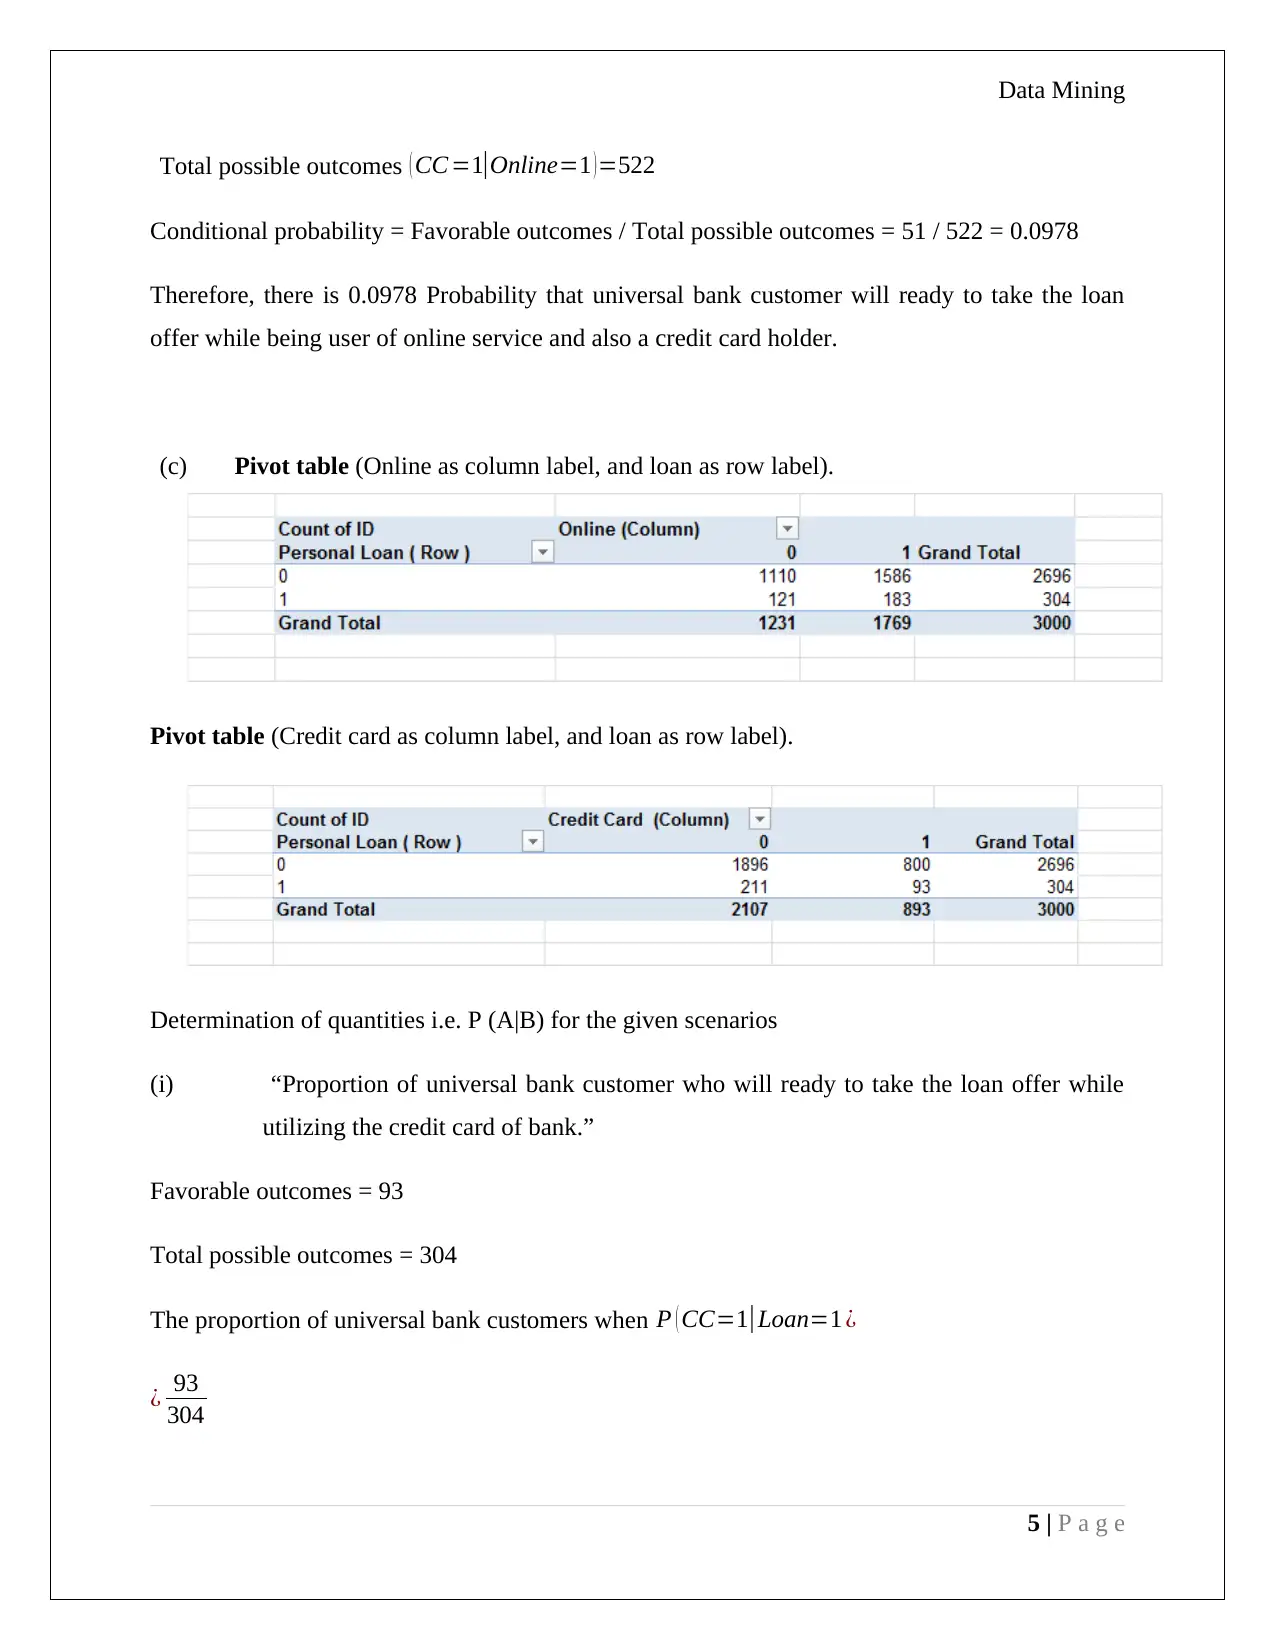
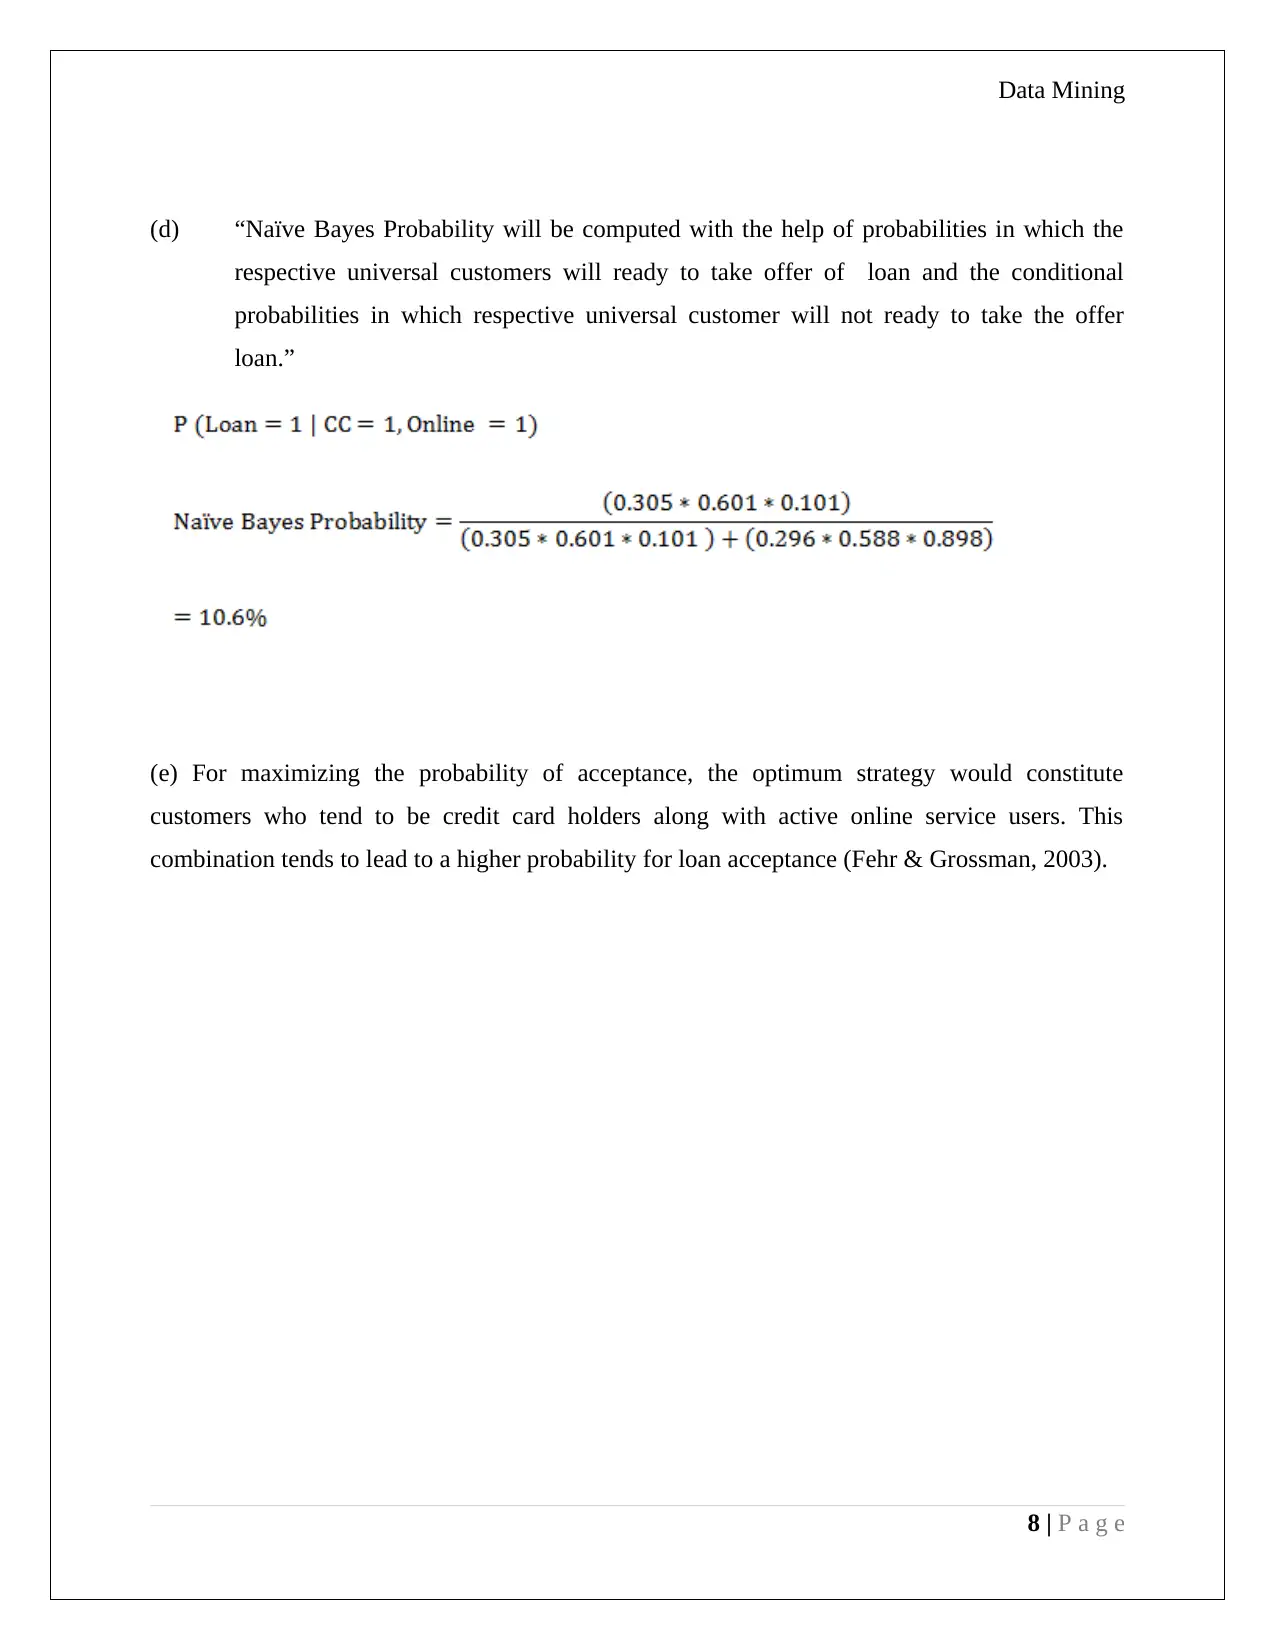
This data mining assignment involves the interpretation of PCA output using XL Miner to analyze the variance matrix and identify significant features for comparing US utility firms. The assignment then focuses on analyzing customer data from a universal bank, partitioned into training and validation sets. It uses pivot tables to examine the relationships between credit card usage, online banking service, and loan acceptance. The analysis calculates conditional probabilities to determine the likelihood of a customer accepting a loan offer based on their online service usage and credit card ownership. The assignment concludes with a strategy recommendation to maximize loan acceptance probability by targeting customers who are both credit card holders and active online service users. The solution references key concepts of data mining, statistical methods and data analysis techniques.
tabler-icon-diamond-filled.svg

Contribute Materials

Your contribution can guide someone’s learning journey. Share your documents today.
Document Page
Data Mining and Visualization
Assessment Item – 2
STUDENT ID
[Pick the date]
tabler-icon-diamond-filled.svg

Secure Best Marks with AI Grader

Need help grading? Try our AI Grader for instant feedback on your assignments.
Document Page
Data Mining
Question 1
a) PCA Output (XL Miner)
Interpretation
The variance matrix clearly highlights that considering the top four principal components would
lead to the assurance than 80% of the total variance is accounted for while the remaining would
simply be labeled as noise (Medhi, 2001).
Taking the principal control matrix into consideration and the respective eigen values, the
significant features from the given eight features can be earmarked for comparison of US utility
firms. The higher magnitude features are preferred and the same has been summarized below
(Hofmann & Chisholm, 2016).
1 | P a g e
Document Page
Data Mining
The requirement for using normalised data often arises in PCA but it is not imperative for this
case. The prime reason for the same is that the total variance matrix does not seem to have
undergone any major distortion owing to differential scale of the underlying variables. In case of
any significant skewing of representation which significantly alters the significance of the
variables, then data normalisation becomes a necessity (Shumueli et. al., 2016).
(b) The main advantages and disadvantages of PCA are shown below (Kudyba & Hoptroff,
2012).
Advantages
PCA procedure is statistically useful tool which reduces the high dimensional components
into fewer dimensional components.
This is also useful technique to examine the actual structure of the dataset.
This is based on the max- variance process and hence, the reduce variables are the set of
components which has significantly high variance contribution into total variance.
Visualization is easy in PCA because the reduced components (principal component) has
separate axis in the m or p dimensional space cloud and hence, easy to visualize.
Disadvantages
In the process of variable reduction, there is high possibility that the PCA may eliminate the
variables which are significant.
This technique fails for the data set which has presence of categorical variables.
This also not useful when the data variables are derived from the unknown source
distribution.
This is not useful when non-linear association tends to exist between the variables.
2 | P a g e
Document Page
Data Mining
The determination of magnitude of principal component is easy. However, the determination
of exact position or direction of principal component in the dimensional cloud is very
difficult. This is because axis of each principal component is exactly perpendicular to the
other axis of component. Hence, the direction determination is complex.
Question 2
The aim is to analysis the given data after making respective partition.
Number of customers of universal bank = 5000
Partition = 60% training & 40% validation
Credit card (CC) and Online (banking service of bank) are the given predictors.
The partition has been performed through XLMiner Analytical tool add ins of excel.
Standard partition has been conducted.
The output of XLMiner is shown below:
Training data set of 3000 customers has been taken into consideration for analysis.
3 | P a g e
tabler-icon-diamond-filled.svg

Secure Best Marks with AI Grader

Need help grading? Try our AI Grader for instant feedback on your assignments.
Document Page
Data Mining
(a) Pivot table (Online as column label, credit card as first row label and loan as second row
label).
This table represents the association among three variables i.e. online, credit card and personal
loan. Further, this pivot table would use to analyze whether the universal bank customer would
ready to take the loan offer while being an online service user and credit card holder.
Notation: Variable: 1 (YES), Variable: 0 (NO)
Example:
(b) Probability that universal bank customer will ready to take the loan offer while being
user of online service and also a credit card holder.
Favorable outcomes ( CC =1|Loan=1 ,Online=1 ¿=51
4 | P a g e
Document Page
Data Mining
Total possible outcomes ( CC =1|Online=1 )=522
Conditional probability = Favorable outcomes / Total possible outcomes = 51 / 522 = 0.0978
Therefore, there is 0.0978 Probability that universal bank customer will ready to take the loan
offer while being user of online service and also a credit card holder.
(c) Pivot table (Online as column label, and loan as row label).
Pivot table (Credit card as column label, and loan as row label).
Determination of quantities i.e. P (A|B) for the given scenarios
(i) “Proportion of universal bank customer who will ready to take the loan offer while
utilizing the credit card of bank.”
Favorable outcomes = 93
Total possible outcomes = 304
The proportion of universal bank customers when P ( CC=1|Loan=1 ¿
¿ 93
304
5 | P a g e
Document Page
Data Mining
¿ 0.305
(ii) “The probability that universal bank customer who are going to take the offer of loan
while using the online net banking service.”
Favorable outcomes = 183
Total possible outcomes = 304
Probability P ( Online=1|Loan=1 ¿
¿ 183
304
¿ 0.601
(iii) “Proportion that universal bank customers would ready to take the loan.”
Favorable outcomes = 304
Total possible outcomes = 3000
Probability P ( Loan=1 )= 304
3000
¿ 0.101
(iv) “Probability that customer who will not ready to accept the loan offer while utilizing
credit card of universal bank.”
Favorable outcomes = 800
Total possible outcomes = 2696
6 | P a g e
tabler-icon-diamond-filled.svg

Paraphrase This Document

Need a fresh take? Get an instant paraphrase of this document with our AI Paraphraser
Document Page
Data Mining
Probability P ( CC =1|Loan=0 ¿
¿ 800
2696
¿ 0.296
(v) “Probability that universal bank customer who will not ready to take the offer of loan
irrespective of the fact that they are utilizing online net banking service of universal
bank.”
Favorable outcomes = 1586
Total possible outcomes = 2696
Probability P ( Online=1|Loan=0¿
¿ 1586
2696
¿ 0.588
(vi) “Probability that universal bank customer who will not ready to accept the loan offer”
Favorable outcomes = 2696
Total possible outcomes = 3000
Probability ( Loan=0)
¿ 2696
3000
¿ 0.898
7 | P a g e
Document Page
Data Mining
(d) “Naïve Bayes Probability will be computed with the help of probabilities in which the
respective universal customers will ready to take offer of loan and the conditional
probabilities in which respective universal customer will not ready to take the offer
loan.”
(e) For maximizing the probability of acceptance, the optimum strategy would constitute
customers who tend to be credit card holders along with active online service users. This
combination tends to lead to a higher probability for loan acceptance (Fehr & Grossman, 2003).
8 | P a g e
Document Page
Data Mining
Reference
Fehr, F. H., & Grossman, G. (2003). An introduction to sets, probability and hypothesis testing
(3rd ed.). Ohio: Heath.
Hofmann, M. & Chisholm, A. (2016) Text Mining and Visualization Case Studies Using Open-
Source Tools (4th ed.). London: CRC Press.
Kudyba, S. & Hoptroff, R. (2012) Data Mining and Business Intelligence: A Guide to
Productivity (3rd ed.). London: Idea Griou Inc.
Medhi, J. (2001). Statistical Methods: An Introductory Text (4th ed.). Sydney: New Age
International.
Shumueli, G., Bruce, C.P., Stephens, L.M. & Patel, R.N. (2016) Data Mining for Business
Analytics: Concepts, Techniques, and Applications with JMP Pro. Sydney: John Wiley &
Sons.
9 | P a g e
chevron_up_icon
1 out of 10
circle_padding
hide_on_mobile
zoom_out_icon
logo.png

Your All-in-One AI-Powered Toolkit for Academic Success.

Available 24*7 on WhatsApp / Email

[object Object]