Data Visualization, Distribution & Analysis of BMI using SPSS

Verified

Added on  2023/06/14

|16
|1853
|350
Report
AI Summary
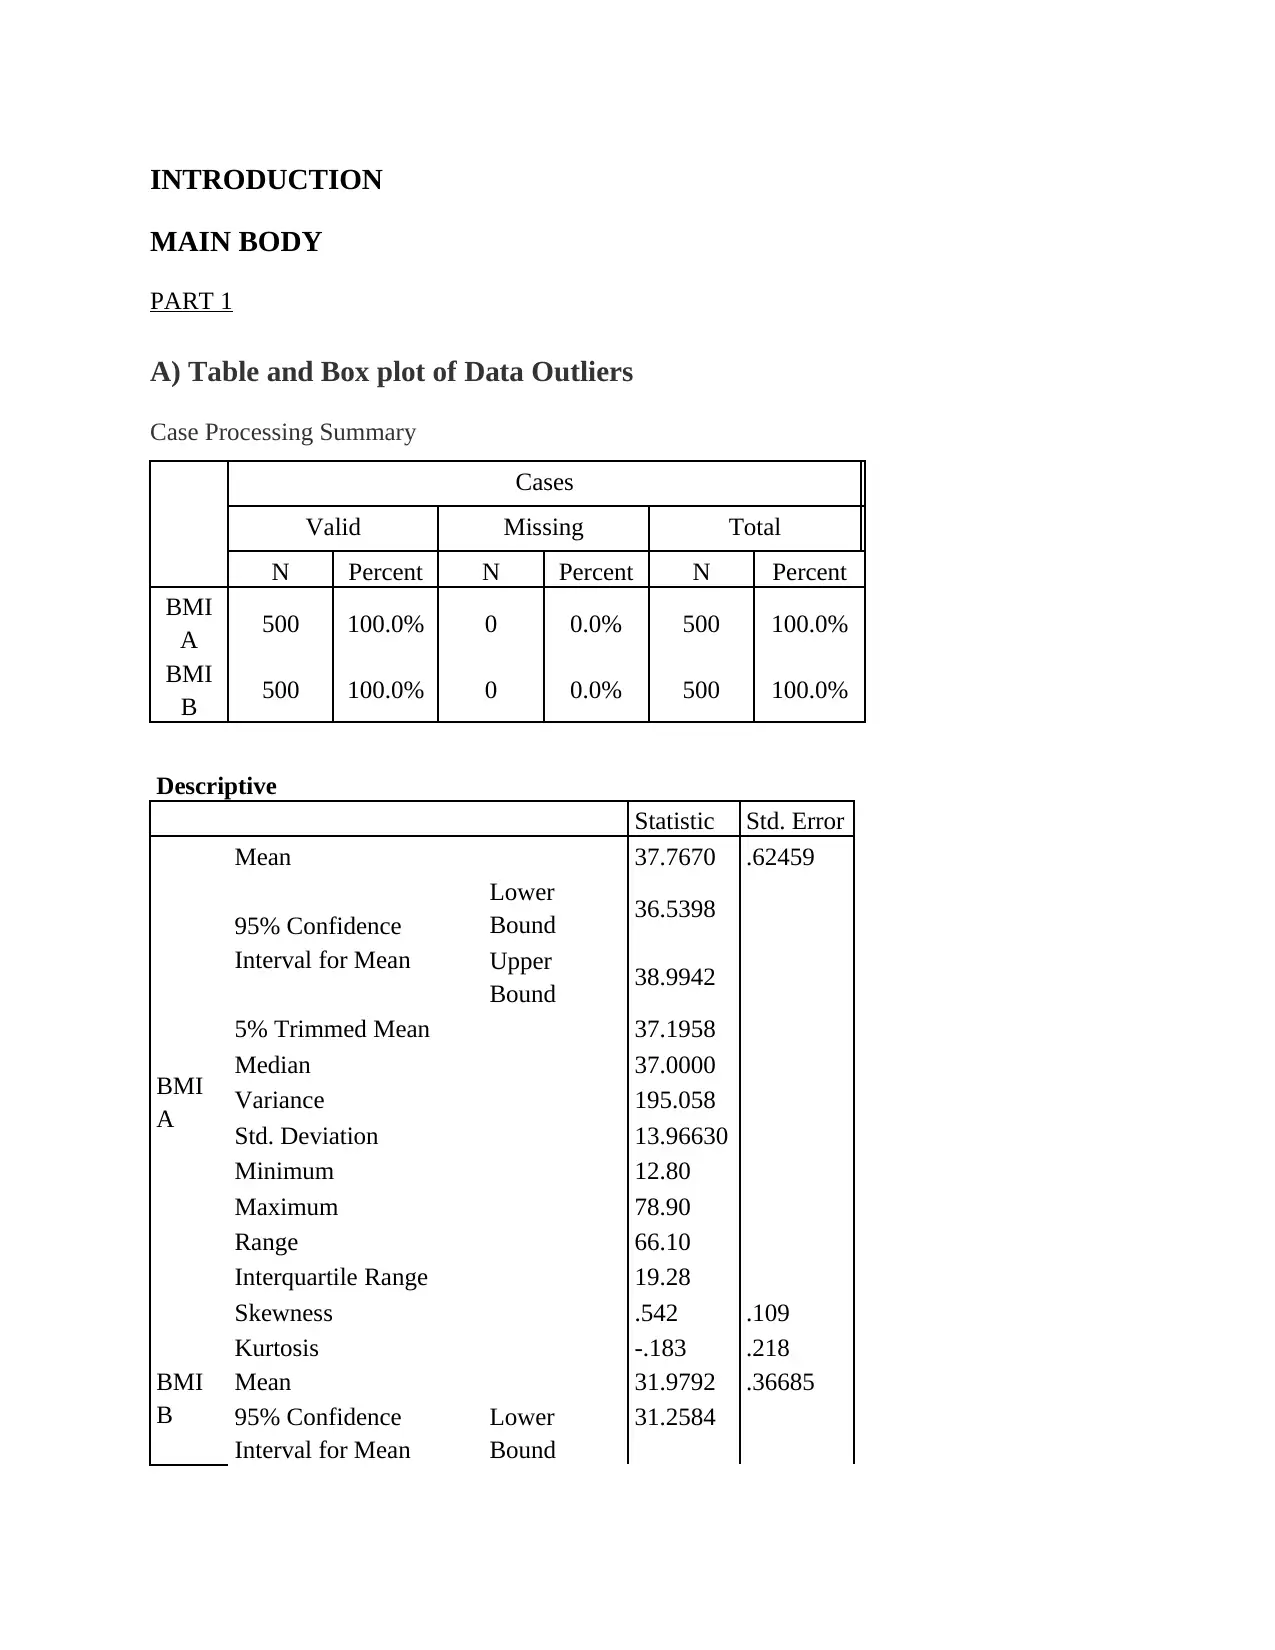
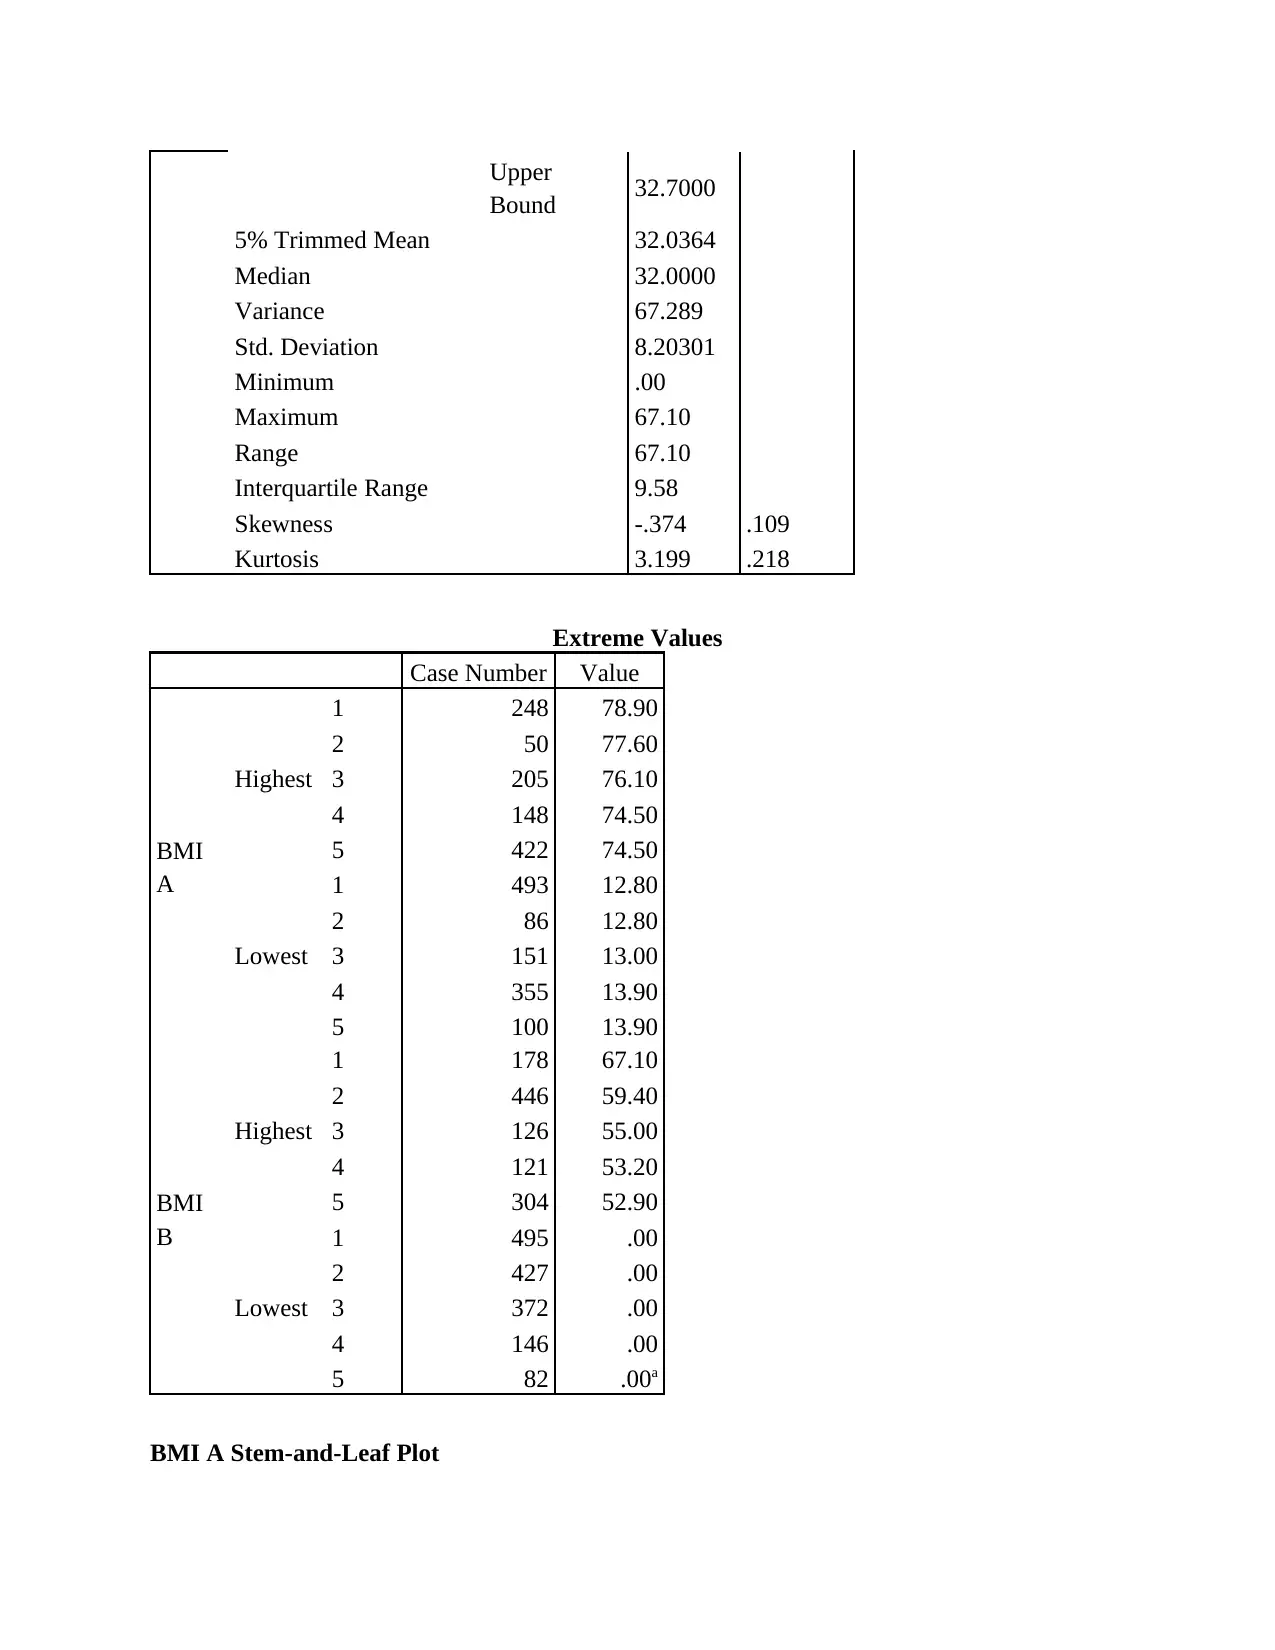
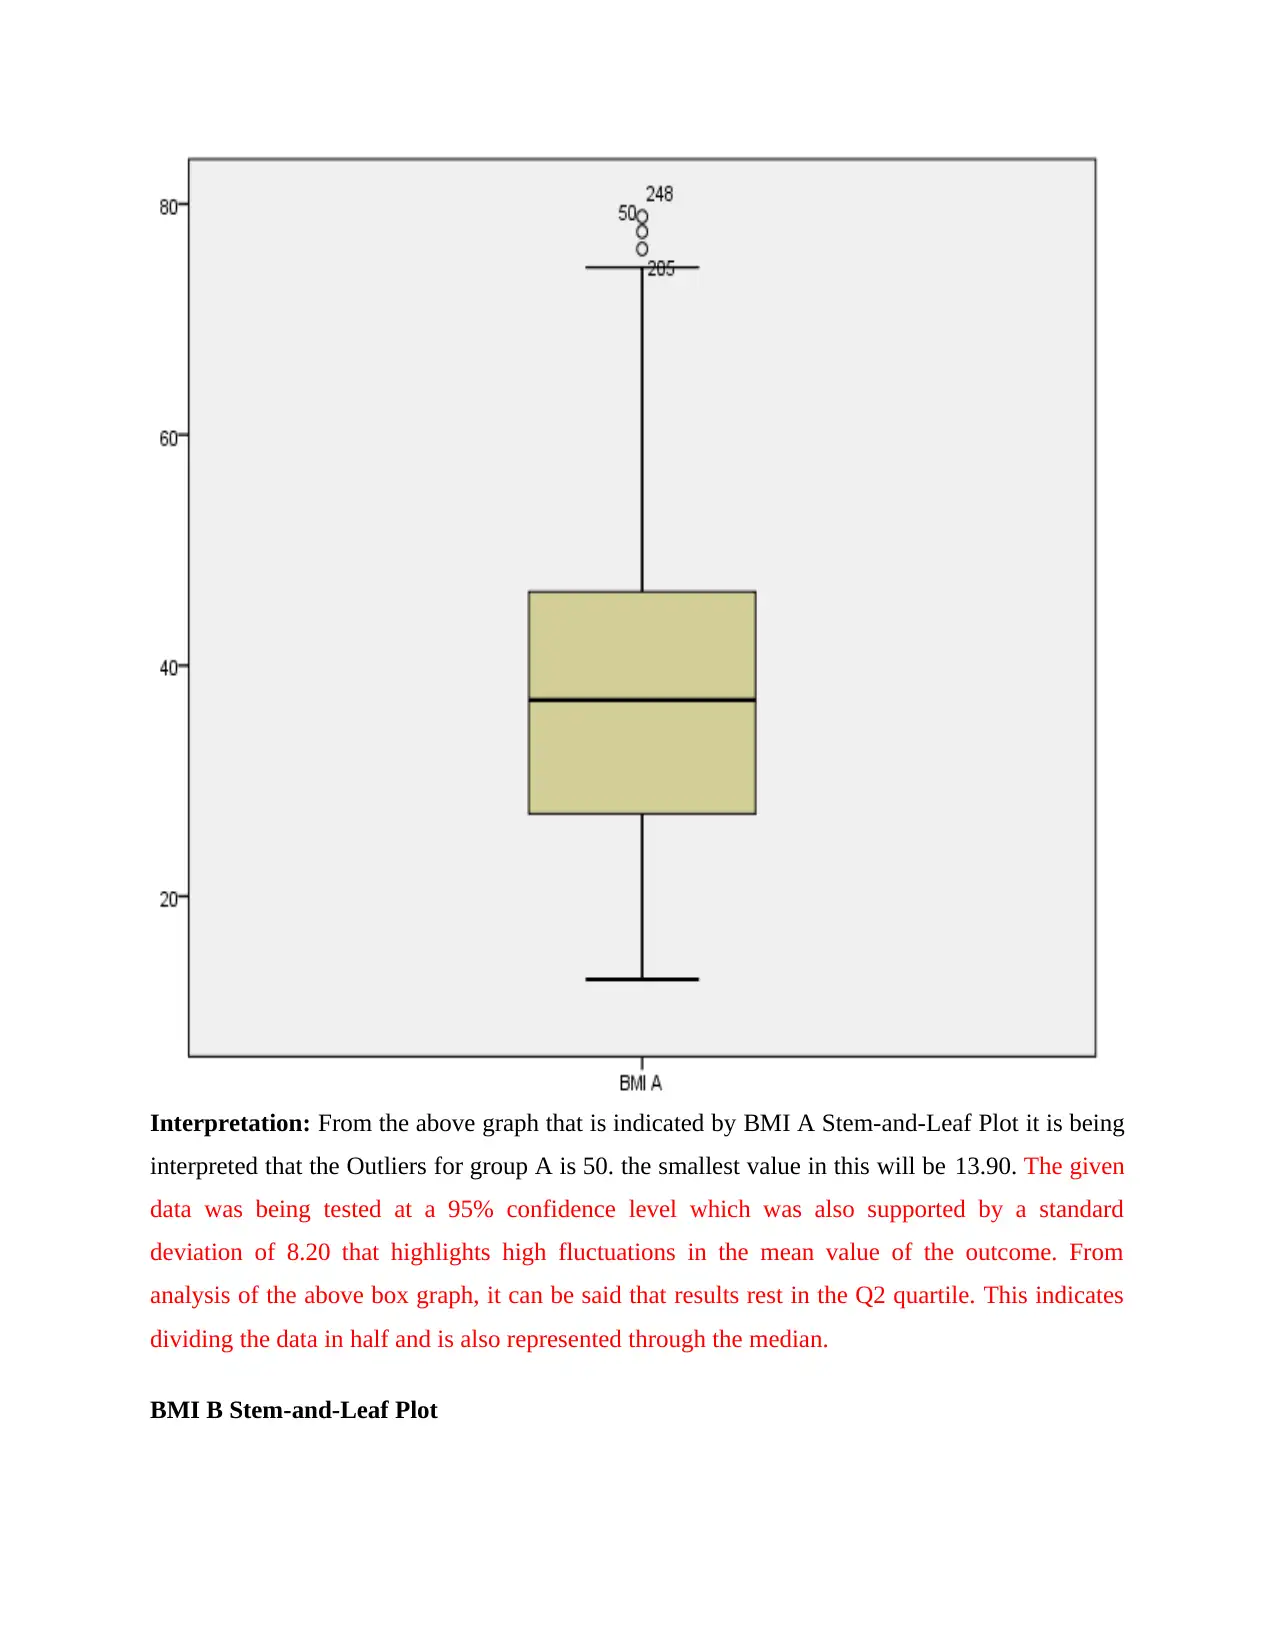
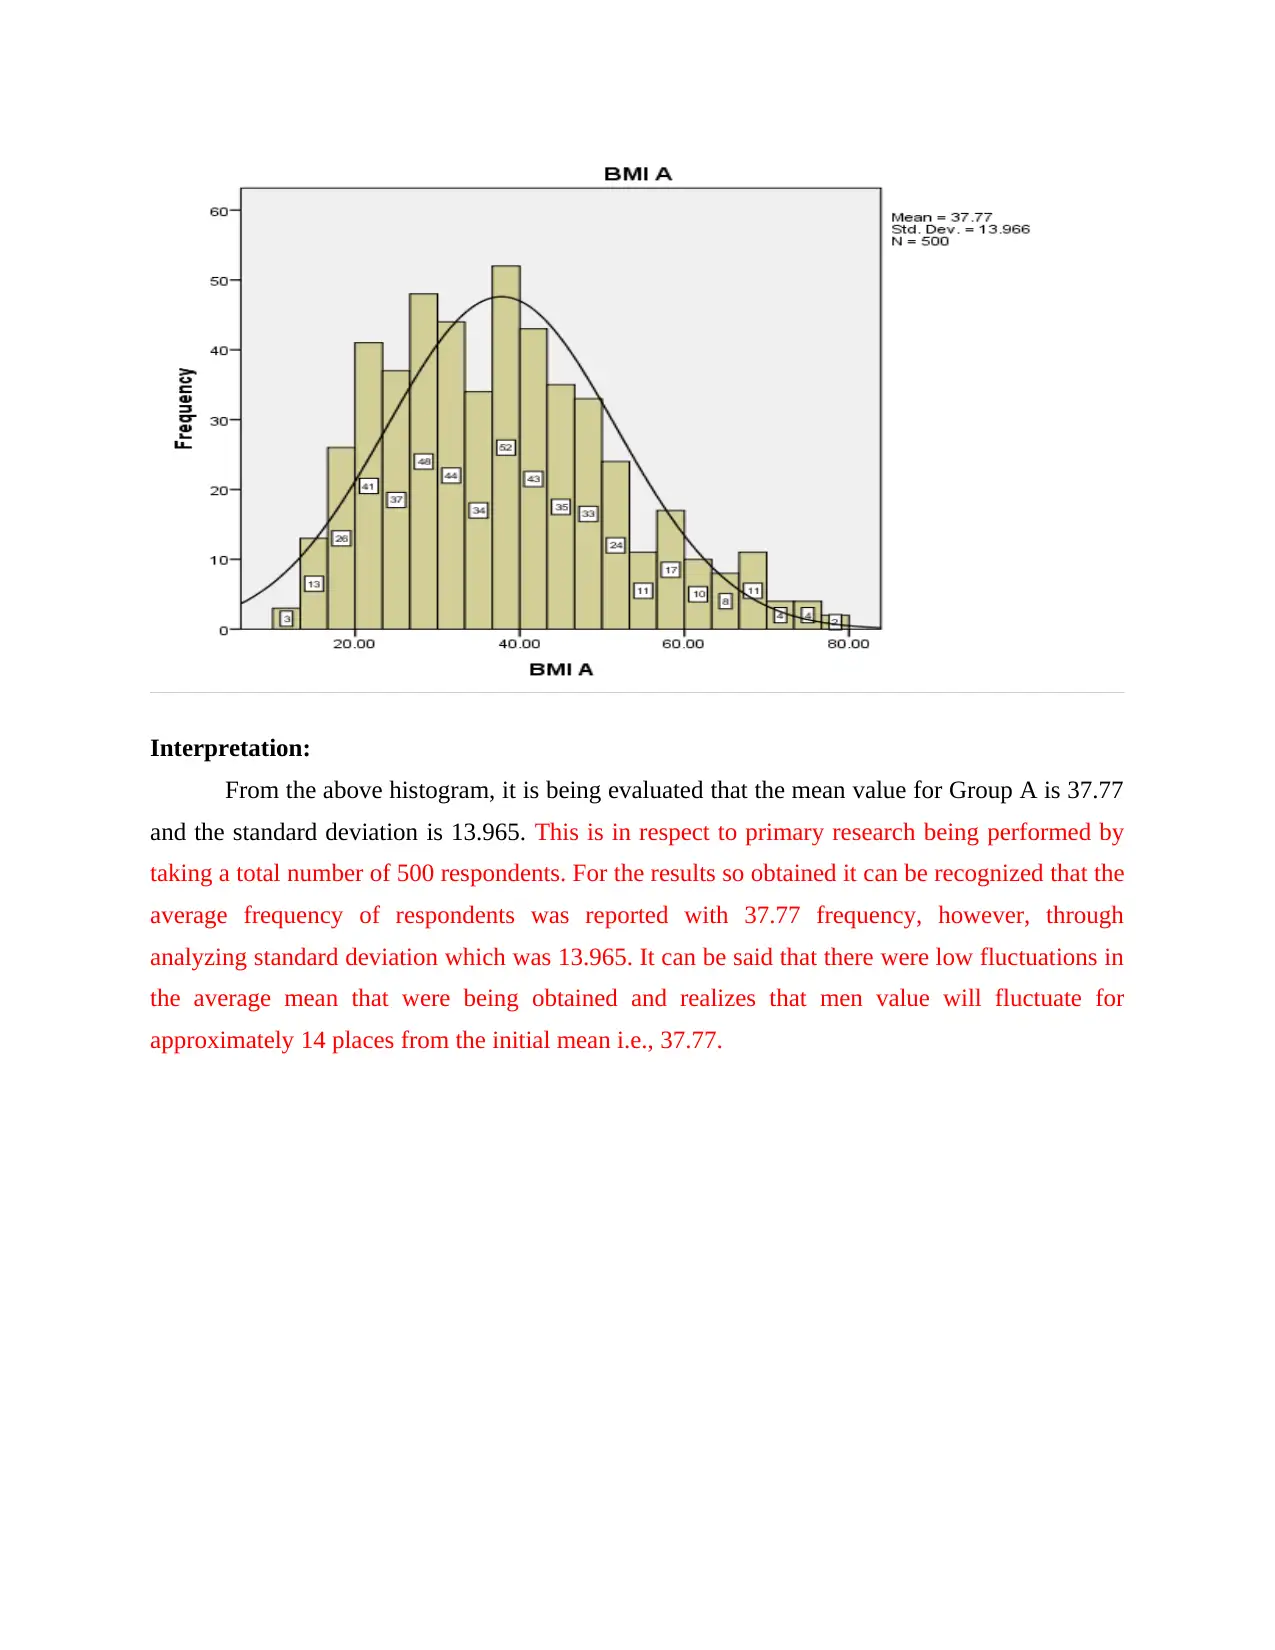
This report presents a data visualization, distribution, and analysis of BMI values for two groups (A and B) using SPSS. The analysis includes outlier detection, frequency histograms, and normality tests. Part 1 details the SPSS calculations and graphical representations, while Part 2 provides an abstract summarizing the aim, methods, results, and conclusion. The aim is to determine if a significant difference exists between the BMI values of the two groups. Statistical methods employed include data outlier analysis, frequency histograms, and normality tests to assess the distribution and central tendencies of the BMI data. The results indicate a moderate difference between the BMI values of group A and group B, leading to the conclusion that the BMI values of the two groups are interrelated without significant difference.
Document Page
Data Visualization
Distribution & Analysis
tabler-icon-diamond-filled.svg

Paraphrase This Document

Need a fresh take? Get an instant paraphrase of this document with our AI Paraphraser
Document Page
EXECUTIVE SUMMARY
This report is based on Data Visualization Distribution & Analysis. The main purpose to
conduct the report is to check the BMI of the group A and B participants so that analysis can be
made between the two. The gathered data of this file is been evaluate by a software known as
Statistical package for social science (SPSS). This type software is used so that complex
statistical data. This software is used in various areas such as market researchers, health
researchers, survey companies, government, education researchers, marketing organizations, data
miners etc. In this report three test is being applied to evaluate the data which are data Outliers,
frequency histogram and normality test. The various graphs are also been design according to the
requirement of the data and test applied. This report covers two parts: part 1 is based on
calculation that is done by using SPSS and Part 2 is an abstract which covers Aim, Methods,
result and conclusion of the finding that is done in part 1. Data that is collected in this report is
the BMI values of the two group that is A and B. This report is based on the Public health that
why collection of data is of BMI.
Document Page
Table of Contents
EXECUTIVE SUMMARY.............................................................................................................2
INTRODUCTION...........................................................................................................................4
MAIN BODY...................................................................................................................................4
PART 1........................................................................................................................................4
A) Table and Box plot of Data Outliers.................................................................................4
B) Frequency histogram for group A and group B.................................................................8
C) Normality Test of group A and B....................................................................................10
PART 2:....................................................................................................................................15
Abstract : .............................................................................................................................15
REFERENCES..............................................................................................................................16
Document Page
INTRODUCTION
MAIN BODY
PART 1
A) Table and Box plot of Data Outliers
Case Processing Summary
Cases
Valid Missing Total
N Percent N Percent N Percent
BMI
A 500 100.0% 0 0.0% 500 100.0%
BMI
B 500 100.0% 0 0.0% 500 100.0%
Descriptive
Statistic Std. Error
BMI
A
Mean 37.7670 .62459
95% Confidence
Interval for Mean
Lower
Bound 36.5398
Upper
Bound 38.9942
5% Trimmed Mean 37.1958
Median 37.0000
Variance 195.058
Std. Deviation 13.96630
Minimum 12.80
Maximum 78.90
Range 66.10
Interquartile Range 19.28
Skewness .542 .109
Kurtosis -.183 .218
BMI
B
Mean 31.9792 .36685
95% Confidence
Interval for Mean
Lower
Bound
31.2584
tabler-icon-diamond-filled.svg

Paraphrase This Document

Need a fresh take? Get an instant paraphrase of this document with our AI Paraphraser
Document Page
Upper
Bound 32.7000
5% Trimmed Mean 32.0364
Median 32.0000
Variance 67.289
Std. Deviation 8.20301
Minimum .00
Maximum 67.10
Range 67.10
Interquartile Range 9.58
Skewness -.374 .109
Kurtosis 3.199 .218
Extreme Values
Case Number Value
BMI
A
Highest
1 248 78.90
2 50 77.60
3 205 76.10
4 148 74.50
5 422 74.50
Lowest
1 493 12.80
2 86 12.80
3 151 13.00
4 355 13.90
5 100 13.90
BMI
B
Highest
1 178 67.10
2 446 59.40
3 126 55.00
4 121 53.20
5 304 52.90
Lowest
1 495 .00
2 427 .00
3 372 .00
4 146 .00
5 82 .00a
BMI A Stem-and-Leaf Plot
Document Page
Interpretation: From the above graph that is indicated by BMI A Stem-and-Leaf Plot it is being
interpreted that the Outliers for group A is 50. the smallest value in this will be 13.90. The given
data was being tested at a 95% confidence level which was also supported by a standard
deviation of 8.20 that highlights high fluctuations in the mean value of the outcome. From
analysis of the above box graph, it can be said that results rest in the Q2 quartile. This indicates
dividing the data in half and is also represented through the median.
BMI B Stem-and-Leaf Plot
Document Page
Interpretation: From the above information being presented in the format of a graph and is
represented by BMI B Stem-and-Leaf Plot it is been interpreted that the outlier value for BMI
value is 446. It can be stated that, frequency of the respondent were being recorded at median
value which was 32.00 This significates that overall outcomes of the research being performed
stayed at the moderate frequency.
B) Frequency histogram for group A and group B
tabler-icon-diamond-filled.svg

Paraphrase This Document

Need a fresh take? Get an instant paraphrase of this document with our AI Paraphraser
Document Page
Interpretation:
From the above histogram, it is being evaluated that the mean value for Group A is 37.77
and the standard deviation is 13.965. This is in respect to primary research being performed by
taking a total number of 500 respondents. For the results so obtained it can be recognized that the
average frequency of respondents was reported with 37.77 frequency, however, through
analyzing standard deviation which was 13.965. It can be said that there were low fluctuations in
the average mean that were being obtained and realizes that men value will fluctuate for
approximately 14 places from the initial mean i.e., 37.77.
Document Page
Interpretation:
From the above frequency histogram, it is being interpreted that the mean value of group
B is 31.98 and the standard deviation is 8.203. Through analysis of the above graph, it can be
said that out of the total number of the respondent that counted to 500, the average of the
respondent reported at 31.98. In addition to this standard deviation being obtained is also low
than is 8.203. This shows that the mean value of the result is obtained by fluctuating from the
number of 8 places. It delivers the result that all respondents that were being taken into
consideration showed a significant choice of option in respect to the question being asked to
them.
Document Page
C) Normality Test of group A and B
Model Description
Model Name MOD_1
Series or Sequence 1 BMI A
2 BMI B
Transformation None
Non-Seasonal Differencing 0
Seasonal Differencing 0
Length of Seasonal Period No periodicity
Standardization Not applied
Distribution
Type Normal
Location estimated
Scale estimated
Fractional Rank Estimation Method Blom's
Rank Assigned to Ties Mean rank of tied
values
Estimated Distribution Parameters
BMI A BMI B
Normal
Distribution
Location 37.7670 31.9792
Scale 13.96630 8.20301
tabler-icon-diamond-filled.svg

Paraphrase This Document

Need a fresh take? Get an instant paraphrase of this document with our AI Paraphraser
Document Page
Document Page
chevron_up_icon
1 out of 16
circle_padding
hide_on_mobile
zoom_out_icon
[object Object]