US30 DB2: Comparing and Contrasting Different Chart Types
VerifiedAdded on 2022/10/19
|7
|953
|362
Homework Assignment
AI Summary
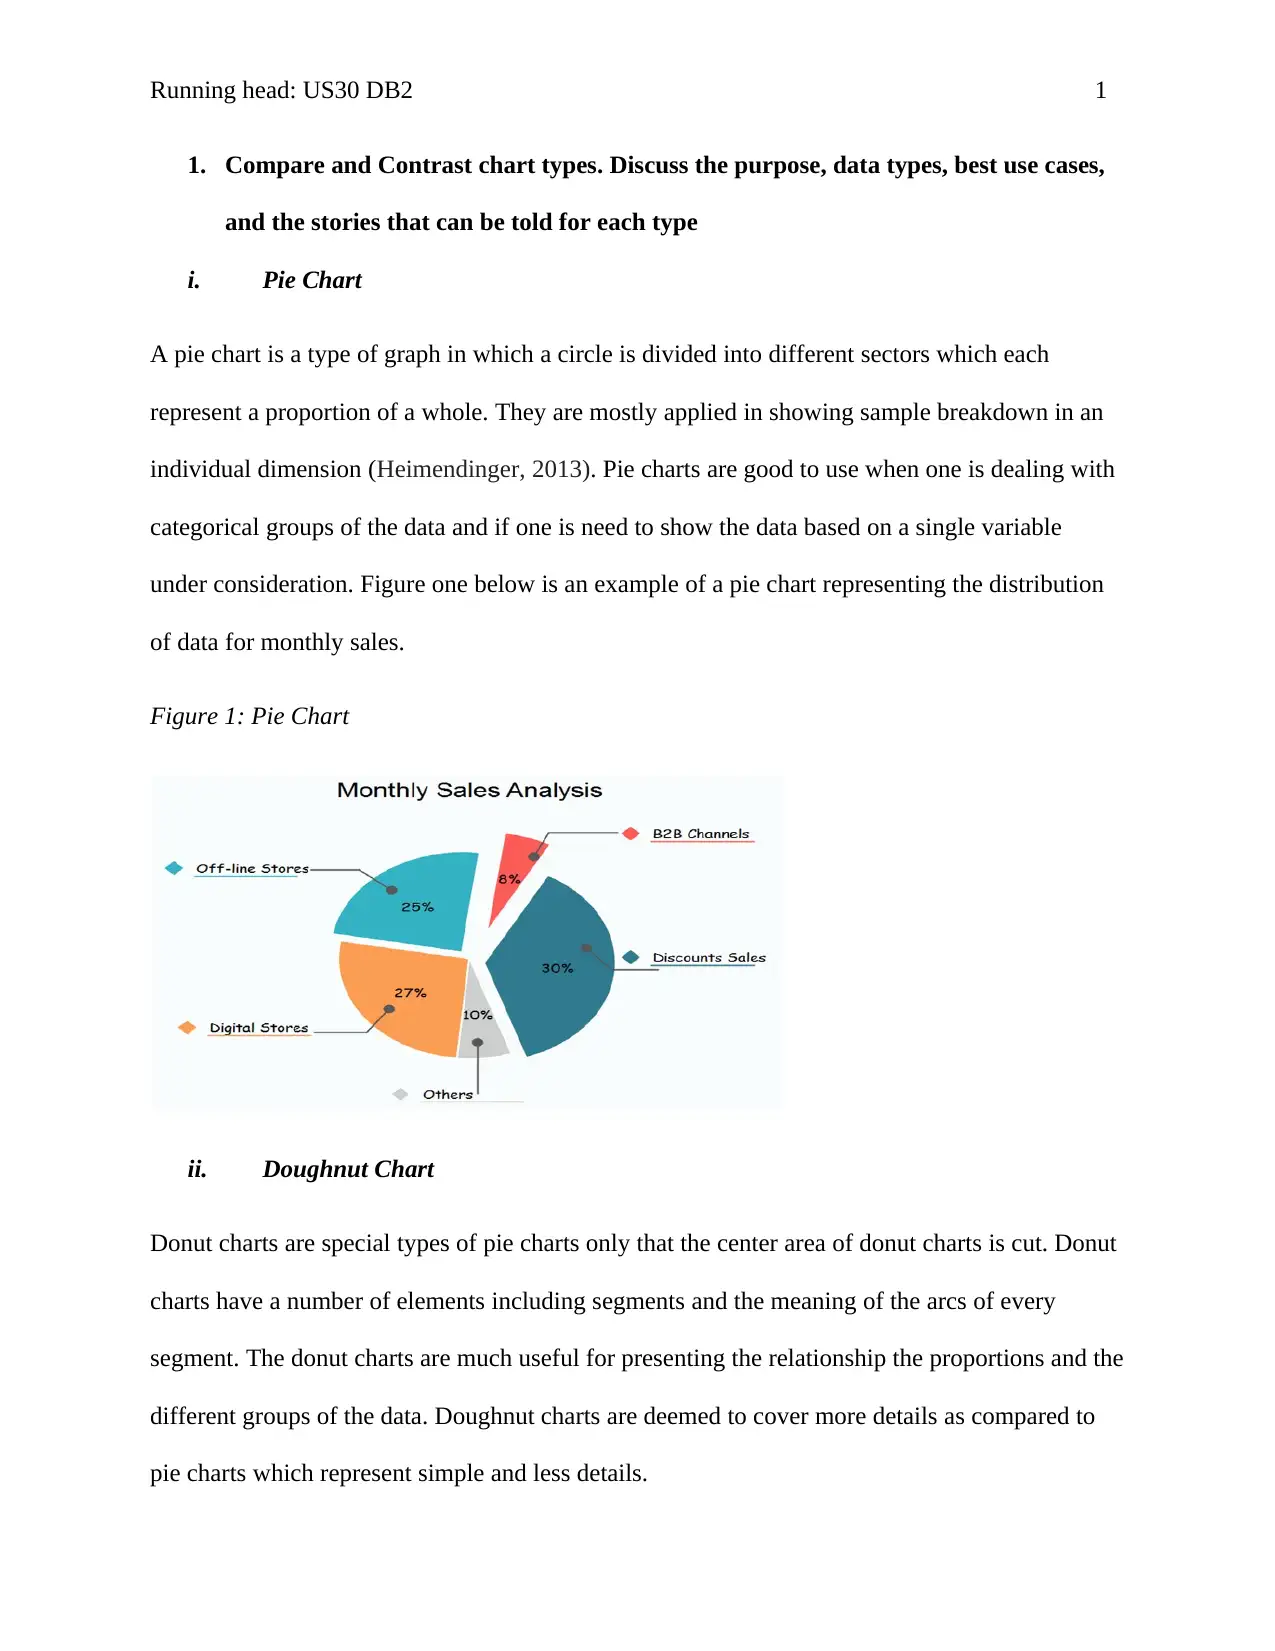
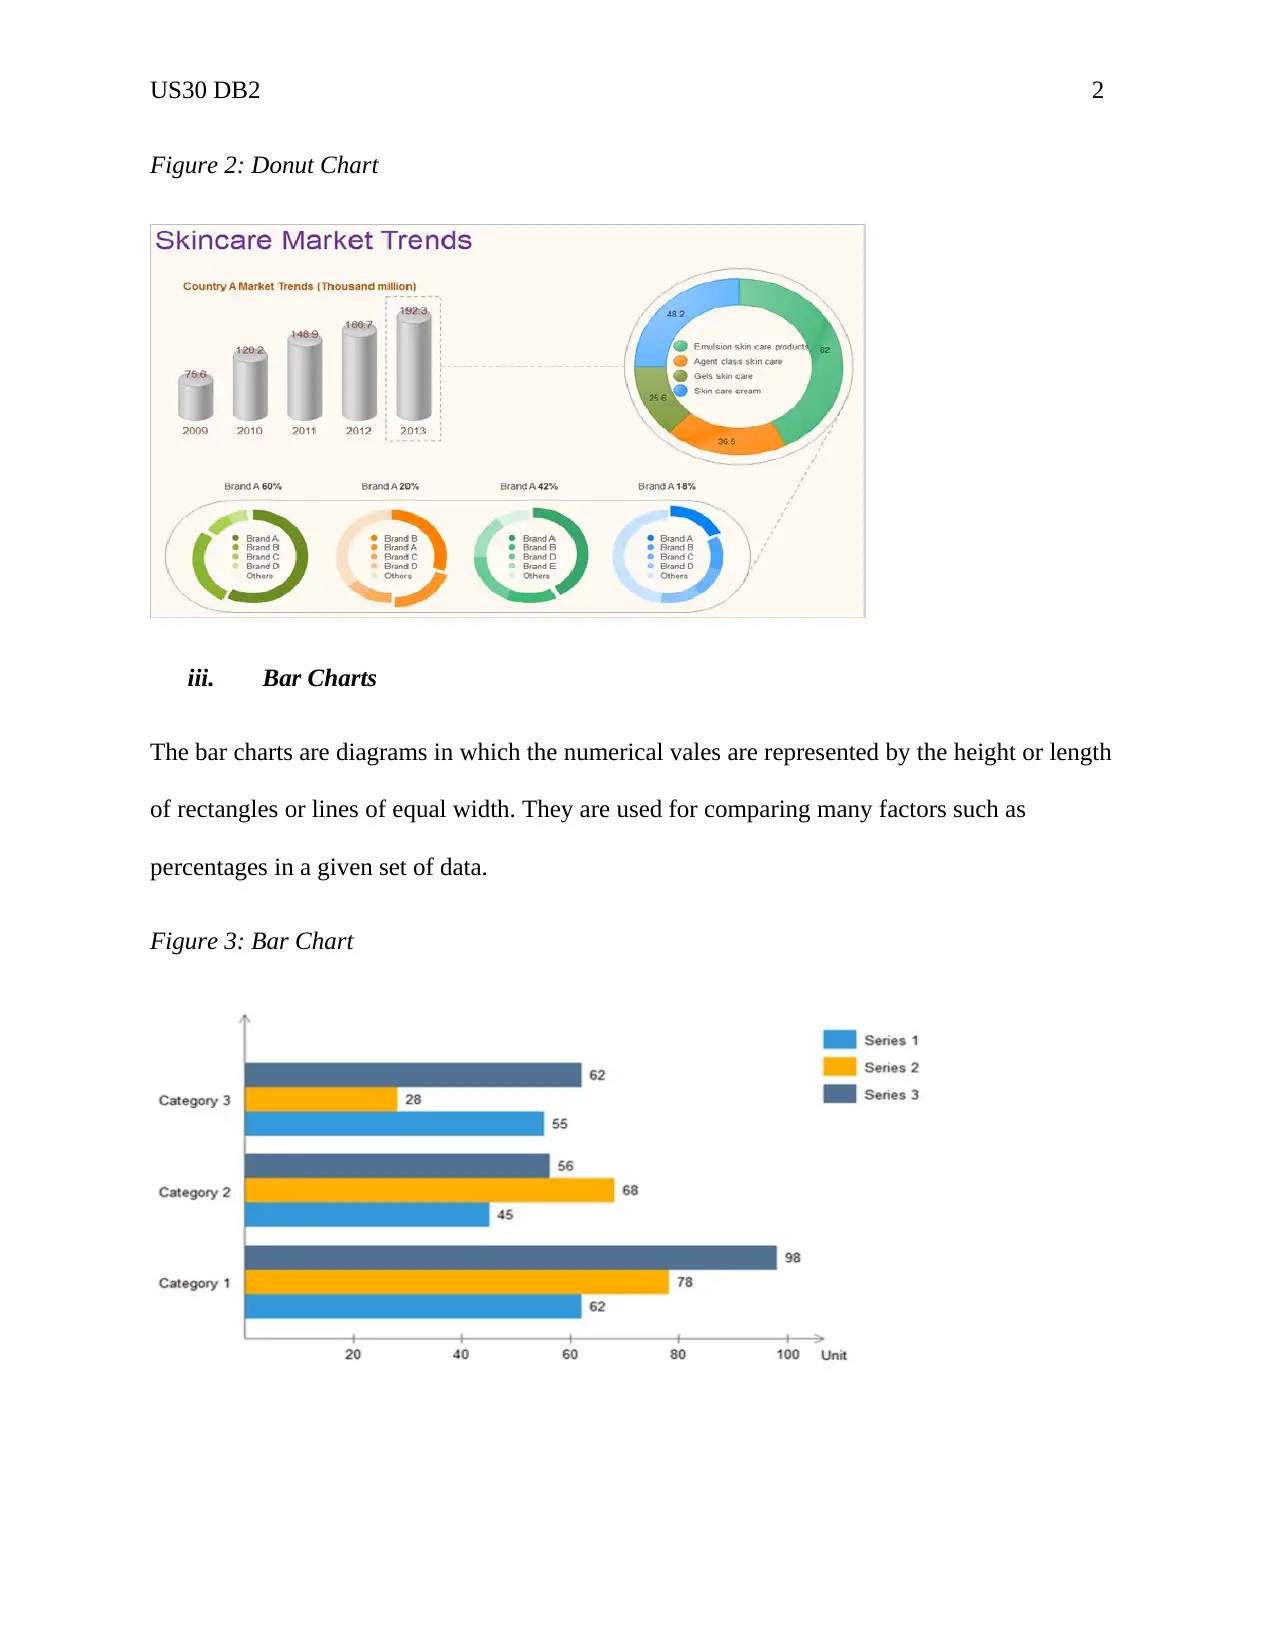
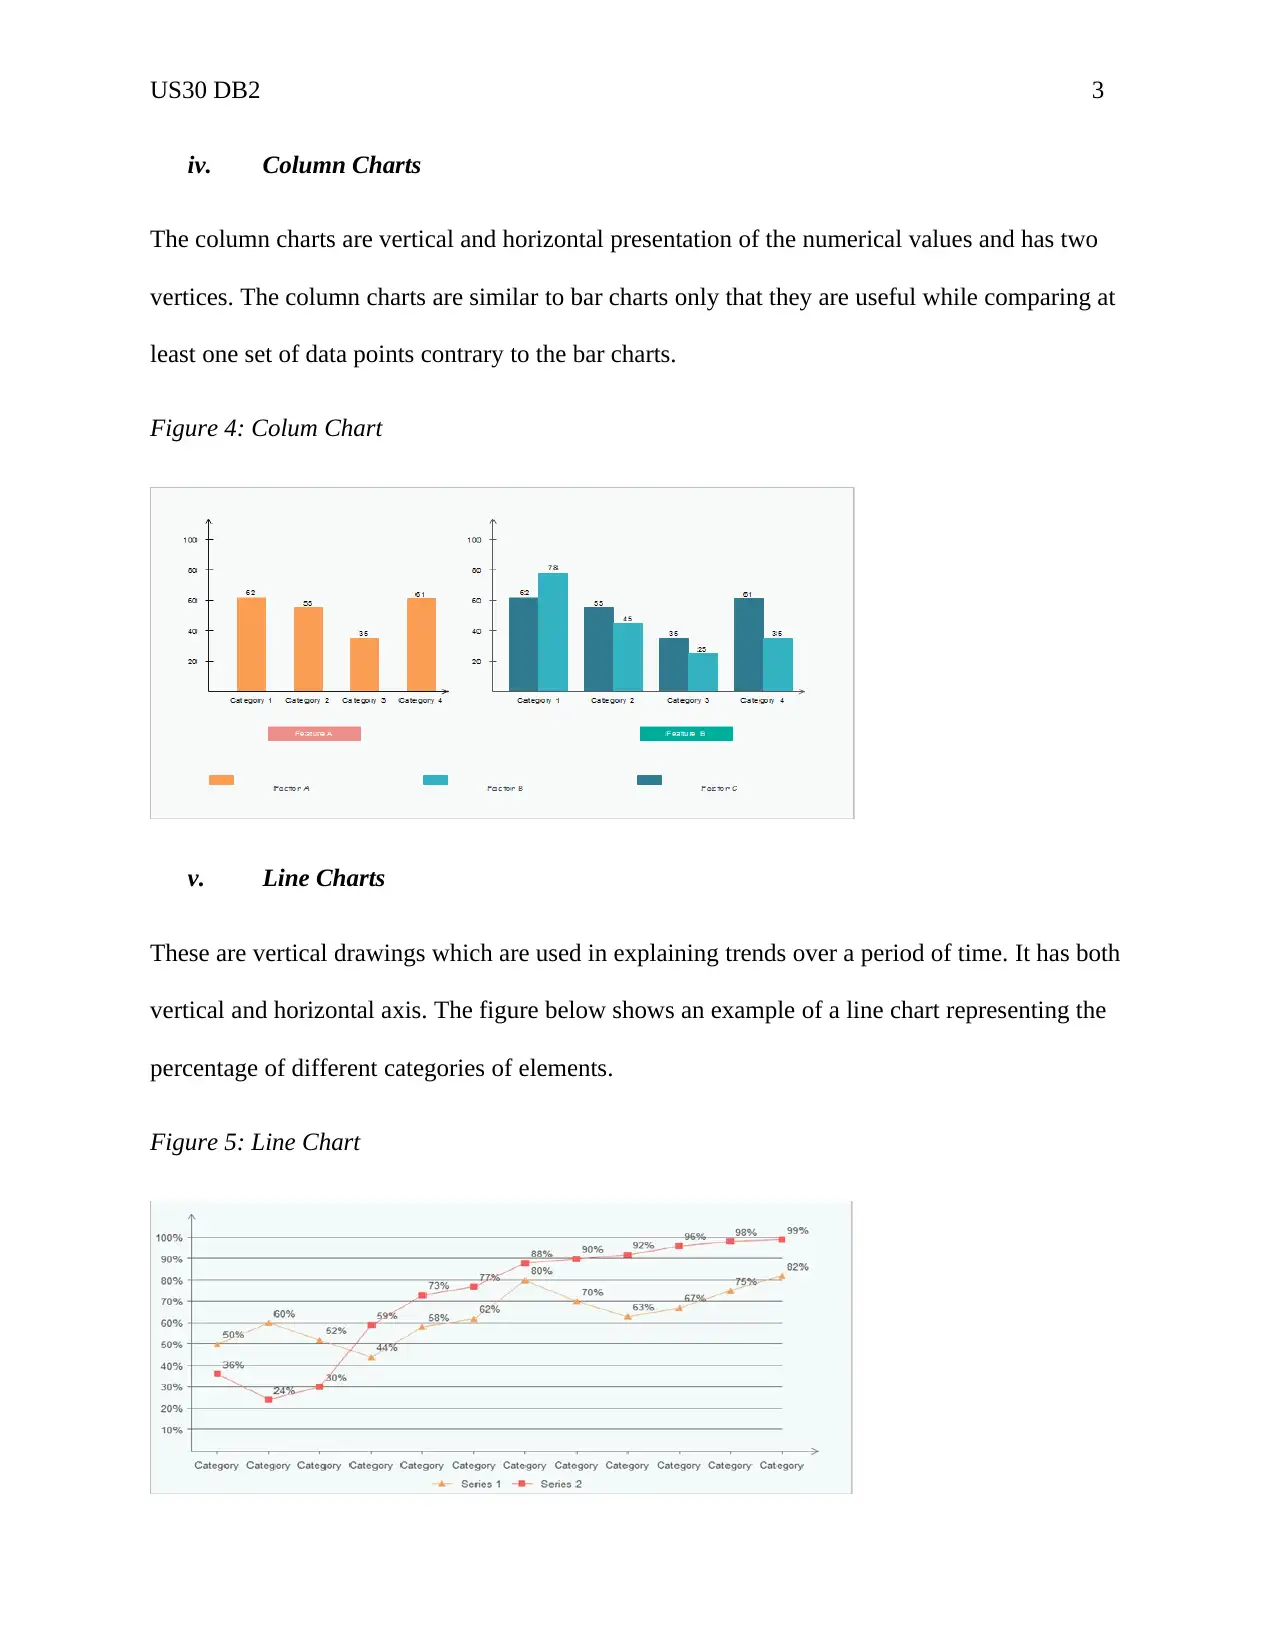
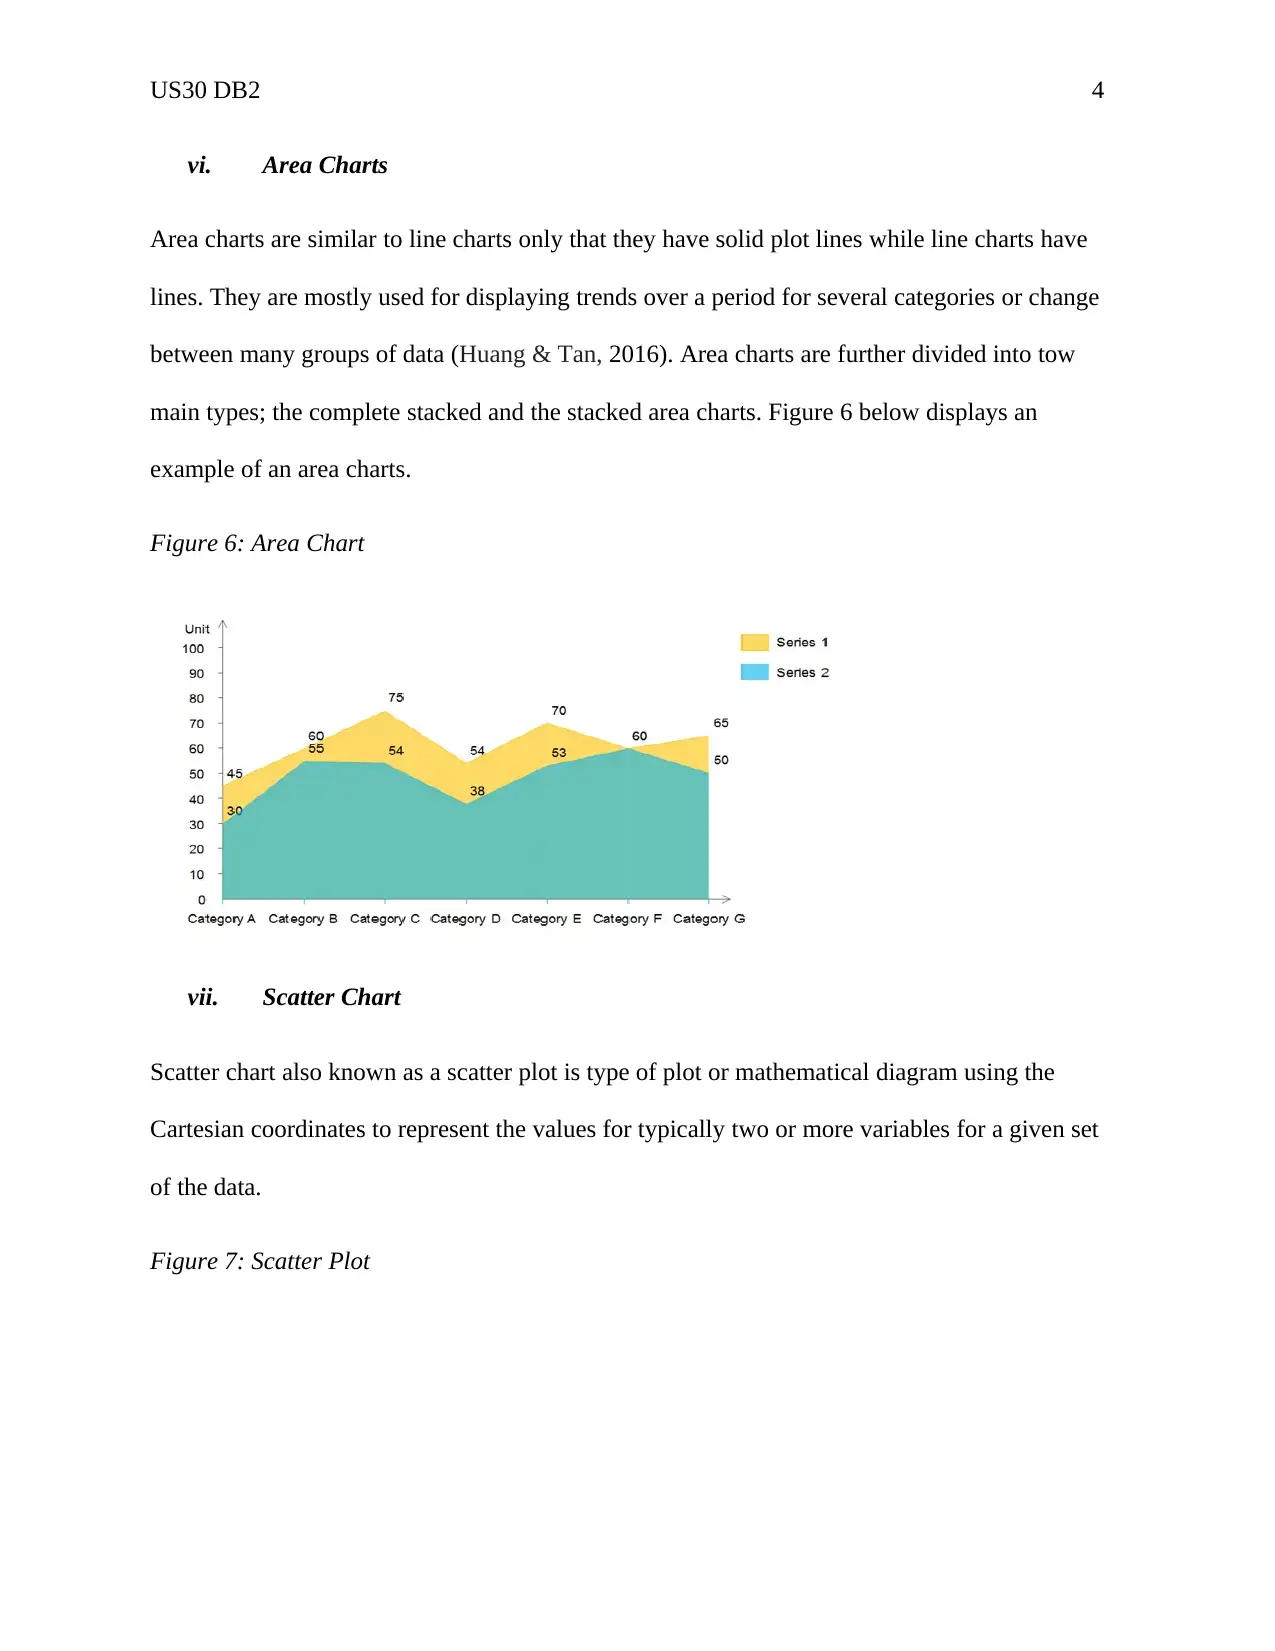
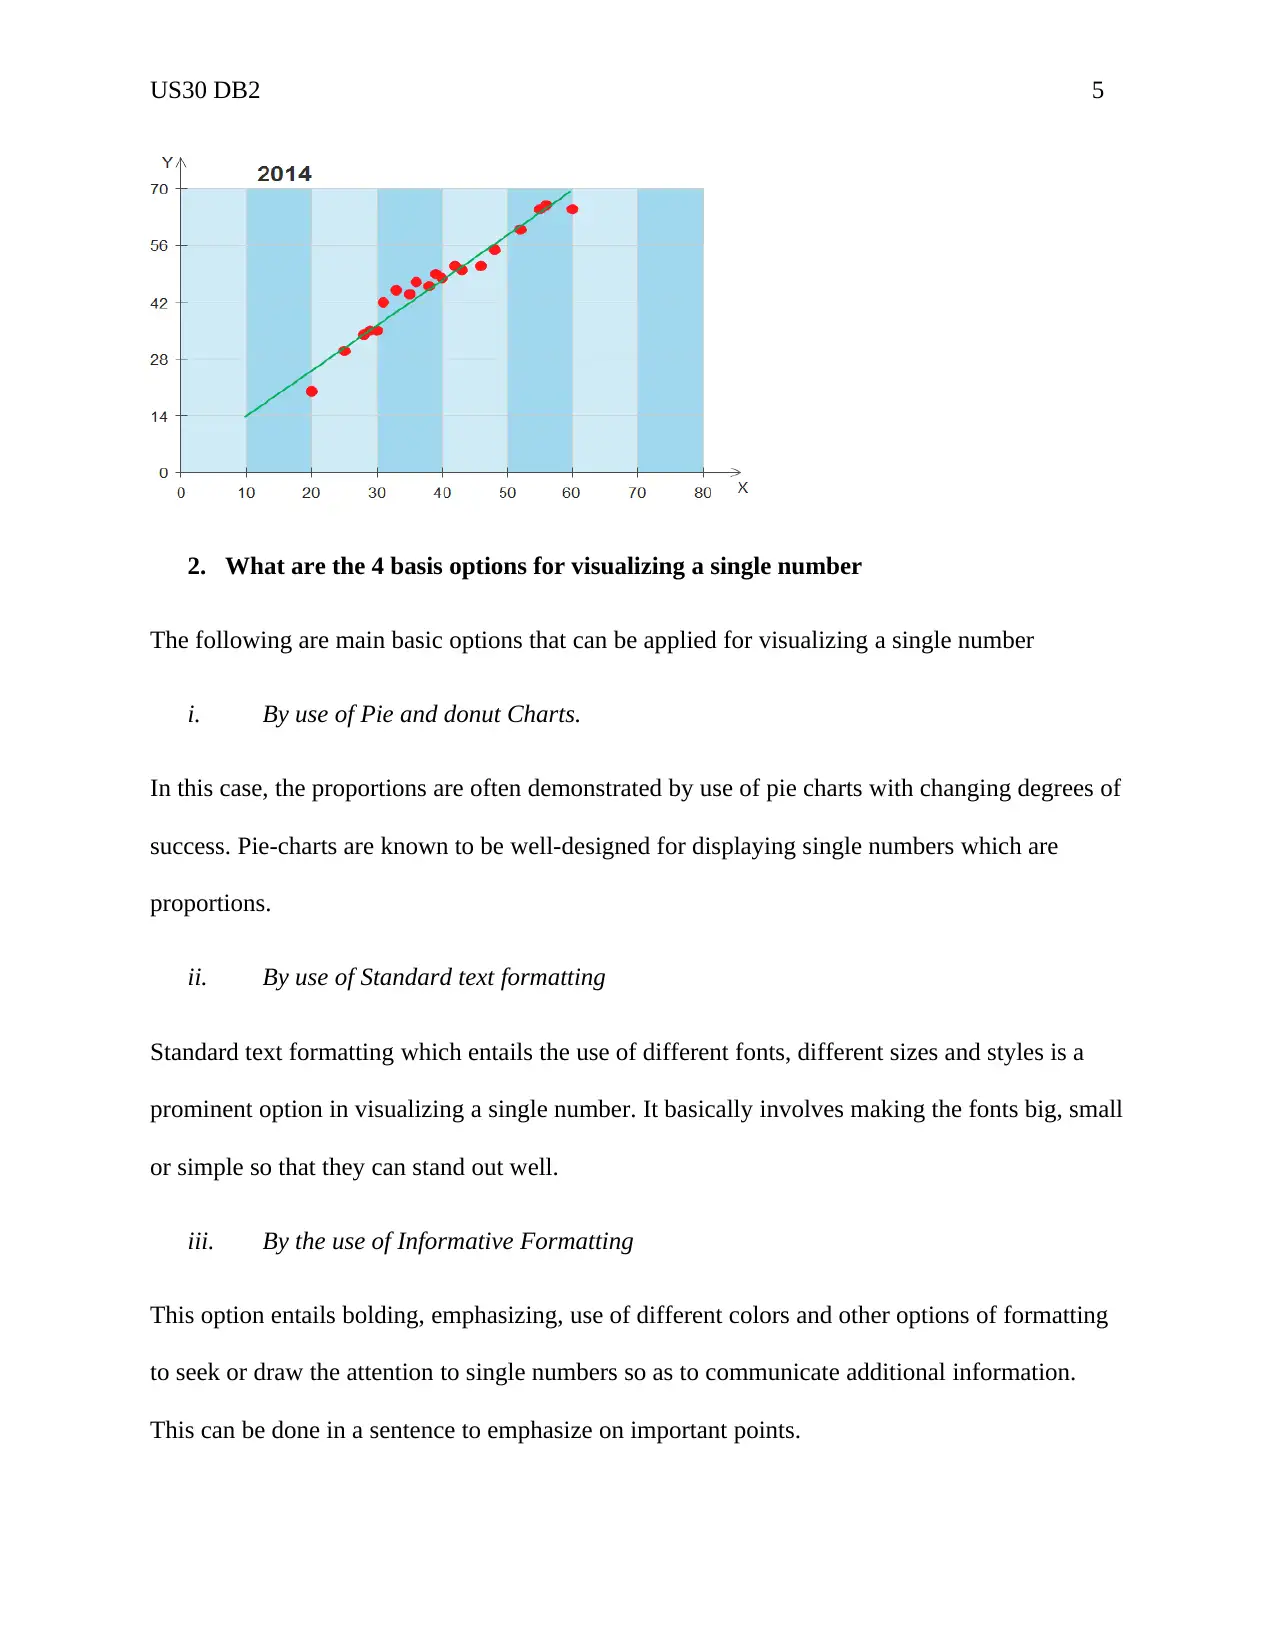
This assignment provides a comprehensive comparison of various chart types used in data visualization. It explores the purpose, data types, and best use cases for pie charts, donut charts, bar charts, column charts, line charts, area charts, and scatter charts. The document explains the specific applications of each chart type, including when they are most effective for representing different types of data and communicating insights. Additionally, it addresses different options for visualizing a single number and discusses the appropriate scenarios for using donut charts. The assignment also includes references to support the information presented. This assignment is useful for students to understand various aspects of data presentation through different charts.
1 out of 7
Related Documents


Your All-in-One AI-Powered Toolkit for Academic Success.
+13062052269
info@desklib.com
Available 24*7 on WhatsApp / Email
![[object Object]](/_next/static/media/star-bottom.7253800d.svg)
Copyright © 2020–2026 A2Z Services. All Rights Reserved. Developed and managed by ZUCOL.