Data Visualization Intro - MS4402, Lecture 02, Recap

Verified

Added on  2020/10/15

|59
|2510
|122
Homework Assignment
AI Summary
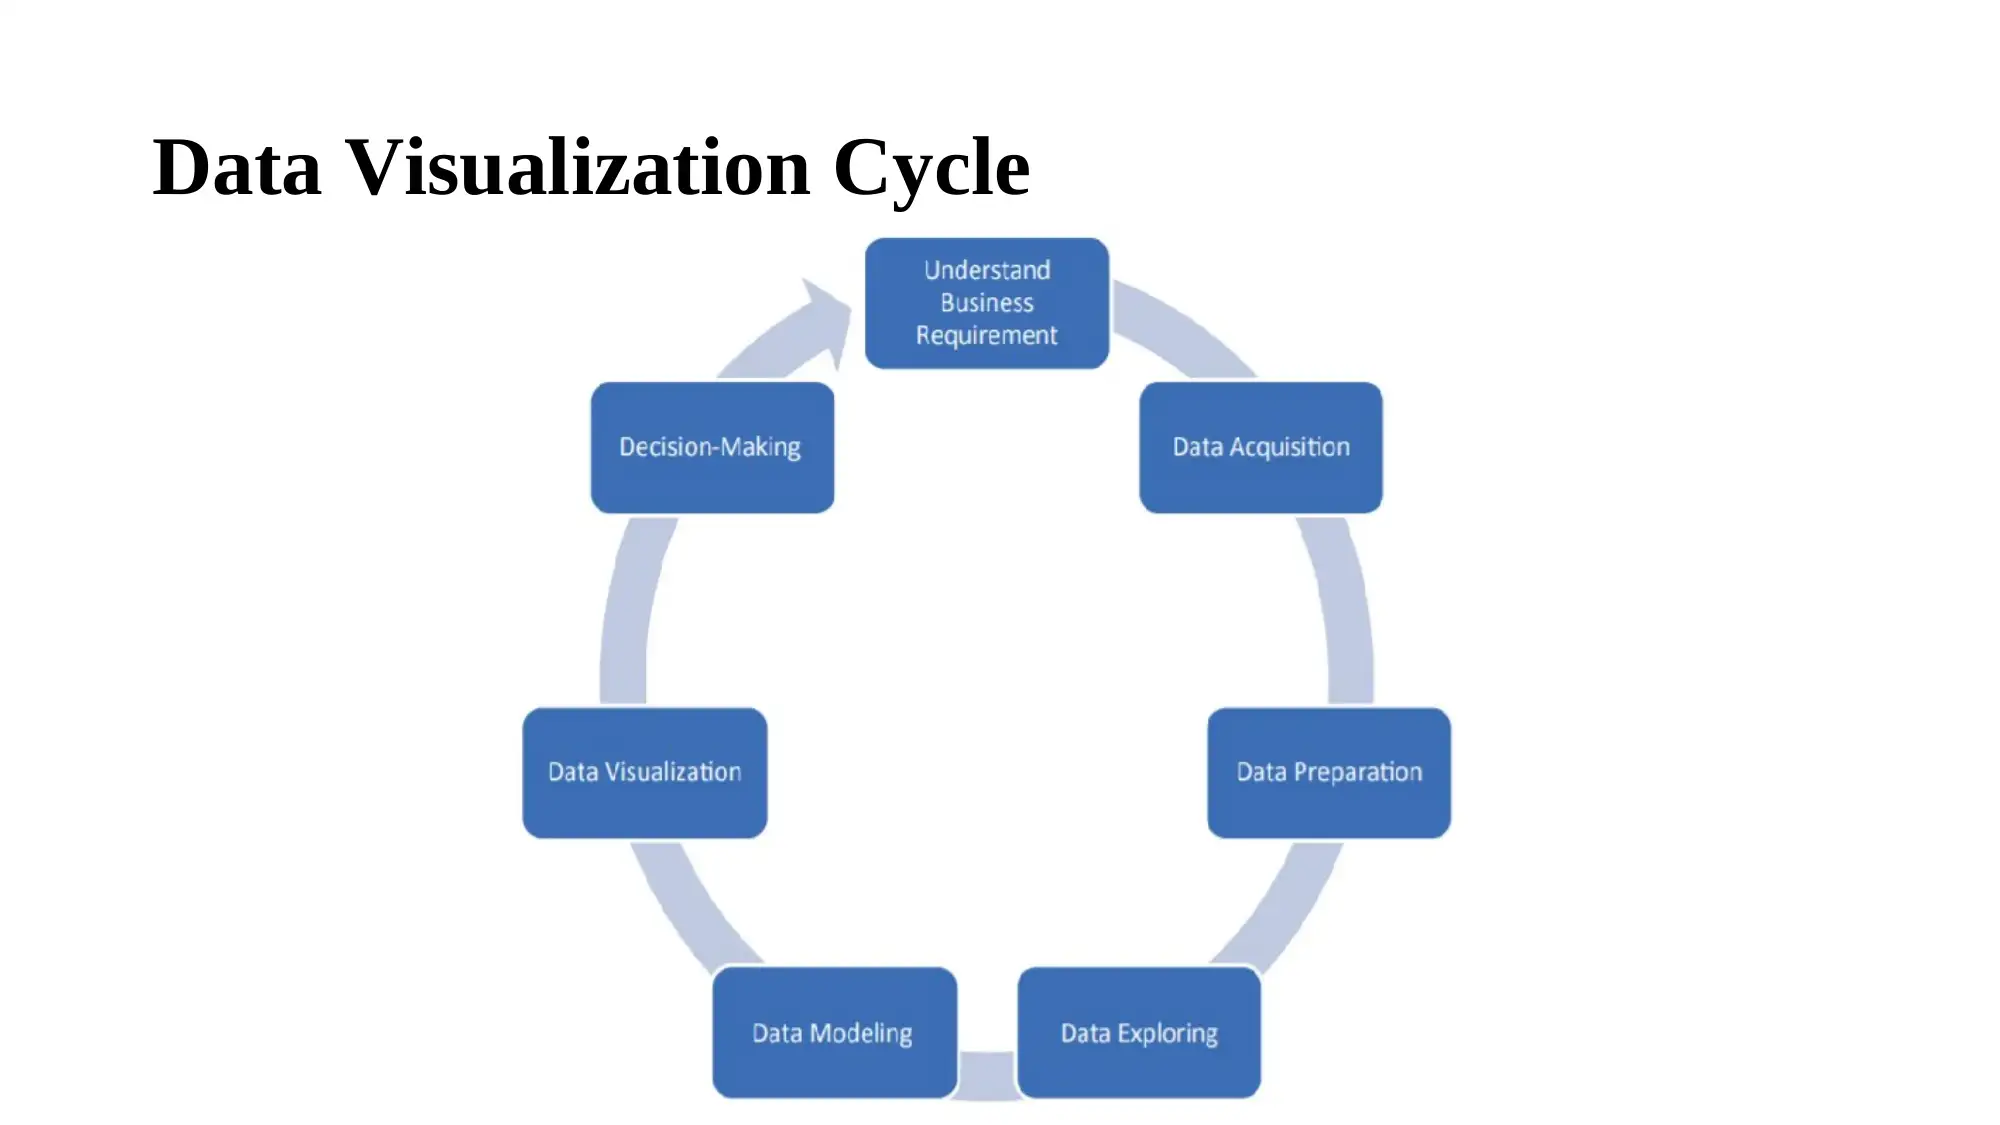
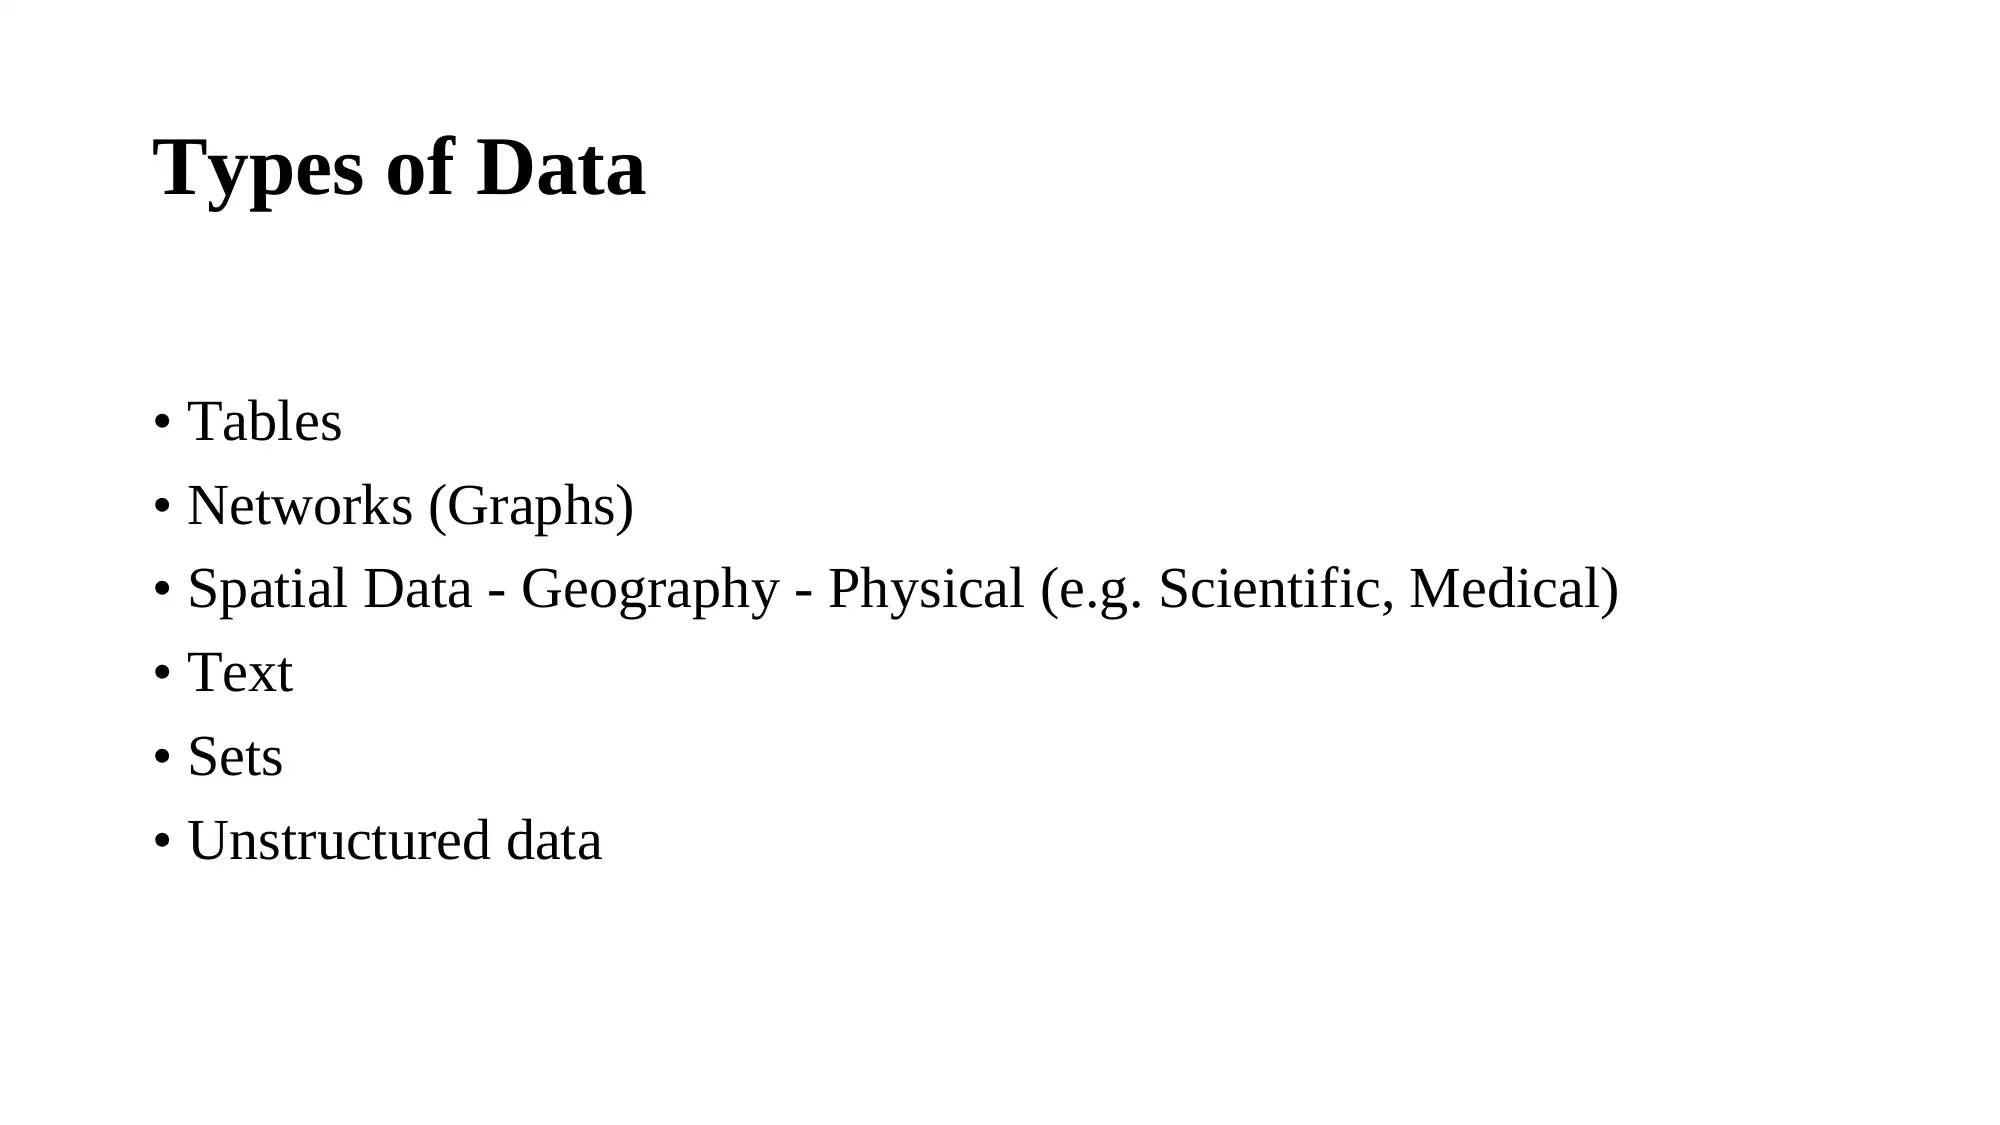
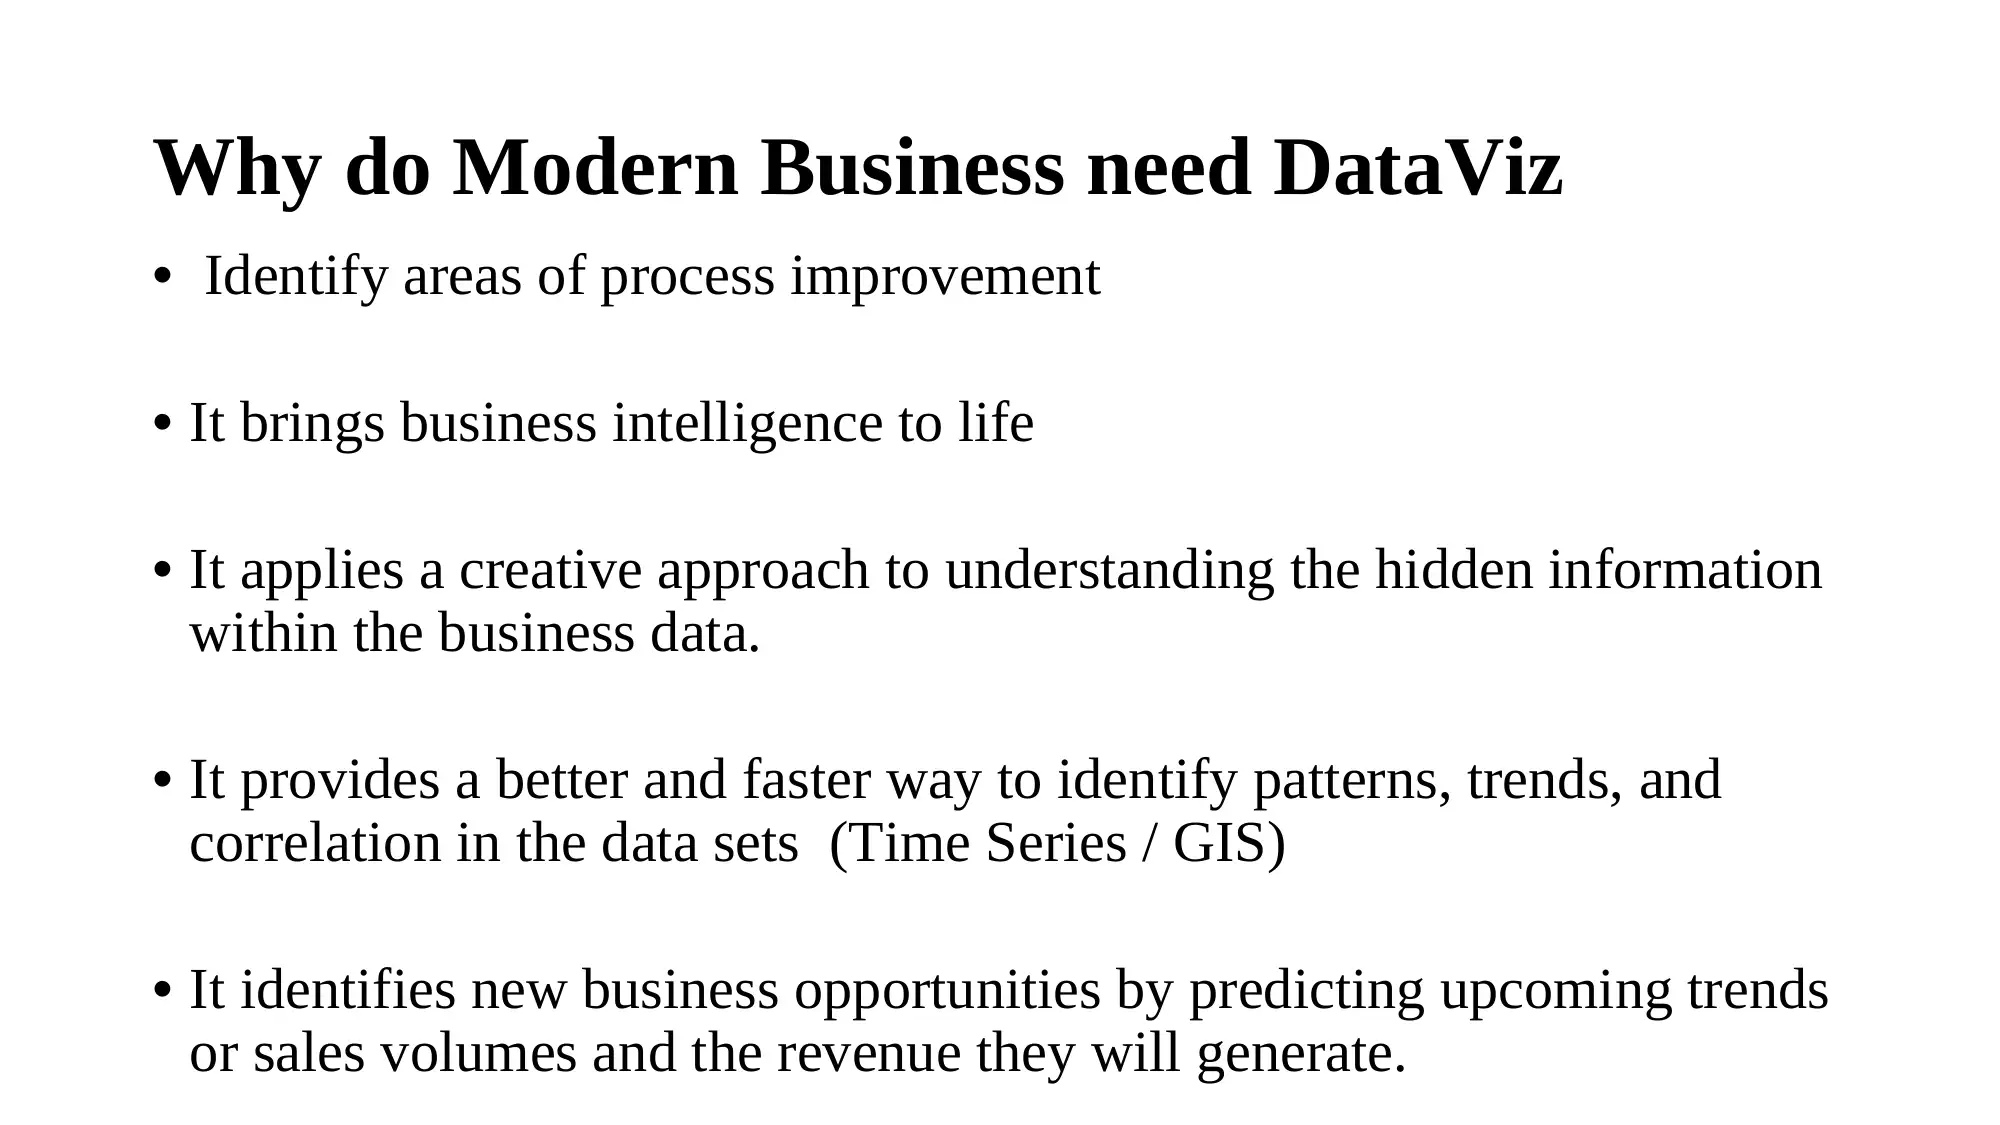
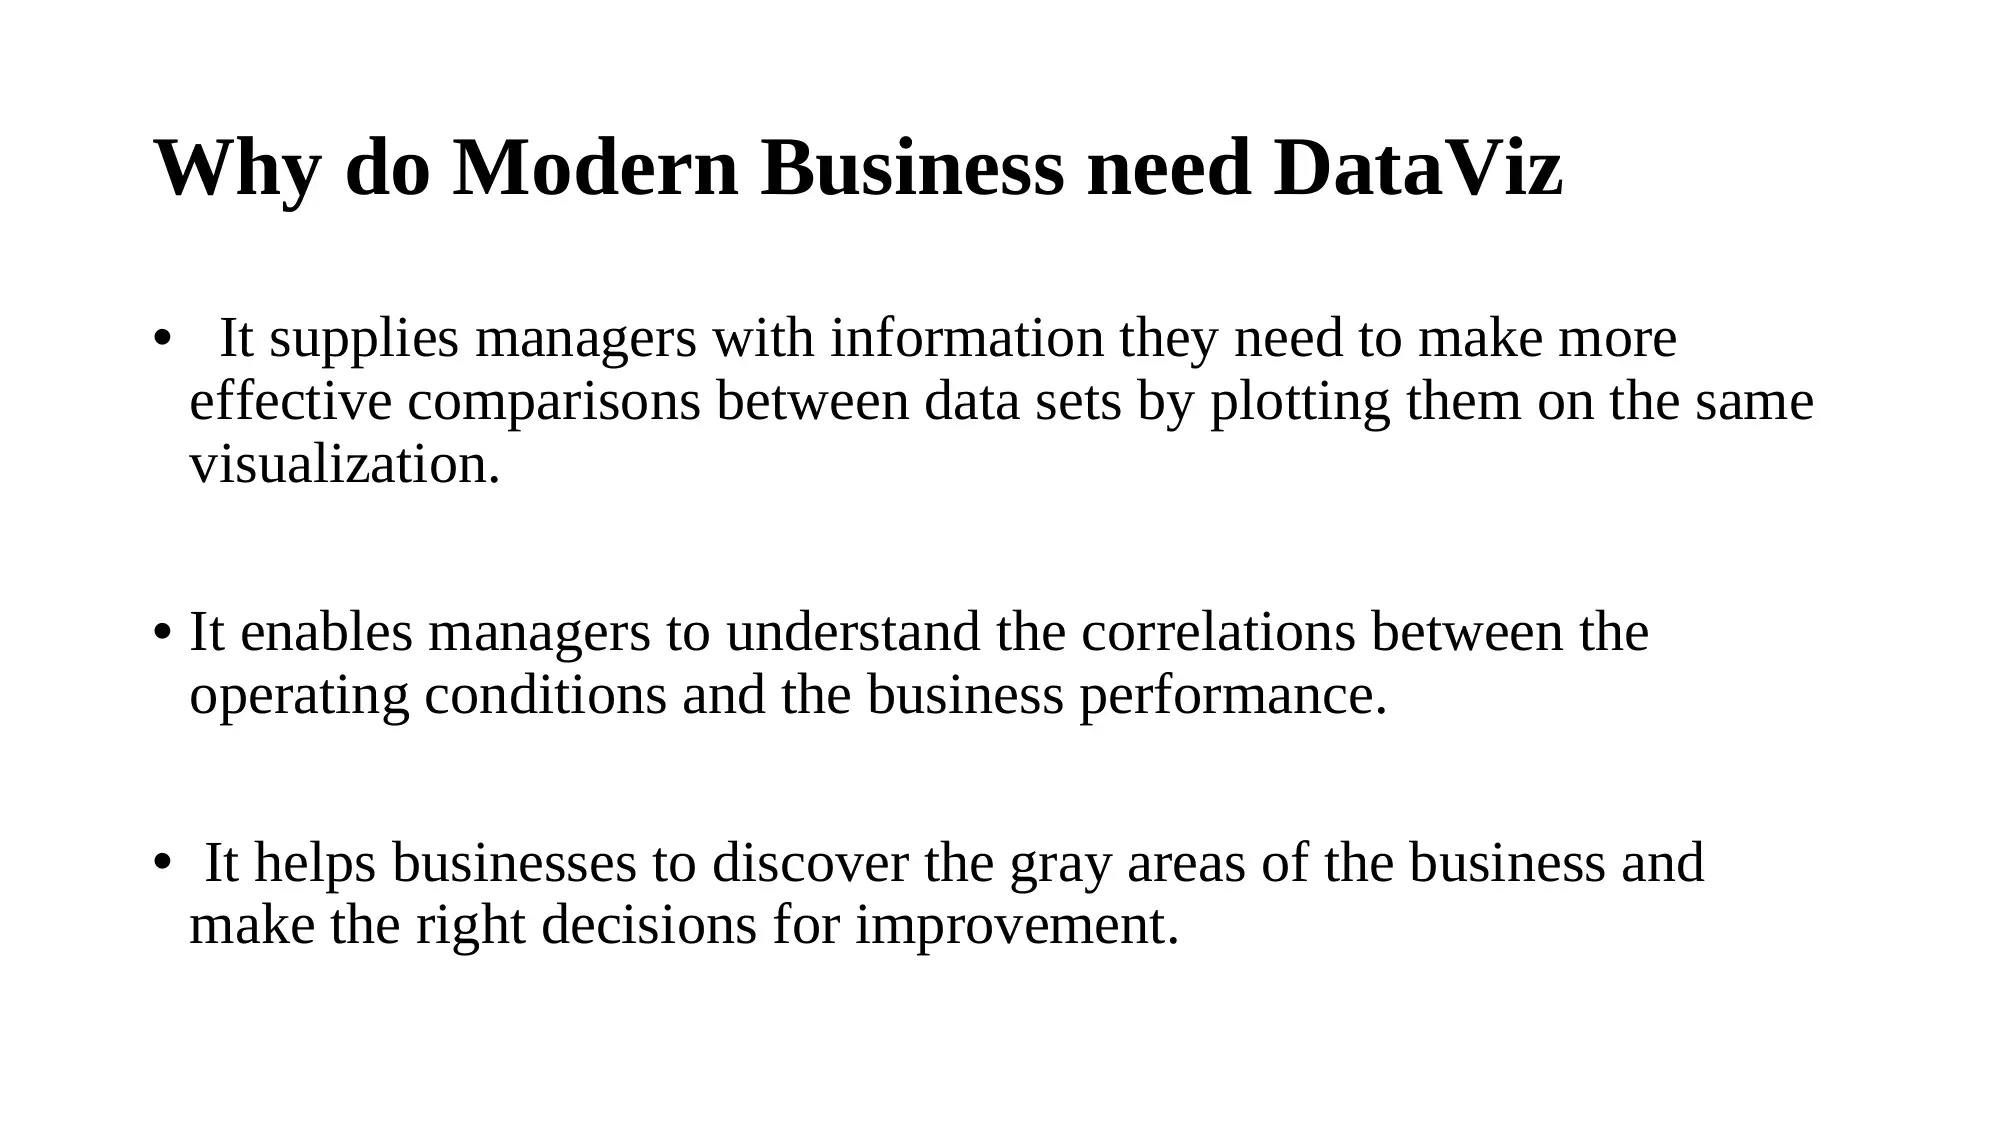
This assignment, focused on data visualization, provides a comprehensive overview of the subject, beginning with its definition and historical context. It emphasizes the multidisciplinary nature of visualization, drawing from art, science, and technology. The assignment explores the need for creating visualizations, highlighting their value in recording, analyzing, and communicating data. It delves into the data visualization cycle, goals of data visualization, and the importance of data visualization in modern business, including how it's used for business decisions. Different types of data and the tools used for data visualization, including desktop applications, programming frameworks, and server applications, are discussed. The assignment also covers choosing the right visualization software, reproducibility, repeatability, data exploration, and data presentation. It also explains the separation of content and design, the two basic types of data visualization, and the quality of a visualization. The assignment touches upon the need for managers with data-analytic skills, the definition of DataViz, and the role of computers and visual elements in data interpretation. It also covers why design is important, key considerations, expressiveness, effectiveness, and the nested design model.
Document Page
Data Visualizations
Intro - 1
Lecture 02 – MS4402 - Data Visualizations
B Sundaram
tabler-icon-diamond-filled.svg

Paraphrase This Document

Need a fresh take? Get an instant paraphrase of this document with our AI Paraphraser
Document Page
Recap
Visualization Context – Volume & Definiton
History of Visualization
Visualization – Multidisciplinary – Art, Science, Technology
What is Visualization?
Need for creating Visualization
Value of Visualization – Record, Analyse, Communicate
Visualization challenges
Visualization Research
Document Page
Outline
Data Visualization Cycle
Why is DataViz important
Goals of DataViz
Why do modern biz need DataViz
How DataViz used for business decisions
Tools of DataViz
Choosing the right visualization software
What is DataViz
Need for managers with Data Analytics skills
Downsides of DataViz
Document Page
The purpose of computing is about insight, not
numbers”
- R. W. Hamming
tabler-icon-diamond-filled.svg

Paraphrase This Document

Need a fresh take? Get an instant paraphrase of this document with our AI Paraphraser
Document Page
The purpose of visualization is about insight, not
pictures”
- Card, Mackinlay, Schneiderman
Document Page
Data Visualization Cycle
Document Page
Why is DataViz important
A picture is worth a thousand words, as they say.
Humans just understand data better through pictures rather than by
reading numbers
Accordingly, if the data is presented in a graphical format, people are
more able to effectively find correlations and raise important
questions.
Data visualization helps the business to achieve numerous goals.
tabler-icon-diamond-filled.svg

Paraphrase This Document

Need a fresh take? Get an instant paraphrase of this document with our AI Paraphraser
Document Page
Goals of DataViz
Converting the business data into interactive graphs for dynamic
interpretation to serve the business goals
Transforming data into visually appealing, interactive dashboards of
various data sources to serve the business with the insights
Creating more attractive and informative dashboards of various
graphical data representations
Making appropriate decisions by drilling into the data and finding the
insights
Document Page
Goals of DataViz
Figuring out the patterns, trends, and correlations in the data being
analyzed to determine where they must improve their operational
processes and thereby grow their business
Giving a fuller picture of the data under analysis
Organizing and presenting massive data intuitively to present
important findings from the data
Making better, quick, and informed decisions with data visualization
Document Page
Types of Data
Tables
Networks (Graphs)
Spatial Data - Geography - Physical (e.g. Scientific, Medical)
Text
Sets
Unstructured data
tabler-icon-diamond-filled.svg

Paraphrase This Document

Need a fresh take? Get an instant paraphrase of this document with our AI Paraphraser
Document Page
Why do Modern Business need DataViz
Identify areas of process improvement
It brings business intelligence to life
It applies a creative approach to understanding the hidden information
within the business data.
It provides a better and faster way to identify patterns, trends, and
correlation in the data sets (Time Series / GIS)
It identifies new business opportunities by predicting upcoming trends
or sales volumes and the revenue they will generate.
Document Page
Why do Modern Business need DataViz
It supplies managers with information they need to make more
effective comparisons between data sets by plotting them on the same
visualization.
It enables managers to understand the correlations between the
operating conditions and the business performance.
It helps businesses to discover the gray areas of the business and
make the right decisions for improvement.
chevron_up_icon
1 out of 59
circle_padding
hide_on_mobile
zoom_out_icon
[object Object]