California State University: BUS 324 Data Visualization Report

Verified

Added on  2022/08/09

|8
|701
|11
Report
AI Summary
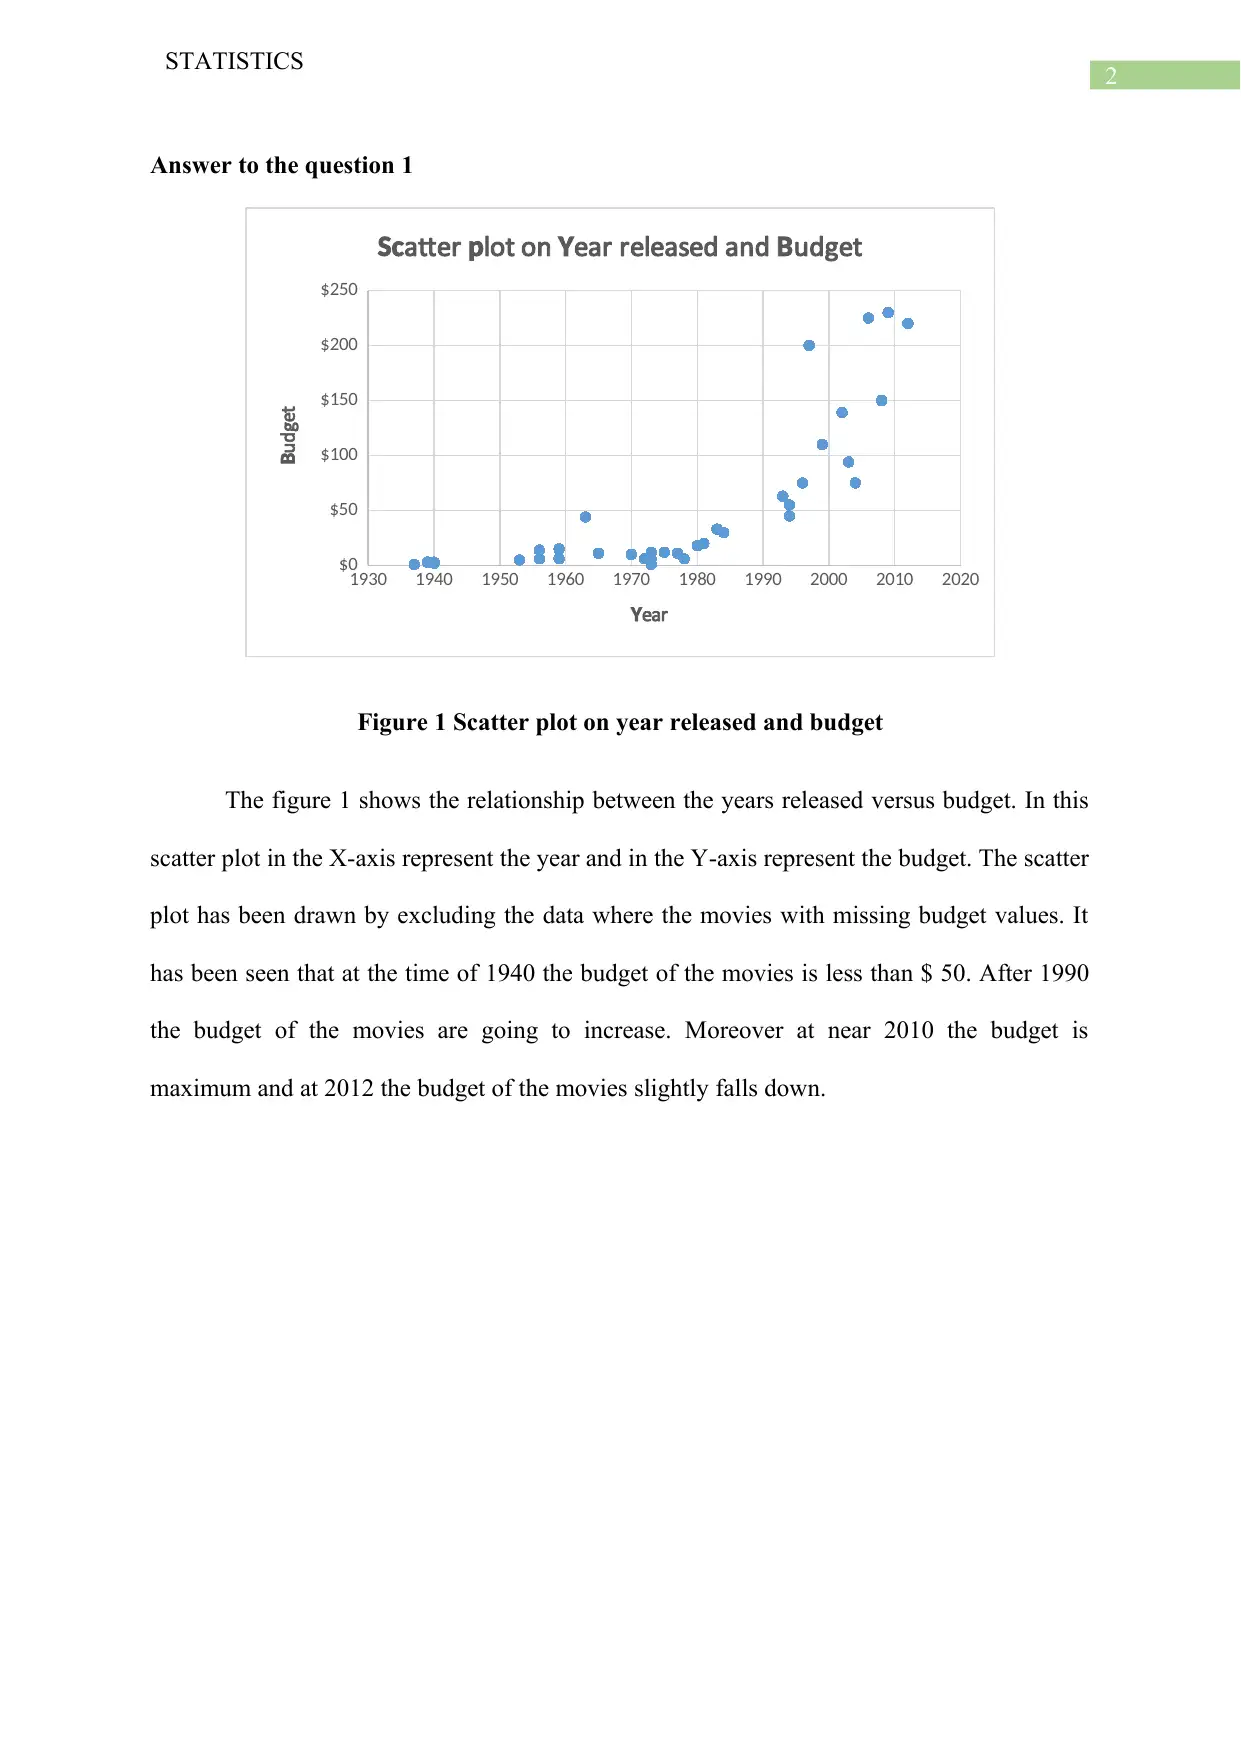
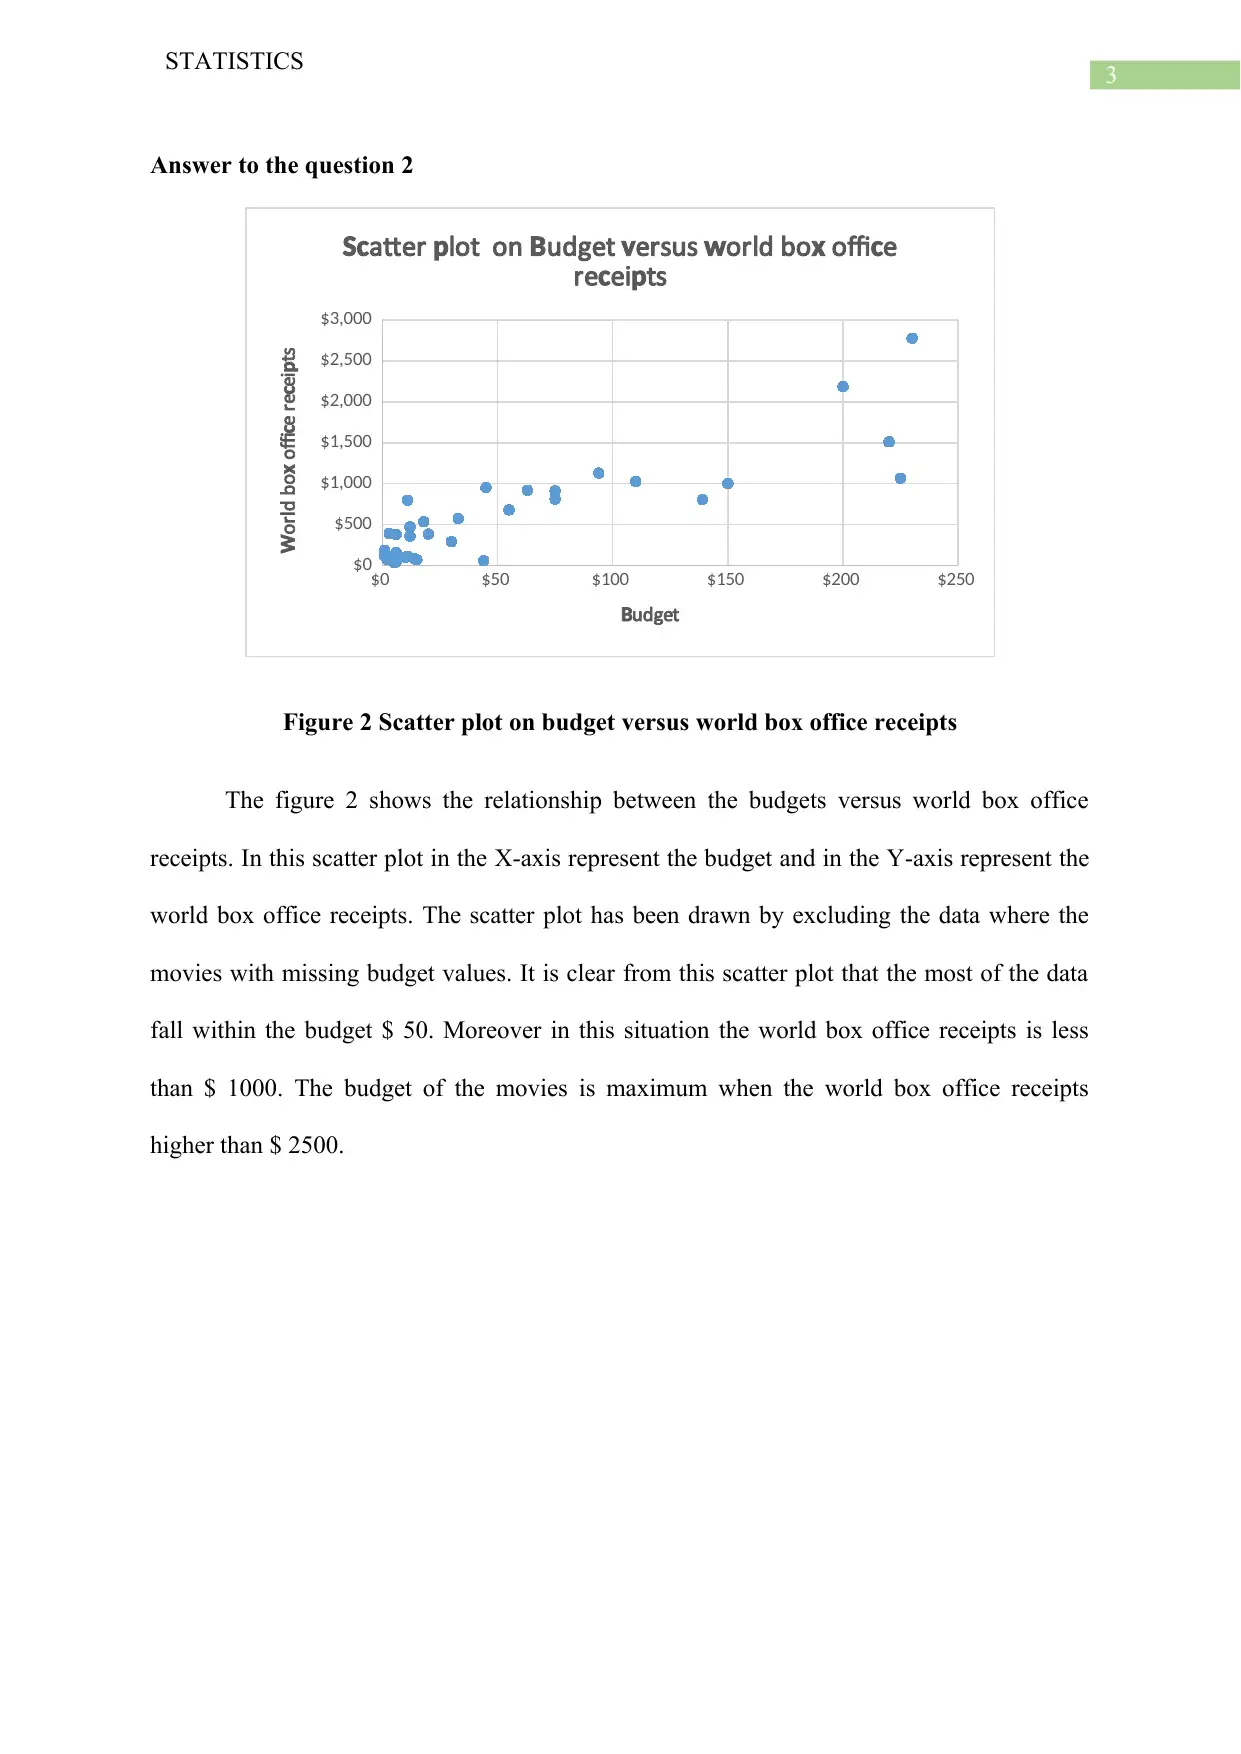
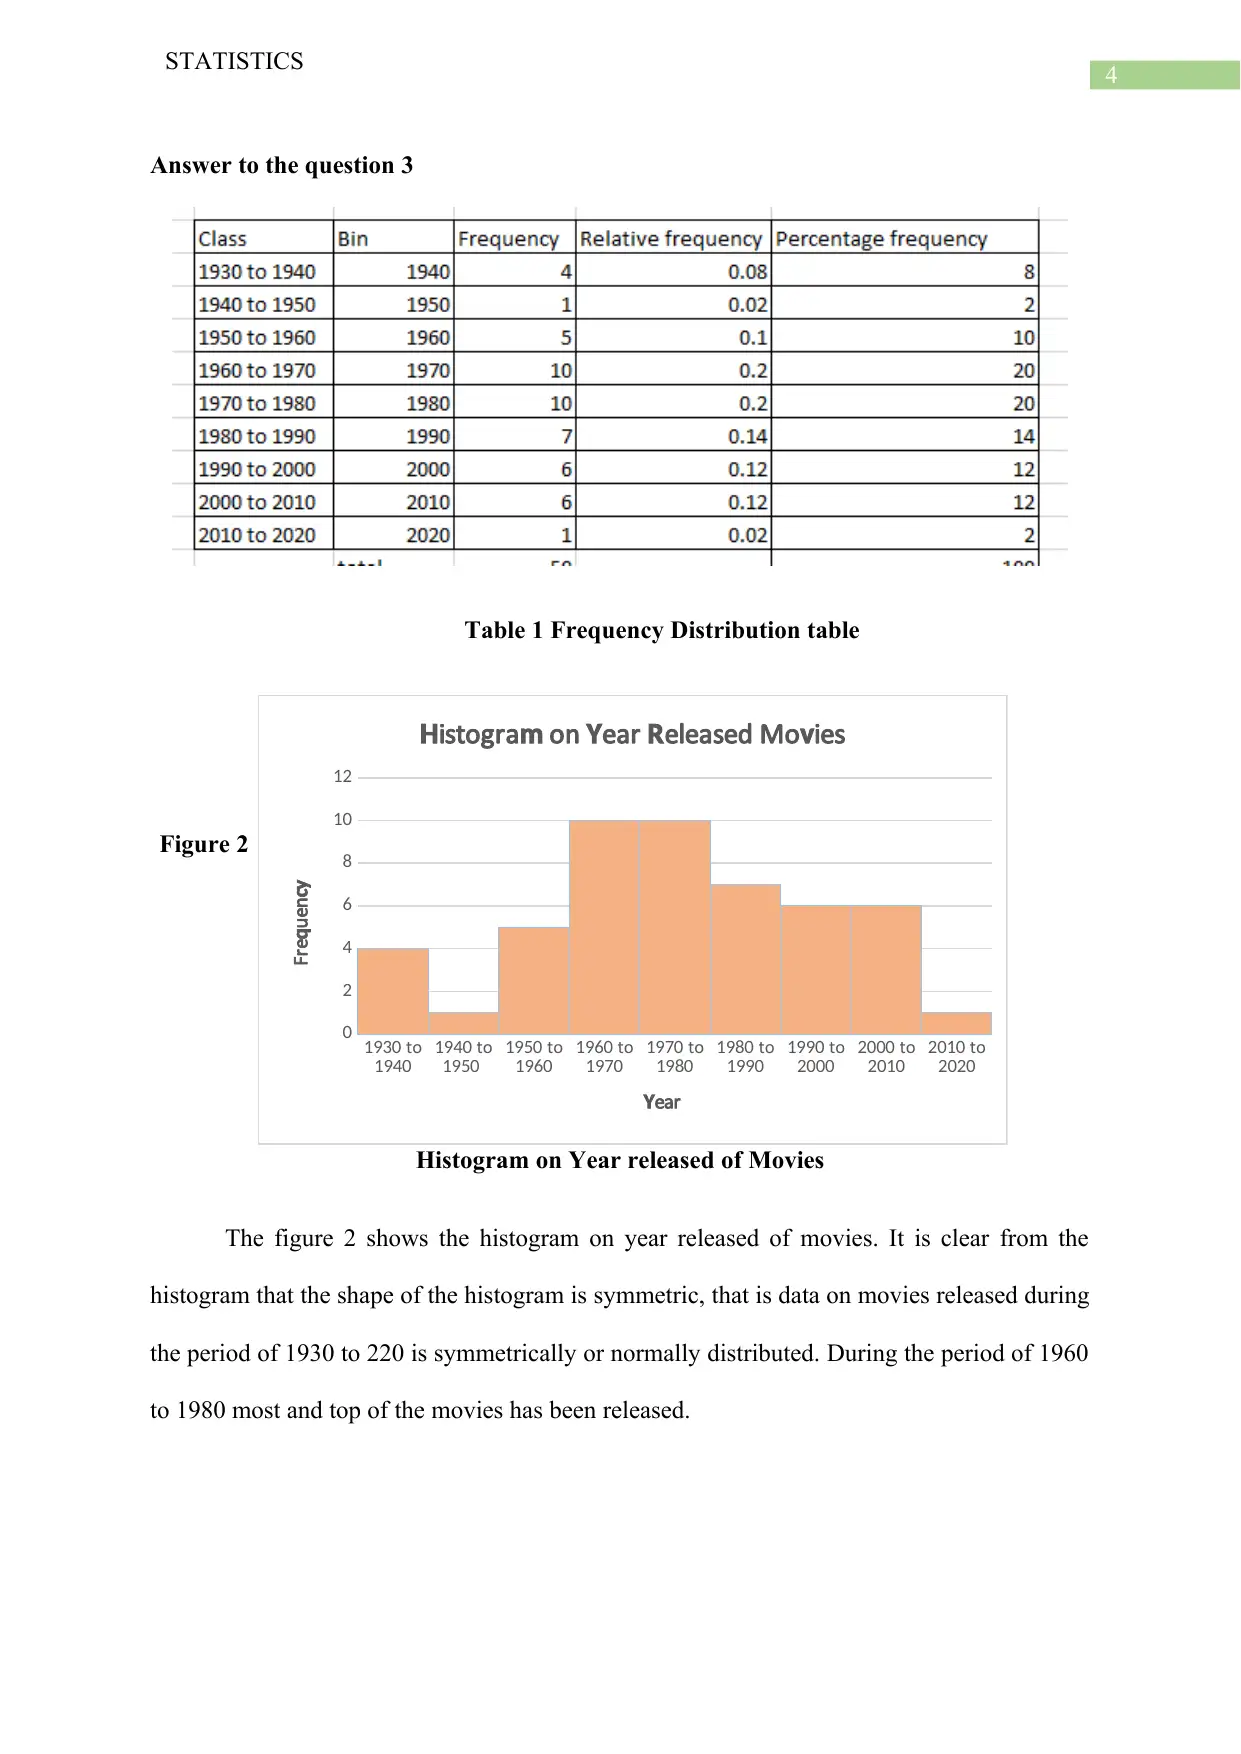
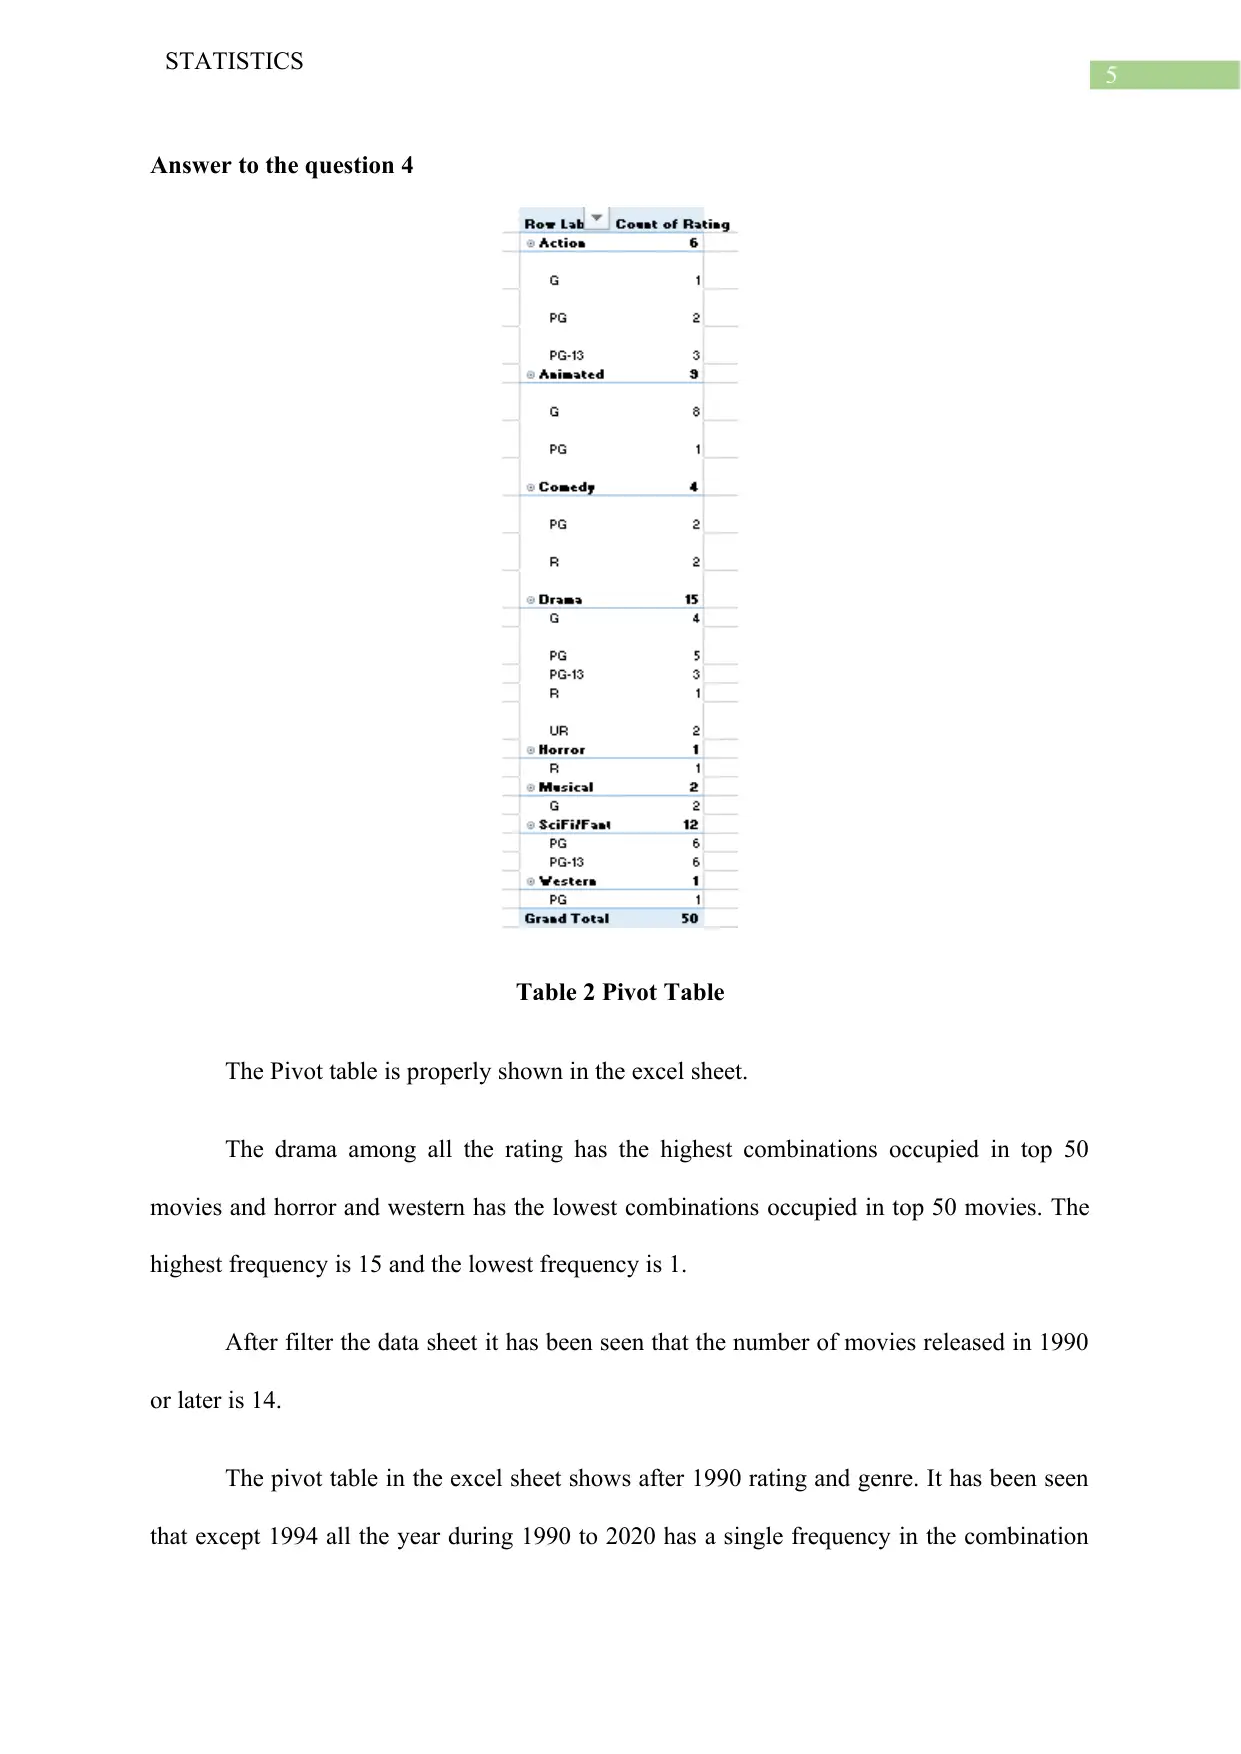
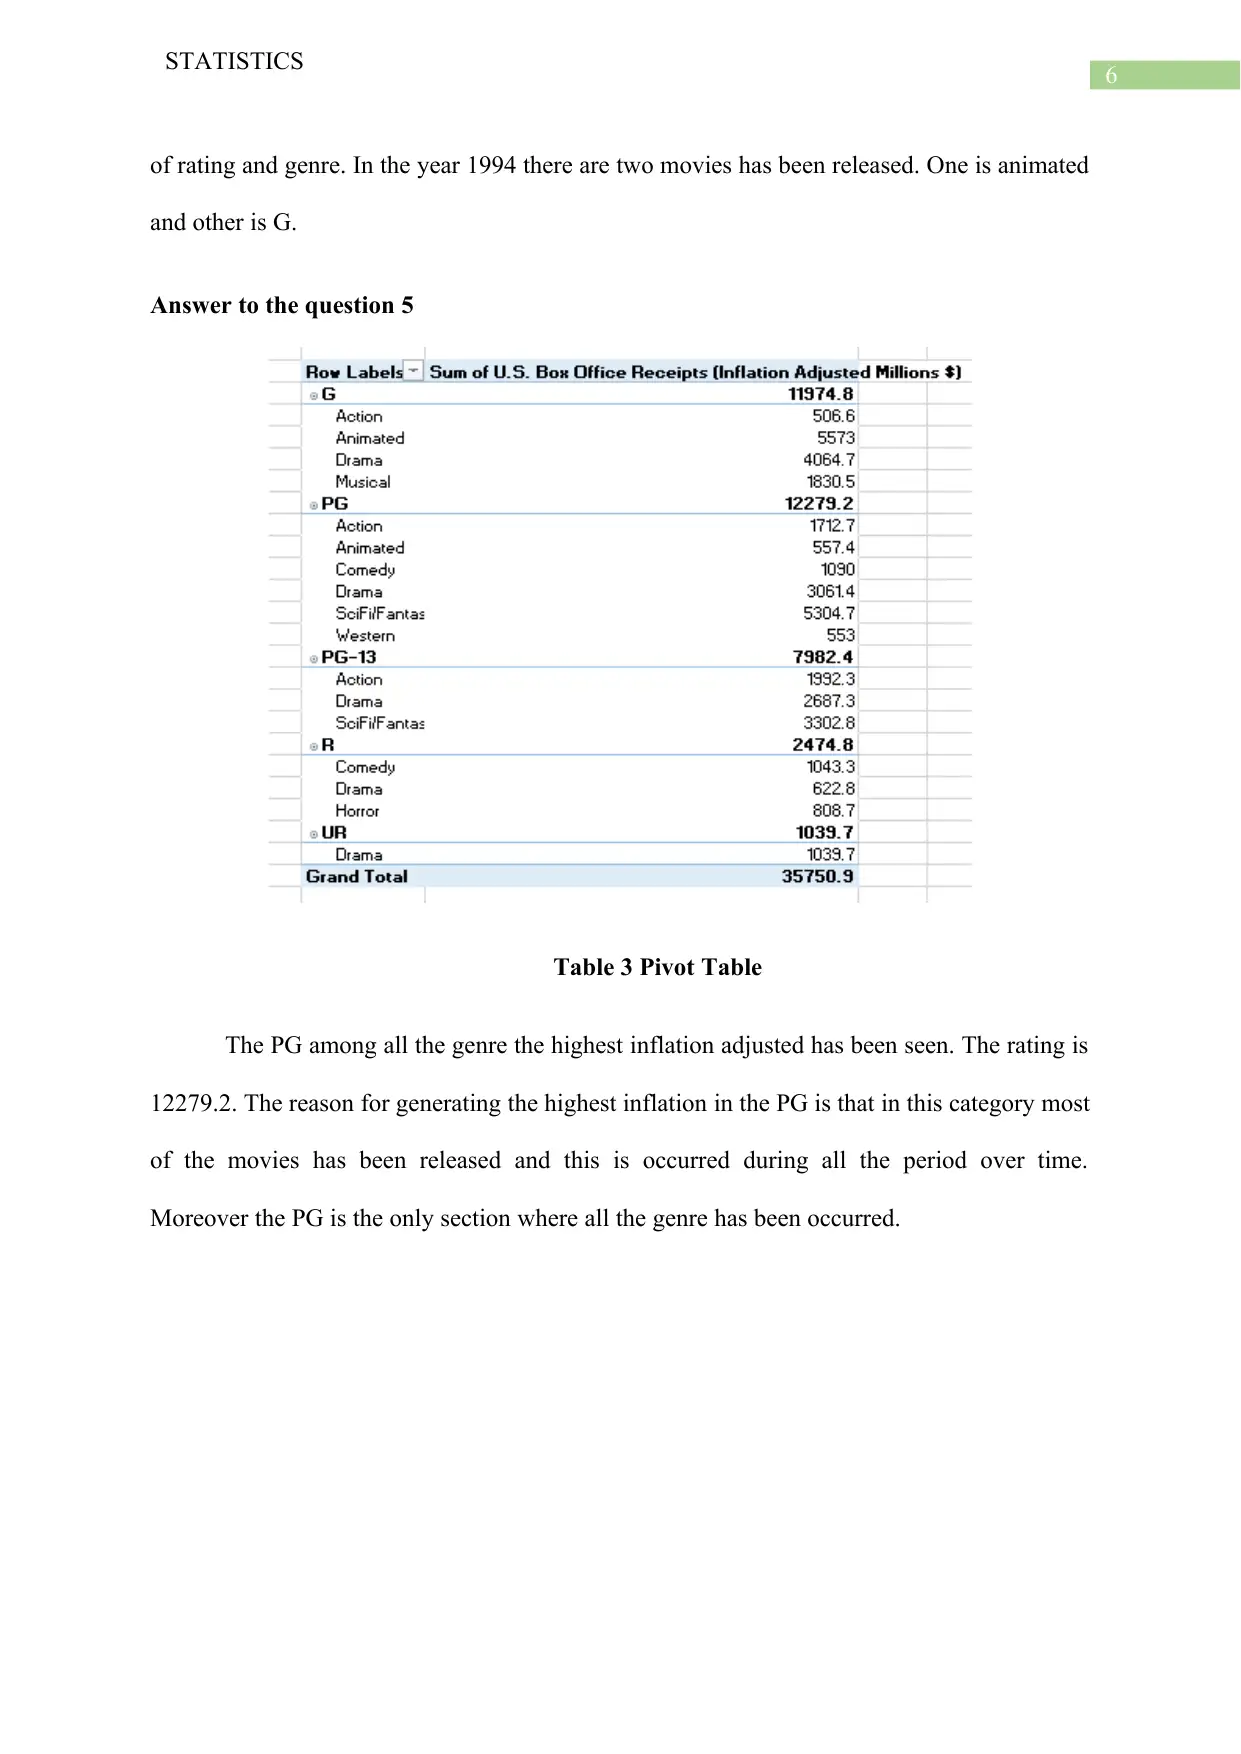
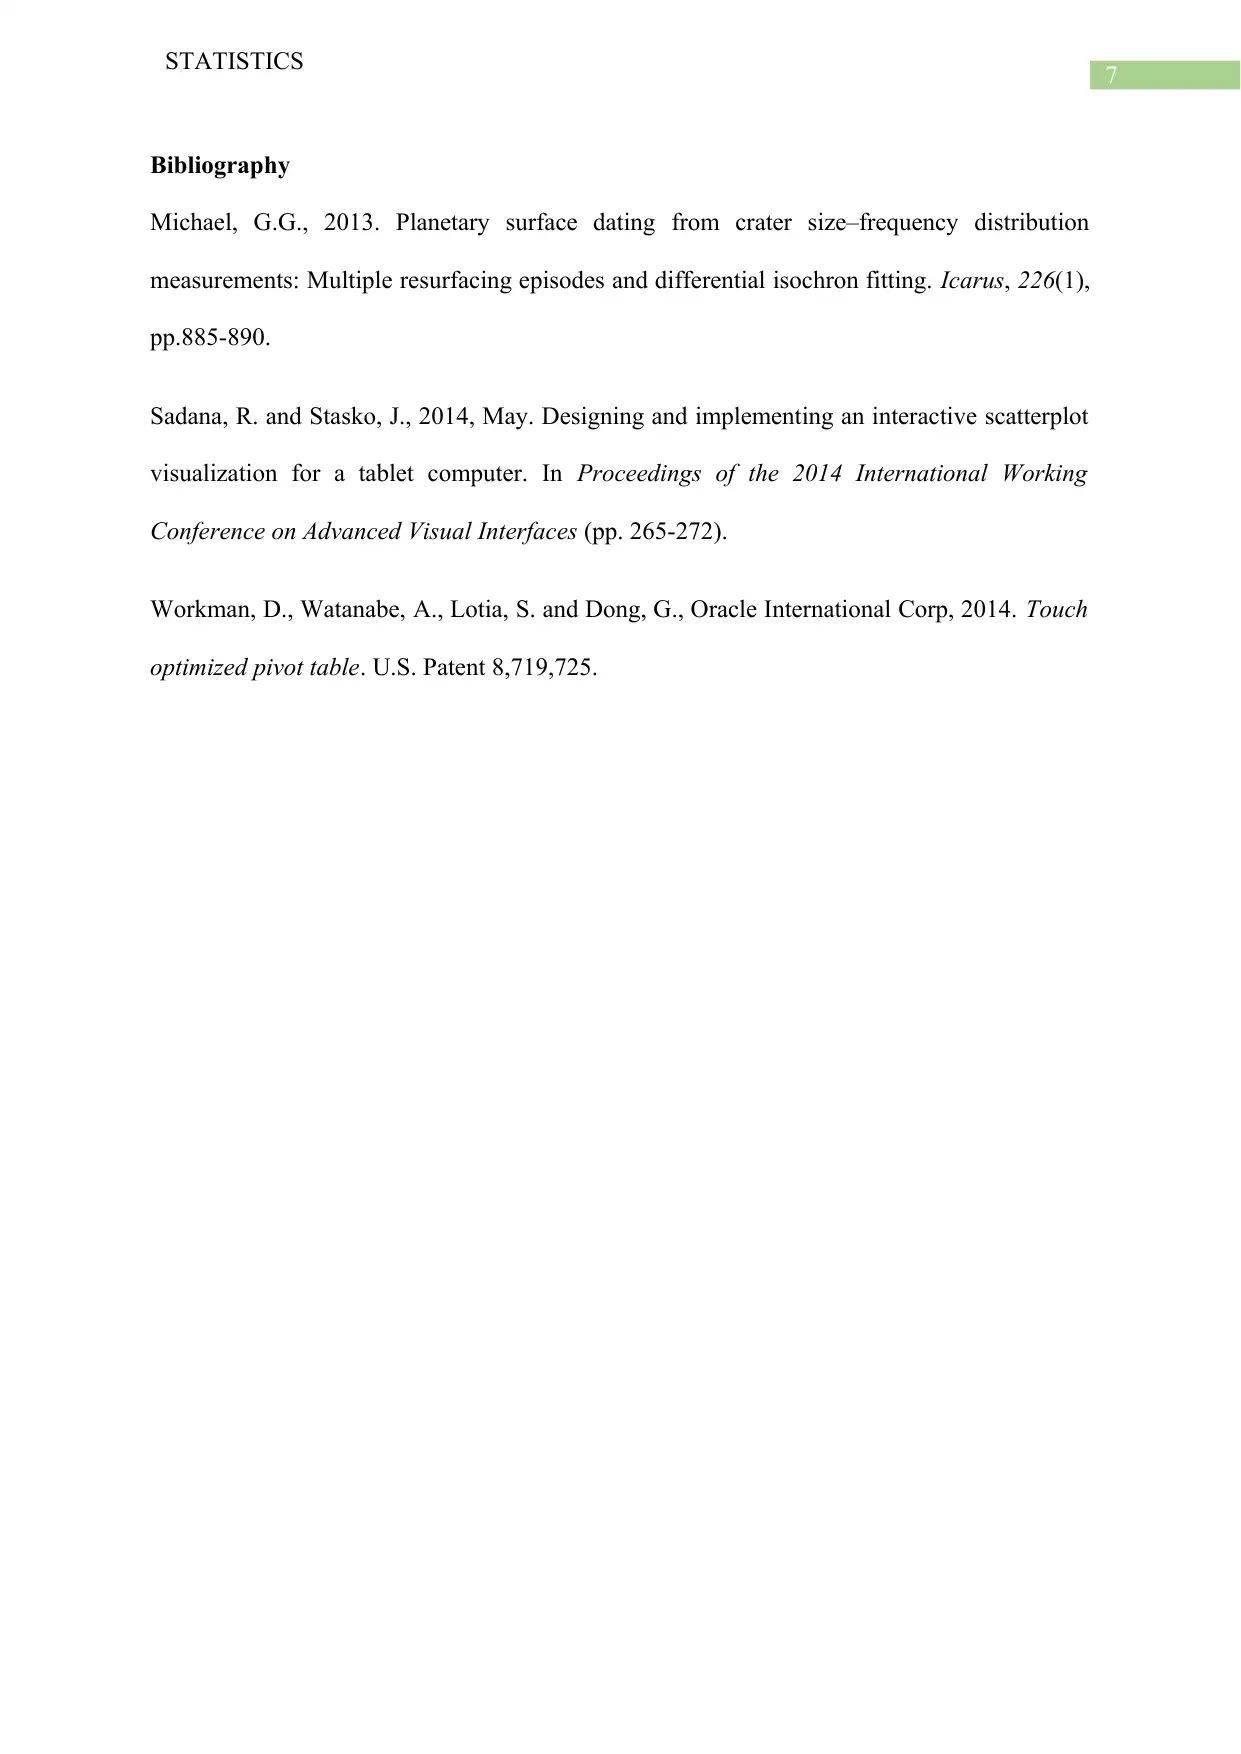
This report, prepared for a BUS 324 course at California State University San Marcos, analyzes movie data from the 'TopMovies.xls' dataset using data visualization techniques. The analysis includes constructing and interpreting scatter plots to examine the relationship between the year of release and budget, as well as the relationship between budget and world box office receipts. The report also utilizes frequency distribution tables and histograms to understand the distribution of movie release years. Pivot tables are employed to explore the combinations of movie ratings and genres, identifying trends in the top 50 movies. Additionally, pivot tables are used to analyze the inflation-adjusted box office receipts across different genres. The findings are discussed, and the report concludes with a bibliography of cited sources.
Document Page
Running head: STATISTICS
Statistics
Name of the Student:
Name of the university:
Author note:
tabler-icon-diamond-filled.svg

Paraphrase This Document

Need a fresh take? Get an instant paraphrase of this document with our AI Paraphraser
Document Page
1
STATISTICS
Table of Contents
Answer to the question 1............................................................................................................2
Answer to the question 2............................................................................................................3
Answer to the question 3............................................................................................................4
Answer to the question 4............................................................................................................5
Answer to the question 5............................................................................................................6
Bibliography...............................................................................................................................7
Document Page
2
STATISTICS
Answer to the question 1
1930 1940 1950 1960 1970 1980 1990 2000 2010 2020
$0
$50
$100
$150
$200
$250
atter lot on ear released and udgetSc p Y B
earY
udgetB
Figure 1 Scatter plot on year released and budget
The figure 1 shows the relationship between the years released versus budget. In this
scatter plot in the X-axis represent the year and in the Y-axis represent the budget. The scatter
plot has been drawn by excluding the data where the movies with missing budget values. It
has been seen that at the time of 1940 the budget of the movies is less than $ 50. After 1990
the budget of the movies are going to increase. Moreover at near 2010 the budget is
maximum and at 2012 the budget of the movies slightly falls down.
Document Page
3
STATISTICS
Answer to the question 2
$0 $50 $100 $150 $200 $250
$0
$500
$1,000
$1,500
$2,000
$2,500
$3,000
atter lot on udget ersus orld bo offi eSc p B v w x c
re ei tsc p
udgetB
orld bo offi e re ei tsW x c c p
Figure 2 Scatter plot on budget versus world box office receipts
The figure 2 shows the relationship between the budgets versus world box office
receipts. In this scatter plot in the X-axis represent the budget and in the Y-axis represent the
world box office receipts. The scatter plot has been drawn by excluding the data where the
movies with missing budget values. It is clear from this scatter plot that the most of the data
fall within the budget $ 50. Moreover in this situation the world box office receipts is less
than $ 1000. The budget of the movies is maximum when the world box office receipts
higher than $ 2500.
tabler-icon-diamond-filled.svg

Paraphrase This Document

Need a fresh take? Get an instant paraphrase of this document with our AI Paraphraser
Document Page
4
STATISTICS
Answer to the question 3
Table 1 Frequency Distribution table
Figure 2
Histogram on Year released of Movies
The figure 2 shows the histogram on year released of movies. It is clear from the
histogram that the shape of the histogram is symmetric, that is data on movies released during
the period of 1930 to 220 is symmetrically or normally distributed. During the period of 1960
to 1980 most and top of the movies has been released.
to1930
1940 to1940
1950 to1950
1960 to1960
1970 to1970
1980 to1980
1990 to1990
2000 to2000
2010 to2010
2020
0
2
4
6
8
10
12
istogra on ear eleased Mo iesH m Y R v
earY
Fre uenq cy
Document Page
5
STATISTICS
Answer to the question 4
Table 2 Pivot Table
The Pivot table is properly shown in the excel sheet.
The drama among all the rating has the highest combinations occupied in top 50
movies and horror and western has the lowest combinations occupied in top 50 movies. The
highest frequency is 15 and the lowest frequency is 1.
After filter the data sheet it has been seen that the number of movies released in 1990
or later is 14.
The pivot table in the excel sheet shows after 1990 rating and genre. It has been seen
that except 1994 all the year during 1990 to 2020 has a single frequency in the combination
Document Page
6
STATISTICS
of rating and genre. In the year 1994 there are two movies has been released. One is animated
and other is G.
Answer to the question 5
Table 3 Pivot Table
The PG among all the genre the highest inflation adjusted has been seen. The rating is
12279.2. The reason for generating the highest inflation in the PG is that in this category most
of the movies has been released and this is occurred during all the period over time.
Moreover the PG is the only section where all the genre has been occurred.
tabler-icon-diamond-filled.svg

Paraphrase This Document

Need a fresh take? Get an instant paraphrase of this document with our AI Paraphraser
Document Page
7
STATISTICS
Bibliography
Michael, G.G., 2013. Planetary surface dating from crater size–frequency distribution
measurements: Multiple resurfacing episodes and differential isochron fitting. Icarus, 226(1),
pp.885-890.
Sadana, R. and Stasko, J., 2014, May. Designing and implementing an interactive scatterplot
visualization for a tablet computer. In Proceedings of the 2014 International Working
Conference on Advanced Visual Interfaces (pp. 265-272).
Workman, D., Watanabe, A., Lotia, S. and Dong, G., Oracle International Corp, 2014. Touch
optimized pivot table. U.S. Patent 8,719,725.
chevron_up_icon
1 out of 8
circle_padding
hide_on_mobile
zoom_out_icon
[object Object]