University Data Science Project: Analysis of Sony Music Dataset
VerifiedAdded on 2023/03/31
|20
|3173
|261
Project
AI Summary
This project presents an analysis of a Sony music dataset, focusing on data visualization and dashboard design using WordPress components. The project begins with an overview of the WordPress website, including sections for Home, About Us, and Contact. The core of the project is divided into process and solution components. The process component details the audience, data elements, chart selection, and ethical considerations for data visualization. The dataset includes elements like album number, adverts, sales, airplay, singer attractiveness, price, genre, and piracy data. The solution component involves designing live dashboards and storytelling through data visualization, using charts like bar charts to compare album sales, analyze age groups, and iTunes downloads. The project aims to communicate insights and discover new aspects from the data, providing a detailed understanding of the data analysis process and the insights gained from the Sony music dataset.

Running head: ANALYSIS OF SONY DATASET
Analysis of Sony Dataset
Name of the Student
Name of the University
Author note
Analysis of Sony Dataset
Name of the Student
Name of the University
Author note
Paraphrase This Document
Need a fresh take? Get an instant paraphrase of this document with our AI Paraphraser

1ANALYSIS OF SONY DATASET
Table of Contents
1. WordPress Website Components................................................................................................2
Home............................................................................................................................................2
About Us......................................................................................................................................2
Contact.........................................................................................................................................2
A) Process Component....................................................................................................................3
Page name: AUDIENCE.............................................................................................................3
Page name: DATA ELEMENTS.................................................................................................3
Page name: THE RIGHT FIT......................................................................................................7
Page name: ETHICS....................................................................................................................8
B) Solution Component...................................................................................................................9
1) Live Dashboard.......................................................................................................................9
2) Story Telling..........................................................................................................................11
Bibliography..................................................................................................................................18

2ANALYSIS OF SONY DATASET
1. WordPress Website Components
Home
Welcome to Beautiful Data Inc.
Beautiful Data Inc. is a data analytics company that mainly performs work based on
designing various kind of interactive dashboards. These dashboards are mainly designed for a
wide number of clients who want to embrace such techniques to gain an understanding of their
present business scenarios. We would thus help companies to grow along with us and prosper in
the future.
About Us
I am (Name of the Student) and I am currently pursuing a course on (Name of Course). I
have gained specialising in designing dashboards for our potential clients.
Contact
Please fill
⊘ This is a preview!⊘
Do you want full access?
Subscribe today to unlock all pages.
Trusted by 1+ million students worldwide
3ANALYSIS OF SONY DATASET
A) Process Component
Page name: AUDIENCE
The primary purpose of data visualisation is to communicate different forms of
significant insights and thus discover new aspects from any provided data. The use of
visualisation is mainly helpful for deducing meaningful patterns, trends and outliers based on
viewing charts and data plots. This form of data analysis method are mainly used by engineers,
data scientists and analysts. The intended audience for the Data Visualisation is the owners and
various stakeholders at Beautiful Data Inc.
Sony Music has been a major leader in the music industry for the last 6 years. The Sony
Music Entertainment (SME) is a music corporation of America that is mainly operated and
managed by Sony Corporation of America (SCA). The music corporation has been capable of
managing their business processes based on surviving within the fluctuating conditions of the
music industry.
During the development of visualizations over the various forms of data, different
questions in relation to development of charts, design of interactive components and actions
based on data manipulation have been discussed. During the development of data visualisation, I
had a great feeling based on defining some categories for visualising the data. I had also gathered
knowledge in relation to determine the areas over which data would need to be categorised.
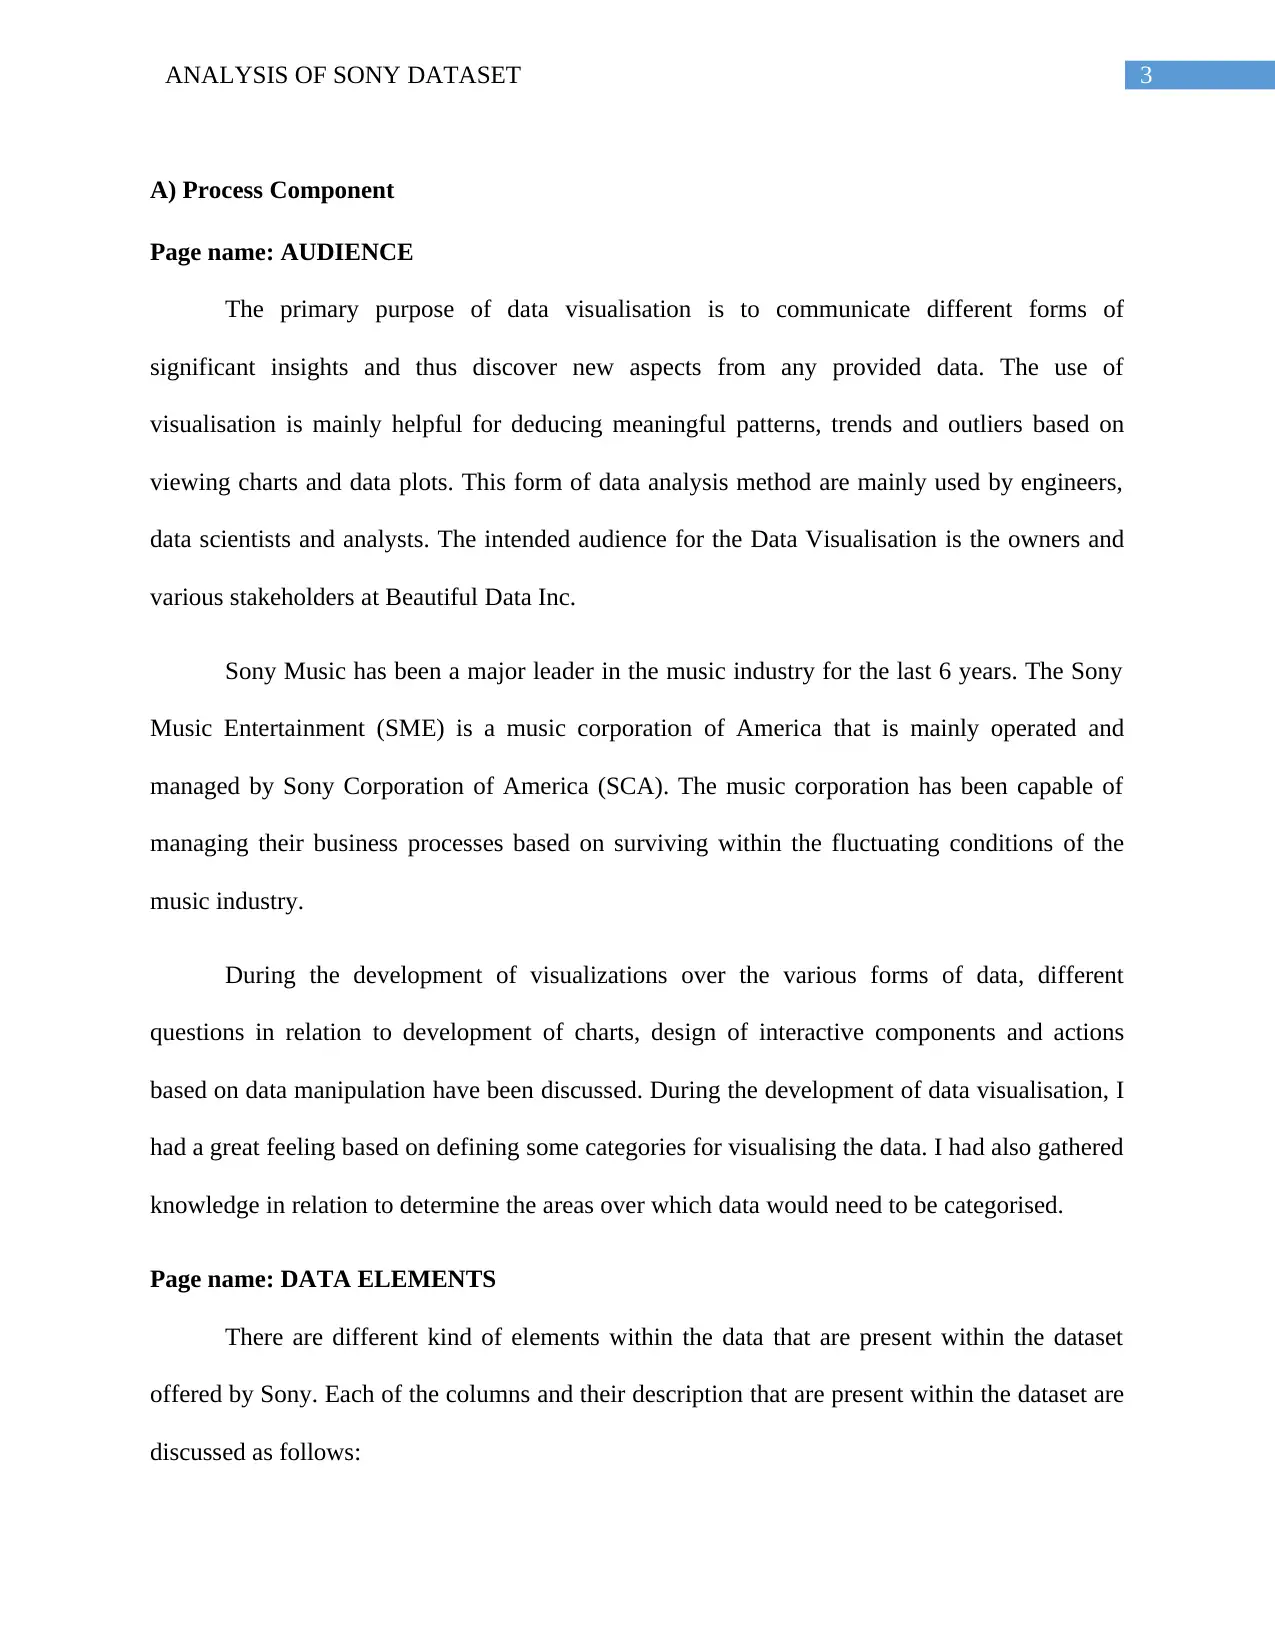
Page name: DATA ELEMENTS
There are different kind of elements within the data that are present within the dataset
offered by Sony. Each of the columns and their description that are present within the dataset are
discussed as follows:
A) Process Component
Page name: AUDIENCE
The primary purpose of data visualisation is to communicate different forms of
significant insights and thus discover new aspects from any provided data. The use of
visualisation is mainly helpful for deducing meaningful patterns, trends and outliers based on
viewing charts and data plots. This form of data analysis method are mainly used by engineers,
data scientists and analysts. The intended audience for the Data Visualisation is the owners and
various stakeholders at Beautiful Data Inc.
Sony Music has been a major leader in the music industry for the last 6 years. The Sony
Music Entertainment (SME) is a music corporation of America that is mainly operated and
managed by Sony Corporation of America (SCA). The music corporation has been capable of
managing their business processes based on surviving within the fluctuating conditions of the
music industry.
During the development of visualizations over the various forms of data, different
questions in relation to development of charts, design of interactive components and actions
based on data manipulation have been discussed. During the development of data visualisation, I
had a great feeling based on defining some categories for visualising the data. I had also gathered
knowledge in relation to determine the areas over which data would need to be categorised.
Page name: DATA ELEMENTS
There are different kind of elements within the data that are present within the dataset
offered by Sony. Each of the columns and their description that are present within the dataset are
discussed as follows:
Paraphrase This Document
Need a fresh take? Get an instant paraphrase of this document with our AI Paraphraser
4ANALYSIS OF SONY DATASET
1. Album No – The album number is defined as a unique ID that is assigned to each of
the albums that are released by Sony in the recent years. With the help of unique ID provided to
each of the albums, they would be able to recognise each of the albums in a unique manner. The
act of data visualisation with the help of the collected data would be highly benefited by
determining each of the unique IDs and matching the results with the other cells.
2. Adverts – There might be different kind of expenses that might be incurred by Sony
before the launch of any particular album. These include the designing of advertisements that
have been made during the preparation of the album. These expenses would be incurred by the
organisation before the final release of the album. The price of each of these entries is measured
in Australian dollars.
3. Sales – The Company might incur huge amount of profits after the final release of their
various albums. This column thus lists the prices at which each of the unique albums have gained
their final profit after they had been sold in the international market.
4. Airplay – At certain times, the company might wish to advertise their album by
playing some of the songs from the album over the online Radio platform. This kind of strategy
is being mainly used for reaching out to a wide number of public and thus gain their attention. in
this dataset, the Airplay determines the total number of times the album had been played on Fox
Radio prior to the week of release.
5. Attract – This section in the dataset describes the attractiveness of the singer or band.
This criteria defines the attractiveness and popularity of the singer or band by the customers. a
certain range is defined for the dataset where 1 defines ‘Not attractive at all’ and 10 defines
‘Very attractive’.

5ANALYSIS OF SONY DATASET
6. Price – The price dataset defines the total price of the album. It is measured in
Australian dollars. This price covers the total value that have been incurred during the
preparation of the album.
7. Gender – This particular section within the dataset helps in categorising the gender of
the singer of the album.
8. Streaming Services – These albums are made available over different online musical
platforms. The particular section within the dataset describes the different albums and details out
whether the particular album is available on Spotify, Pandora or it has not been uploaded over
any online platform.
9. Piracy – There might be several cases of piracy after a particular album has been
released. This section identifies the total number of illegal downloads of albums that have been
made during the first two weeks after the initial release of the album.
10. Top20 – This section describes whether any tracks that are present within the album
would have appeared in the Top 20 list of Billboard during the first week of release of the album.
11. Age – This section determines the age of the singer.
12. No. of Previous Albums – This number describes the total number of previous
albums that have been made by the singer or band.
13. iTunes Download – The section that have been defined in the dataset describes the
total number of downloads of the album that have been made during the first two weeks of the
release.
⊘ This is a preview!⊘
Do you want full access?
Subscribe today to unlock all pages.
Trusted by 1+ million students worldwide

6ANALYSIS OF SONY DATASET
14. Genre – The genre of the music is determined within this section of the dataset. The
genres of music are Classical, Hip-Hop, House, Pop and R&B.
15. Year Released – The initial year of release of each albums have been described
within the dataset.
16. Language – The particular language of the album has been defined within the
dataset. The different languages of the albums are Danish, English, French, German, Italian,
Portuguese and Spanish.
17. Country – This section helps in determining the particular country of origin for any
particular singer or band.
On a further note the different data could be classified in the following ways:
Data Classification of the Data
Album No Numerical
Adverts Numerical
Sales Numerical
Airplay Numerical
Attract Numerical
Price Numerical
Gender Categorical
Streaming Services Categorical
Piracy Numerical
Top20 Categorical
Age Numerical
No. of Previous Albums Numerical
iTunes Download Numerical
Genre Categorical
Year Released Year
Language Categorical
Country Location
Paraphrase This Document
Need a fresh take? Get an instant paraphrase of this document with our AI Paraphraser

7ANALYSIS OF SONY DATASET
Page name: THE RIGHT FIT
Charts and visualisation form an important factor based on understanding the correlations
between the dataset and the gained information. With the help of implementing such kind of
charts, it would be highly helpful for data scientists and engineers to form a brief analysis over
any product or service. This kind of information helps in determining the best kind of measures
in the future. The different kind of charts and visualisation are: column chart, dual axis chart, line
graph, bar graph, pie chart, waterfall chart, bullet chart, bubble chart, scatter plot chart and area
chart.
During the design of the present dashboard, the bar chart have been made. With the help
of the bar chart, it would be easy to perform comparison between the various elements. Symbol
maps are also used for depicting the different signs within a topographic map. This kind of map
would help in representing each of the necessary details.

8ANALYSIS OF SONY DATASET
Page name: ETHICS
Based on the consideration over data that have been defined in datasets, there should be
several kind of ethical considerations in relation with the data that is being used for research
purposes. The visualisation that is being presented is based on performing a brief analysis over
different modes of the data. During the presenting of performing visualisations over the gathered
data, there should be certain ethical considerations that need to be considered. These are:
1. Privacy Invasion – Privacy is defined as one of the most important concern in relation
to privacy. The defined dataset that is presented by the company could be infringed. Proper laws
should be followed during performing of a brief form of data analysis over the gathered dataset.
The visualisation performed over the dataset have been performed for determining a targeted
advertisement.
2. Breaches in Confidentiality – During the conducting of market research for Sony
Corporation, the aspect of confidentiality would need to be highly considered. Breach within
confidentiality of data would need to be highly considered. Hence, different considerations
should be there in order to maintain a proper way of securing the data covered within the dataset.
3. Undertaking of Objective Market Research – There is a wide kind of significant impact on
the perceptions of the public. There are different market researchers who mainly put focus over
the fact that there should be an ethical obligation for conducting research in an objective manner.
The research conducted over the gathered data should be thus conducted in an objective manner
based on presenting a reality based picture towards the company for which the data is being
visualised.
⊘ This is a preview!⊘
Do you want full access?
Subscribe today to unlock all pages.
Trusted by 1+ million students worldwide

9ANALYSIS OF SONY DATASET
B) Solution Component
1) Live Dashboard
(Figure 1: Dashboard 1)
(Source: Created by author)
B) Solution Component
1) Live Dashboard
(Figure 1: Dashboard 1)
(Source: Created by author)
Paraphrase This Document
Need a fresh take? Get an instant paraphrase of this document with our AI Paraphraser

10ANALYSIS OF SONY DATASET
(Figure 2: Dashboard 2)
(Source: Created by author)
(Figure 2: Dashboard 2)
(Source: Created by author)

11ANALYSIS OF SONY DATASET
2) Story Telling
(Figure 3: Particular Sales of Particular Album)
(Source: Created by author)
In this diagram, horizontal bar chart have been used. This kind of chart has been used for
depicting the sum of total sales of any particular album. The deep green colour depicts the total
highest number of sales of album that have been made by a particular album number. However,
the deep red colour depicts the lowest number of sales made by any particular album. The
hierarchy used in this approach is from lowest to highest number of sales made by an album. The
colour of each blocks that have been used can be defined as an interactive component.
⊘ This is a preview!⊘
Do you want full access?
Subscribe today to unlock all pages.
Trusted by 1+ million students worldwide
1 out of 20


Your All-in-One AI-Powered Toolkit for Academic Success.
+13062052269
info@desklib.com
Available 24*7 on WhatsApp / Email
![[object Object]](/_next/static/media/star-bottom.7253800d.svg)
Unlock your academic potential
Copyright © 2020–2026 A2Z Services. All Rights Reserved. Developed and managed by ZUCOL.