Foundations of Information Systems: Data Warehouse Analysis Report

Verified

Added on  2022/10/09

|8
|1372
|22
Report
AI Summary
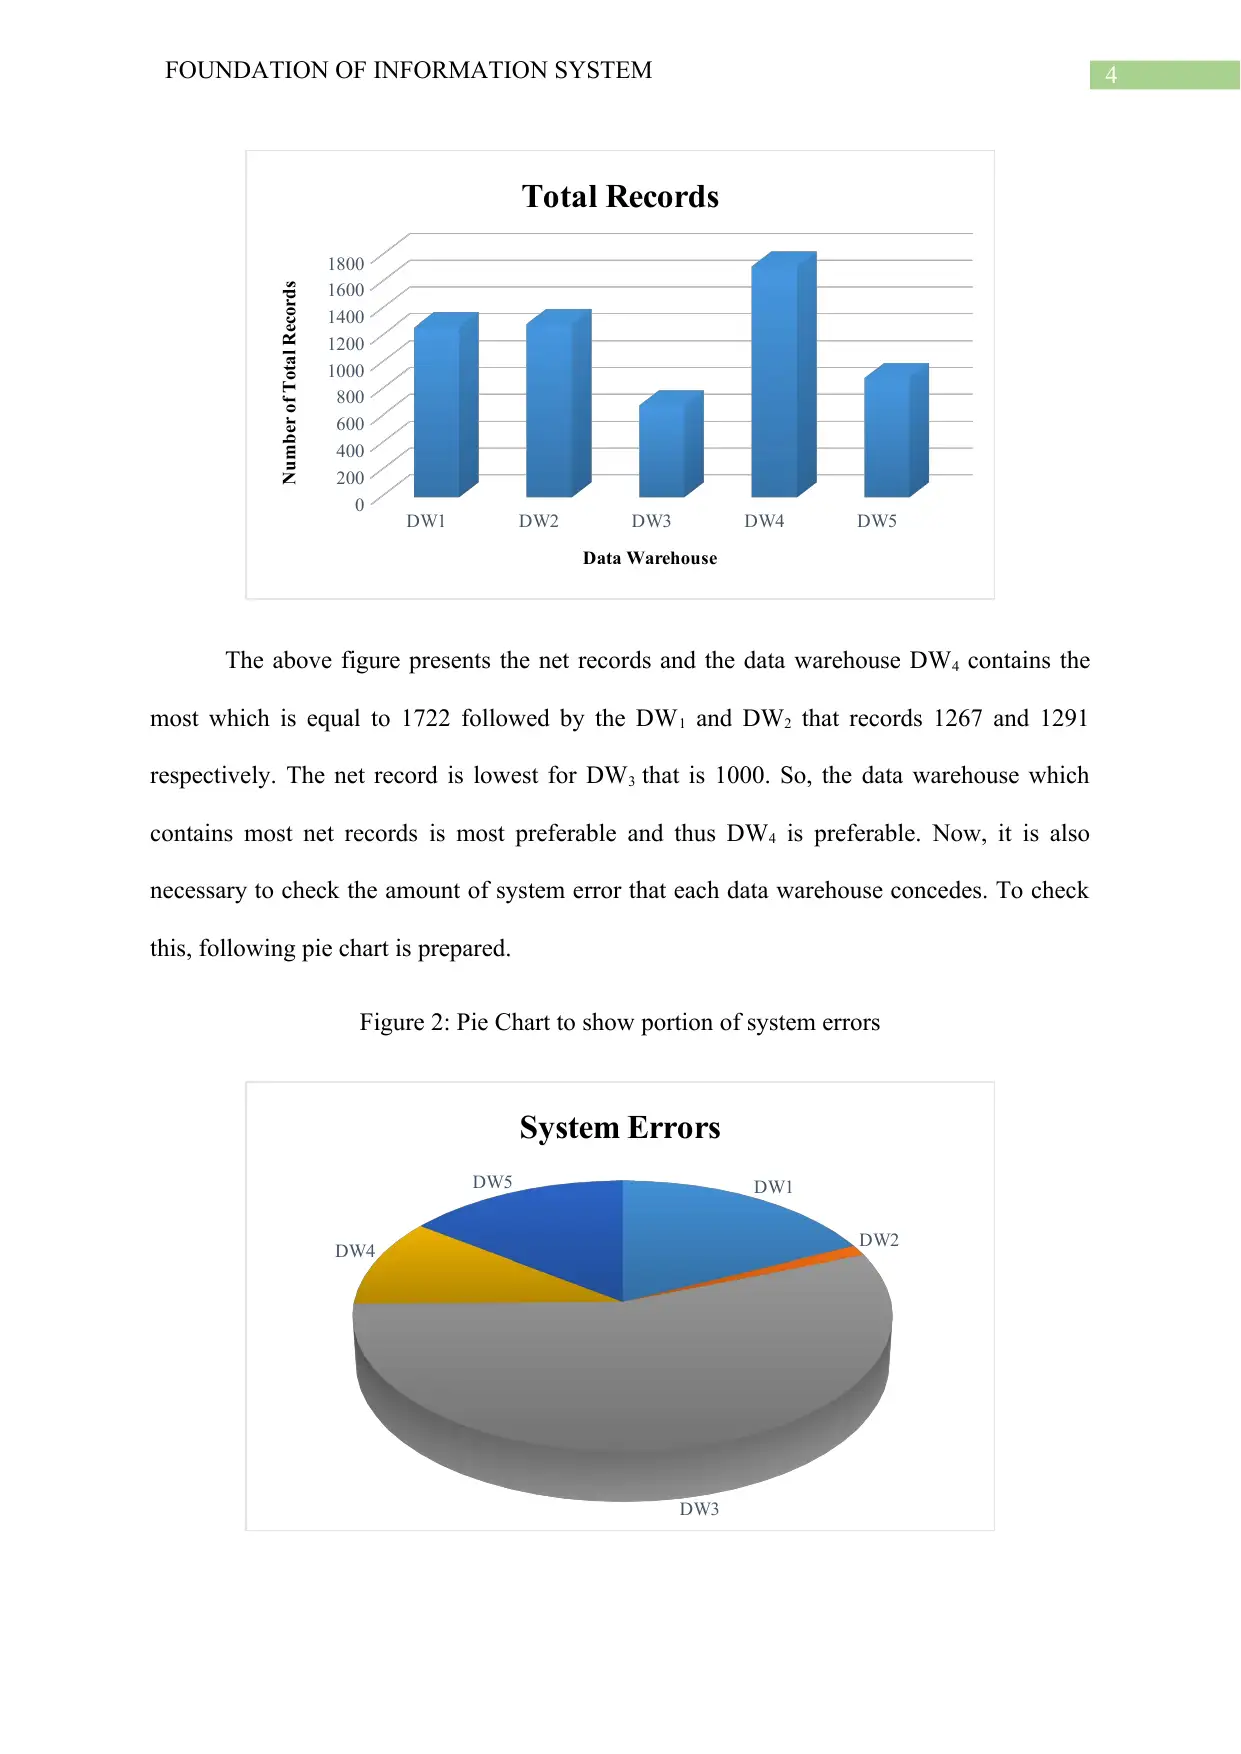
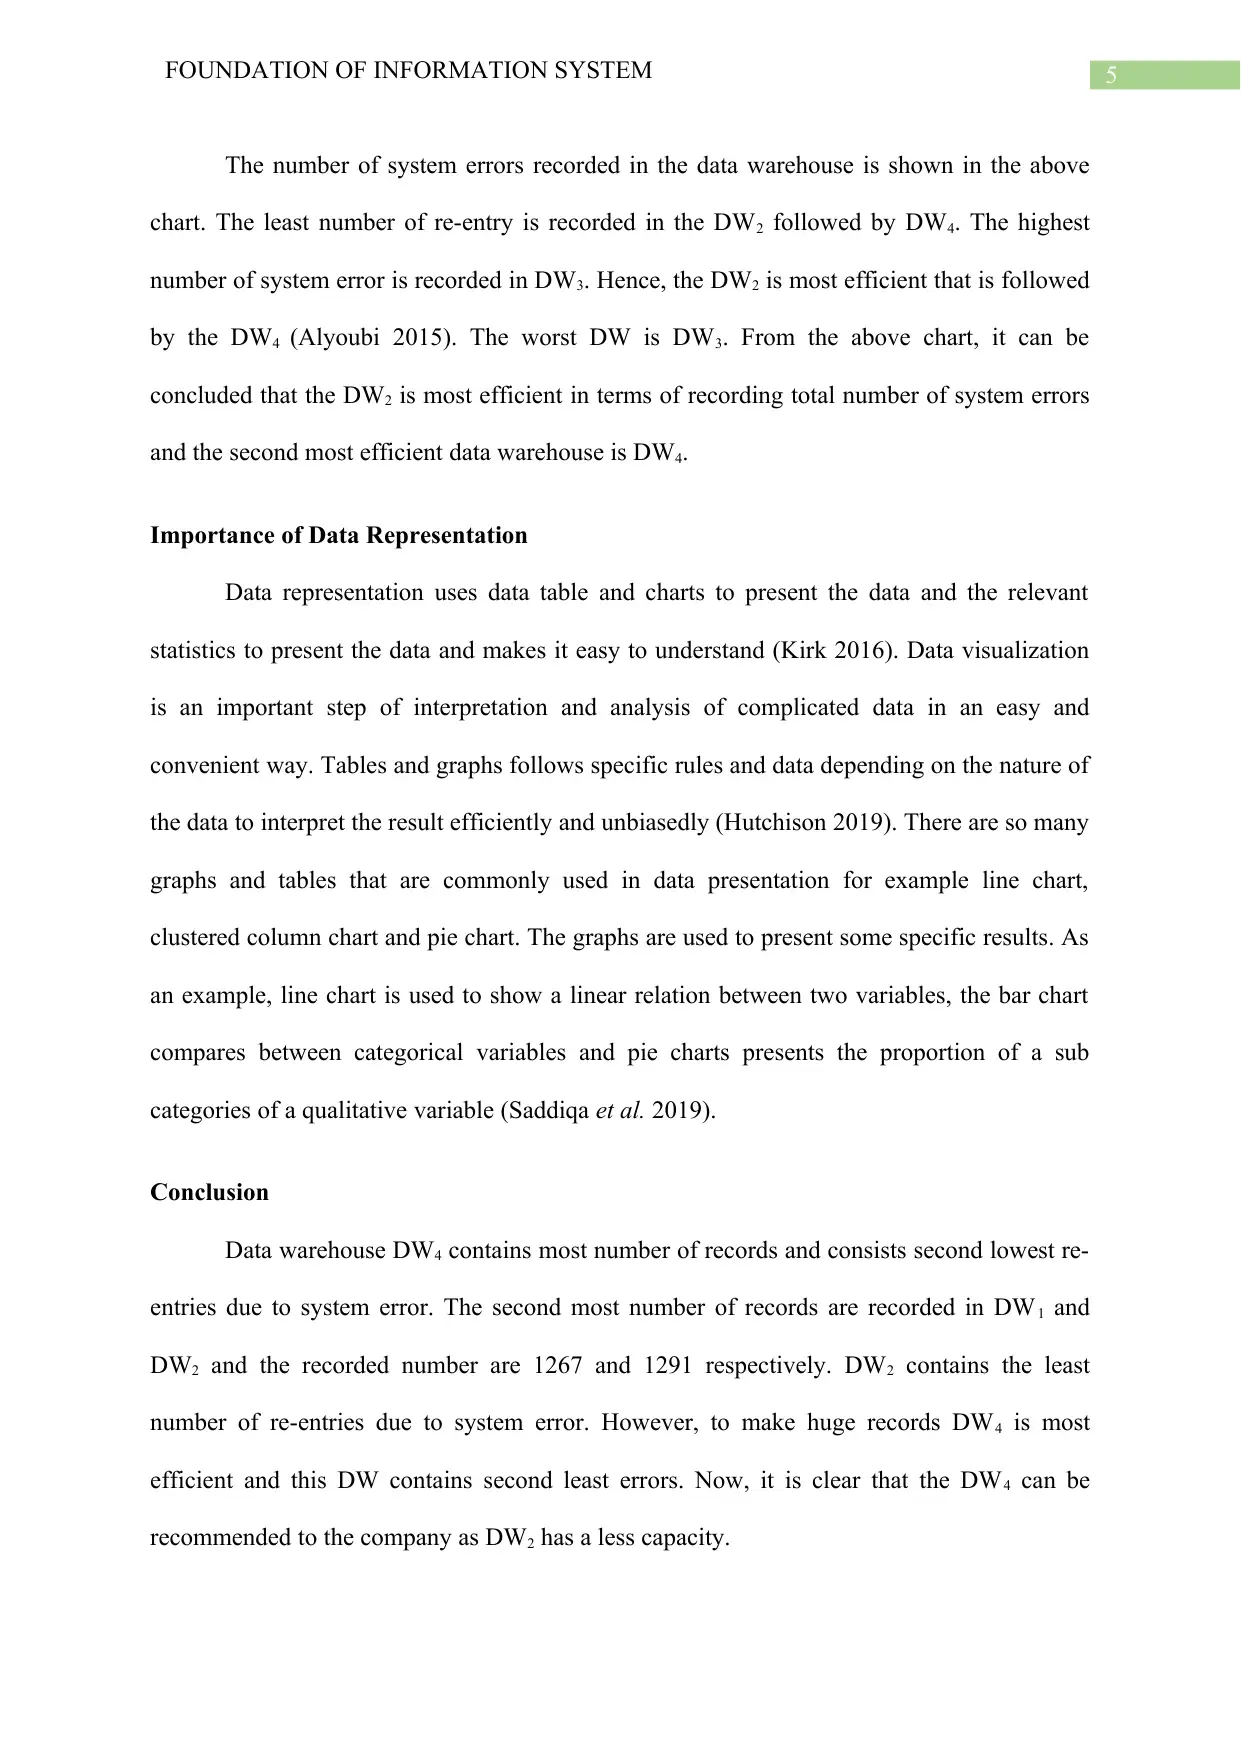
This report analyzes a case study involving FUSSION Company's need to implement a data warehouse system to gain a competitive edge in the retail market. The analysis focuses on evaluating five different data warehouse systems (DW1-DW5) based on factors such as total records, system errors, and data representation using statistical charts. The report utilizes clustered column charts and pie charts to visualize and compare the data warehouse performance, ultimately recommending the most efficient data warehouse (DW4) for the company. Furthermore, the report emphasizes the importance of data representation through tables and charts for simplifying complex data and facilitating informed decision-making. The report concludes by summarizing the findings and recommending the most suitable data warehouse system based on the analysis.
Document Page
Running head: FOUNDATION OF INFORMATION SYSTEM
Foundation of Information System
Name of the Student:
Name of the University:
Author Note:
tabler-icon-diamond-filled.svg

Secure Best Marks with AI Grader

Need help grading? Try our AI Grader for instant feedback on your assignments.
Document Page
FOUNDATION OF INFORMATION SYSTEM 1
Table of Contents
Introduction................................................................................................................................2
Data Warehouse Selection.........................................................................................................2
Importance of Data Representation............................................................................................5
Conclusion..................................................................................................................................5
Reference....................................................................................................................................7
Document Page
2FOUNDATION OF INFORMATION SYSTEM
Introduction
There is an important role of information system in the success of supply
chain management and operations. The modern information system has helped to create the
competitive advantage and will be more advance in order to find the advanced specification
areas where the business have the potential to grow. The competitive advantage can be
created with a higher level of significance by the supply chain management. In the
technological world, the advanced information system and the information technology have
the importance in sharing the information that are connected to the process and the final
product or services generates the additional value (Geisler et al. 2016).. The use of these
technologies are growing due to the growth of global competition in supply chain
management. The firms are getting immense exposure to accelerate the coordination within
the firm that is intensifying the integration within the external elements like consumers,
clients and suppliers. This also works to improve the strategies that are used in taking
decisions. The immense use of information systems has helped in the integration in a lot of
areas. As an example, the infrastructure of the information system includes unified coding
standards, standard data structure, the data communication tools and network connection and
also centralized data base management systems, internet based information system that are
based on internet and electronic data interchange.
Data Warehouse Selection
A data warehousing is a technique which is used to collect and manage the data from
various resources to make out a meaningful business insights. This is a combination of
different technology and component which supports use of data strategically (Atieh et al.
2016). This is an electronic storage of a huge volume of information by a firm or business to
make query and analyses in replacement of transaction process. This is a process to transform
Document Page
3FOUNDATION OF INFORMATION SYSTEM
the data into information and makes it available for the users in a timely manner in order to
make a difference.
The report discusses about a case study. The case study is on FUSSION Company
which is experiencing the tough competition in the retail market. Now, the company wants to
become competitive by using the data which is collected over the years using the modern
information system. Now the company is interested in acquiring and implementing the data
warehouse system to organize and analyze the historic transactions data for supporting the
business decision making. There are 5 data warehouse system named, DW1, DW2, DW3, DW4
and DW5. Now, the recommendation for the best Data Warehouse system is need for the
company. The data is available on records, system errors, total records, dimensional records,
tables per database (8 databases) and daily revenue. The statistical charts can present the set
of data and it is very convenient to represent the DW (Li et al. 2015). So, in order to analyse
and find out the best DW that must to be recommended to the company, two charts are
prepared one of them is clustered column chart and the other one is pie chart, presented in
figure 1 and figure 2 respectively. Figure 1 presents the total records and the figure 2 presents
the system errors.
Figure 1: Clustered Column Chart to show total records in each DW
tabler-icon-diamond-filled.svg

Secure Best Marks with AI Grader

Need help grading? Try our AI Grader for instant feedback on your assignments.
Document Page
4FOUNDATION OF INFORMATION SYSTEM
DW1 DW2 DW3 DW4 DW5
0
200
400
600
800
1000
1200
1400
1600
1800
Total Records
Data Warehouse
Number of Total Records
The above figure presents the net records and the data warehouse DW4 contains the
most which is equal to 1722 followed by the DW1 and DW2 that records 1267 and 1291
respectively. The net record is lowest for DW3 that is 1000. So, the data warehouse which
contains most net records is most preferable and thus DW4 is preferable. Now, it is also
necessary to check the amount of system error that each data warehouse concedes. To check
this, following pie chart is prepared.
Figure 2: Pie Chart to show portion of system errors
DW1
DW2
DW3
DW4
DW5
System Errors
Document Page
5FOUNDATION OF INFORMATION SYSTEM
The number of system errors recorded in the data warehouse is shown in the above
chart. The least number of re-entry is recorded in the DW2 followed by DW4. The highest
number of system error is recorded in DW3. Hence, the DW2 is most efficient that is followed
by the DW4 (Alyoubi 2015). The worst DW is DW3. From the above chart, it can be
concluded that the DW2 is most efficient in terms of recording total number of system errors
and the second most efficient data warehouse is DW4.
Importance of Data Representation
Data representation uses data table and charts to present the data and the relevant
statistics to present the data and makes it easy to understand (Kirk 2016). Data visualization
is an important step of interpretation and analysis of complicated data in an easy and
convenient way. Tables and graphs follows specific rules and data depending on the nature of
the data to interpret the result efficiently and unbiasedly (Hutchison 2019). There are so many
graphs and tables that are commonly used in data presentation for example line chart,
clustered column chart and pie chart. The graphs are used to present some specific results. As
an example, line chart is used to show a linear relation between two variables, the bar chart
compares between categorical variables and pie charts presents the proportion of a sub
categories of a qualitative variable (Saddiqa et al. 2019).
Conclusion
Data warehouse DW4 contains most number of records and consists second lowest re-
entries due to system error. The second most number of records are recorded in DW1 and
DW2 and the recorded number are 1267 and 1291 respectively. DW2 contains the least
number of re-entries due to system error. However, to make huge records DW4 is most
efficient and this DW contains second least errors. Now, it is clear that the DW4 can be
recommended to the company as DW2 has a less capacity.
Document Page
6FOUNDATION OF INFORMATION SYSTEM
tabler-icon-diamond-filled.svg

Paraphrase This Document

Need a fresh take? Get an instant paraphrase of this document with our AI Paraphraser
Document Page
7FOUNDATION OF INFORMATION SYSTEM
Reference
Alyoubi, B.A., 2015. Decision support system and knowledge-based strategic management.
Procedia Computer Science, 65, pp.278-284.
Atieh, A.M., Kaylani, H., Al-abdallat, Y., Qaderi, A., Ghoul, L., Jaradat, L. and Hdairis, I.,
2016. Performance improvement of inventory management system processes by an
automated warehouse management system. Procedia Cirp, 41, pp.568-572.
Geisler, J., Thomas, S., Pecorari, J., Hertzman, A.J., Gold, D.H., Schmidt, J.J., Connelly,
B.M., Lofty, C., Tanneru, S.K., Myaka, N. and Miller, K.C., 2016. System and method for
workflow management. U.S. Patent Application 14/861,270.
Hutchison, L., 2019. Systems and methods for parallelization of program code, interactive
data visualization, and graphically-augmented code editing. U.S. Patent Application
10/209,963.
Kirk, A., 2016. Data visualisation: a handbook for data driven design. Sage.
Laudon, K.C. and Laudon, J.P., 2016. Management information system. Pearson Education
India.
Li, J., Tao, F., Cheng, Y. and Zhao, L., 2015. Big data in product lifecycle management. The
International Journal of Advanced Manufacturing Technology, 81(1-4), pp.667-684.
Saddiqa, M., Larsen, B., Magnussen, R., Rasmussen, L. and Pedersen, J.M., 2019. Open Data
Visualization in Schools. In IEEE Pacific Visualization Symposium.
chevron_up_icon
1 out of 8
circle_padding
hide_on_mobile
zoom_out_icon
[object Object]