Data Warehouse Design and Implementation for Northwind Database

Verified

Added on  2023/06/14

|5
|670
|258
Report
AI Summary
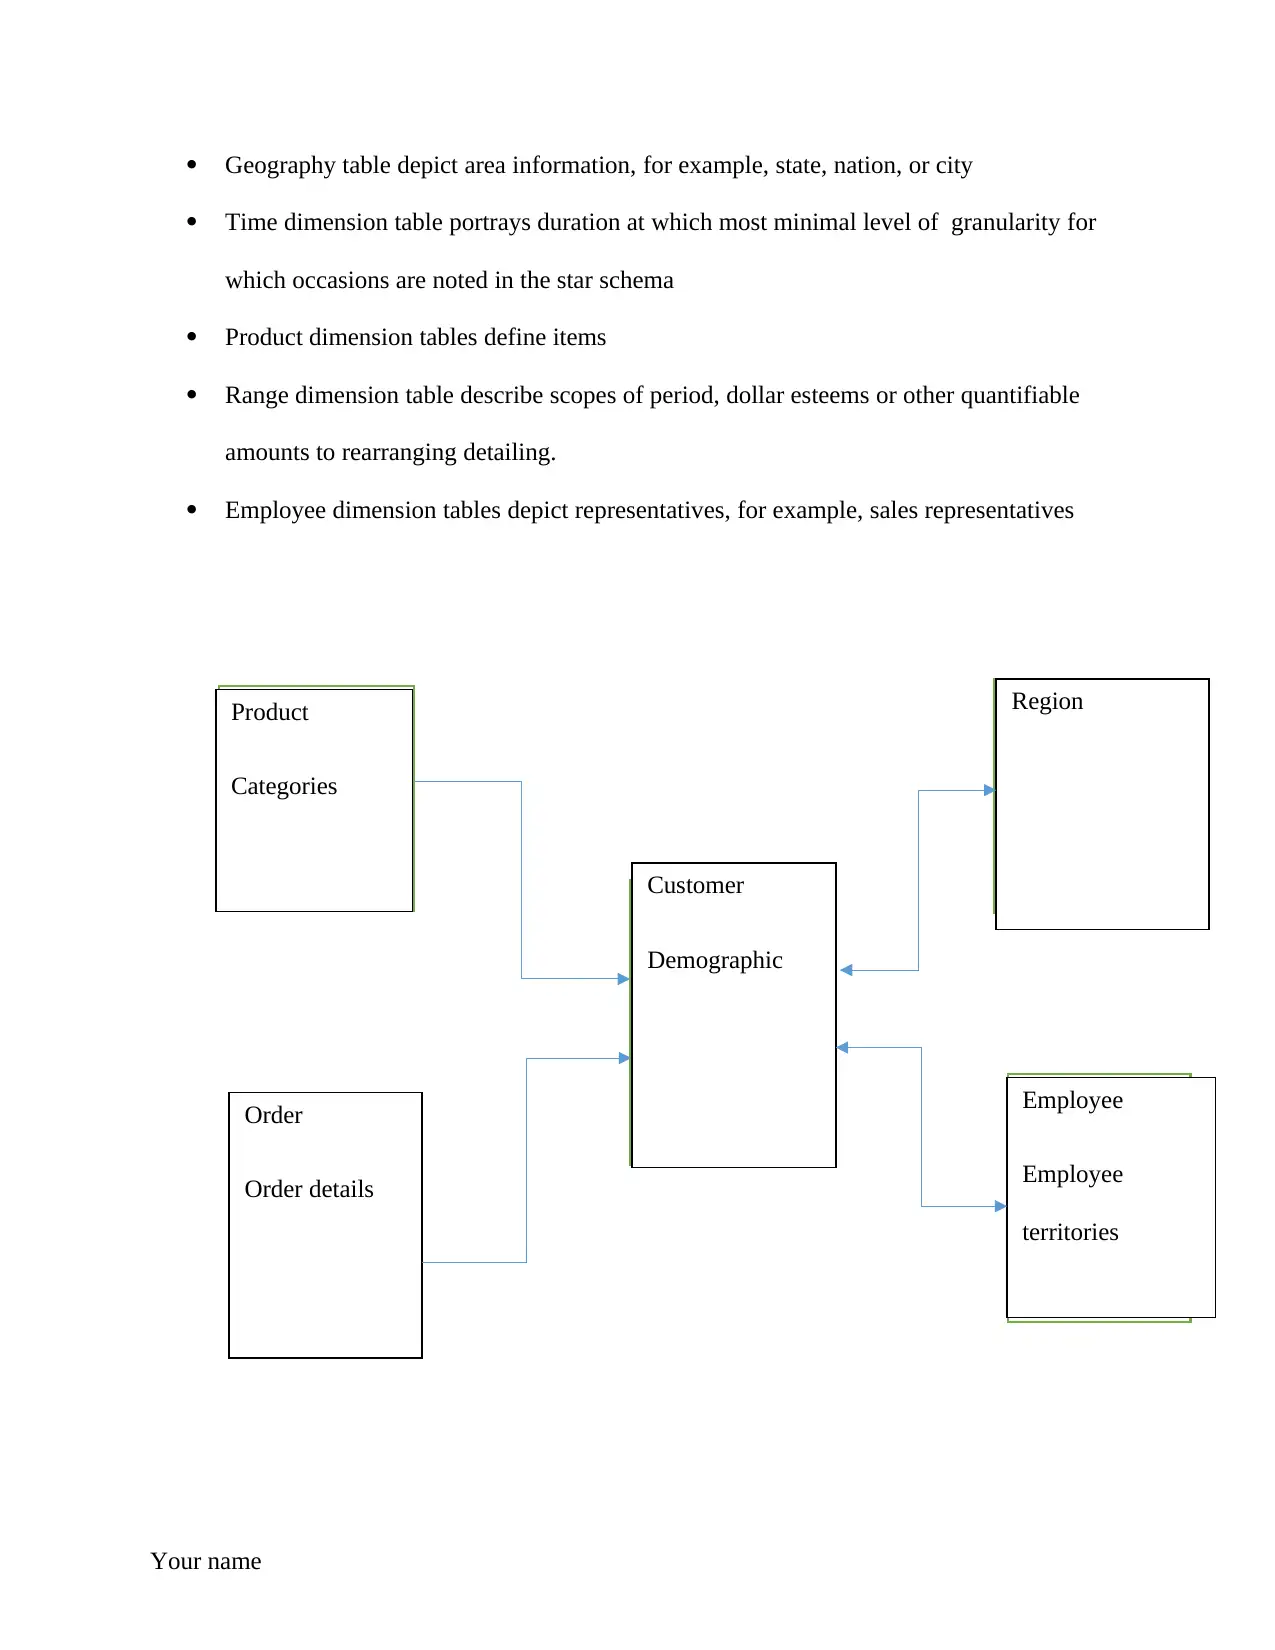
This report presents a data warehouse solution designed for analyzing data from the Microsoft Northwind database. It begins by identifying 'customer' as the primary subject for analysis, categorized into CustomerCustomerDemo and CustomerDemographics. The report proposes a star schema for the data warehouse, separating business process information into facts and dimensions. Facts tables record measurements and metrics, while dimension tables describe qualitative data, including time, geography, product, and employee dimensions. The report also touches on the implementation of tables and ETL procedures using Microsoft SQL Server, as well as reporting and analysis in support of the defined requirements. Desklib offers a wealth of similar solved assignments and past papers for students.
Document Page
University
Data Storage Solutions for Data Analytics
by
Your Name
Date
Lecturer’s Name and Course Number
Your name
tabler-icon-diamond-filled.svg

Secure Best Marks with AI Grader

Need help grading? Try our AI Grader for instant feedback on your assignments.
Document Page
Part 1 – Business Drivers
Select a subject for analysis using data warehousing techniques from the operational data
captured in the Microsoft Northwind database. (The operational ER model is included in
this document)
Answer:
Subject for analysis are the main subject areas. In the case of operational data captured in the
Microsoft Northwind data the subject of analysis will be customer. Customer is the intersection
of every line answers about Northwind data. Customer as a subject of analysis can be easily be
seen and it relationship traced. In addition, customer as a subject of analysis can be agreed upon
and defined in the subject areas identified in the Northwind business model (Cox, 2018). The
customer as the subject of analysis leads to categorizing into subject areas namely;
CustomerCustomerDemo and customerDemographics. This will be achieved by developing
some questions about the Northwind information.
Part 2 – Data Modeling
Develop and present a suitable schema for the data warehouse (data mart). Discuss your
reasons for the design.
Answer:
The suitable schema for the Northwind data will be the star schema. The star will schema
will separate the business process information into facts and which hold the amount, dimensions
and which are descriptive characteristic related to the information, and qualitative data about
business. A star schema in computing, is the easiest type of data mart schema to make and is the
Your name
Document Page
method extensively employed to develop dimensional data marts and data warehouses. A star
schema with many dimensions is referred to a centipede schema. While it is simpler to maintain,
it has dimensions with a few attributes which result to enquiries with various table joins and
makes the star easy simple to use (Wickham, 2016). Measurements or metric are recorded by
facts table. These table normally consist of foreign keys and numeric values to dimensional data
where descriptive data is stored. The design of facts table are low level uniform details known as
grain or granulity meaning facts probably record events at atomic stage. Over time this can lead
to accumulation of large records. In a fact table.
Facts table are defined as follows
Specific events are recorded by transaction fact tables
Facts are recorded at any given time by snapshot facts tables
Aggregating snapshot tables records accumulative facts at a particular point in time.
Compared to facts table dimension tables have a moderately lesser number of records, however
each record might have a huge number of characteristics to define the fact information.
Dimension tables, as a rule, have a moderately modest records compared with fact tables, yet
each record might have a wide range of attributes to define data. Dimensions might characterize
a wide assortment of qualities, however, the absolute most regular traits characterized by
dimension table comprise:
Time dimension table portray period at the most minimal level of period granularity of
occasions to be noted in the star schema
Your name
Document Page
Geography table depict area information, for example, state, nation, or city
Time dimension table portrays duration at which most minimal level of granularity for
which occasions are noted in the star schema
Product dimension tables define items
Range dimension table describe scopes of period, dollar esteems or other quantifiable
amounts to rearranging detailing.
Employee dimension tables depict representatives, for example, sales representatives
Your name
Product
Categories
Order
Order details
Customer
Demographic
Region
Employee
Employee
territories
tabler-icon-diamond-filled.svg

Secure Best Marks with AI Grader

Need help grading? Try our AI Grader for instant feedback on your assignments.
Document Page
Reference
Cox, D.R., 2018. Analysis of survival data. Routledge.
Wickham, H., 2016. ggplot2: elegant graphics for data analysis. Springer.
Your name
chevron_up_icon
1 out of 5
circle_padding
hide_on_mobile
zoom_out_icon
logo.png

Your All-in-One AI-Powered Toolkit for Academic Success.

Available 24*7 on WhatsApp / Email

[object Object]