ICT100 Assessment 2: Data Analysis of FUSION Company Report
VerifiedAdded on  2022/09/27
|7
|1240
|14
Report
AI Summary
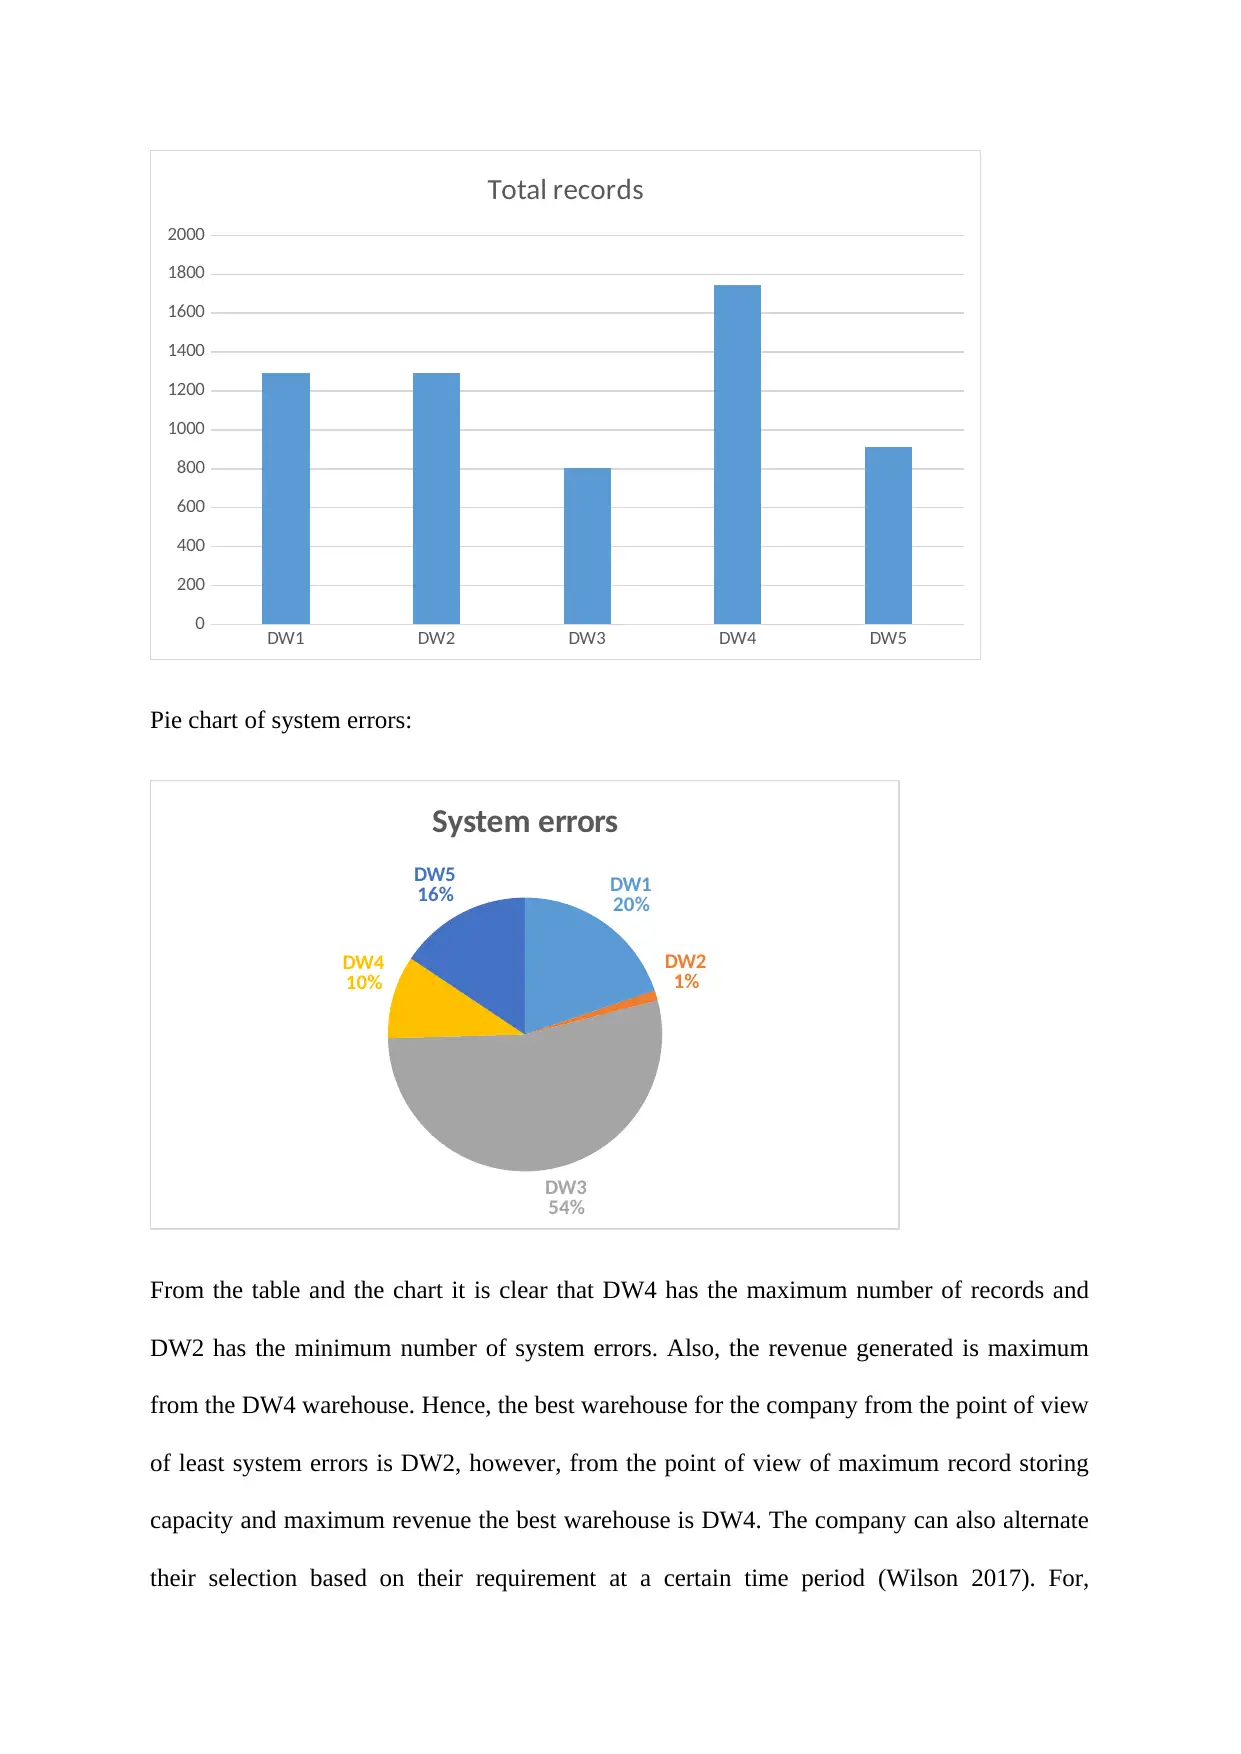
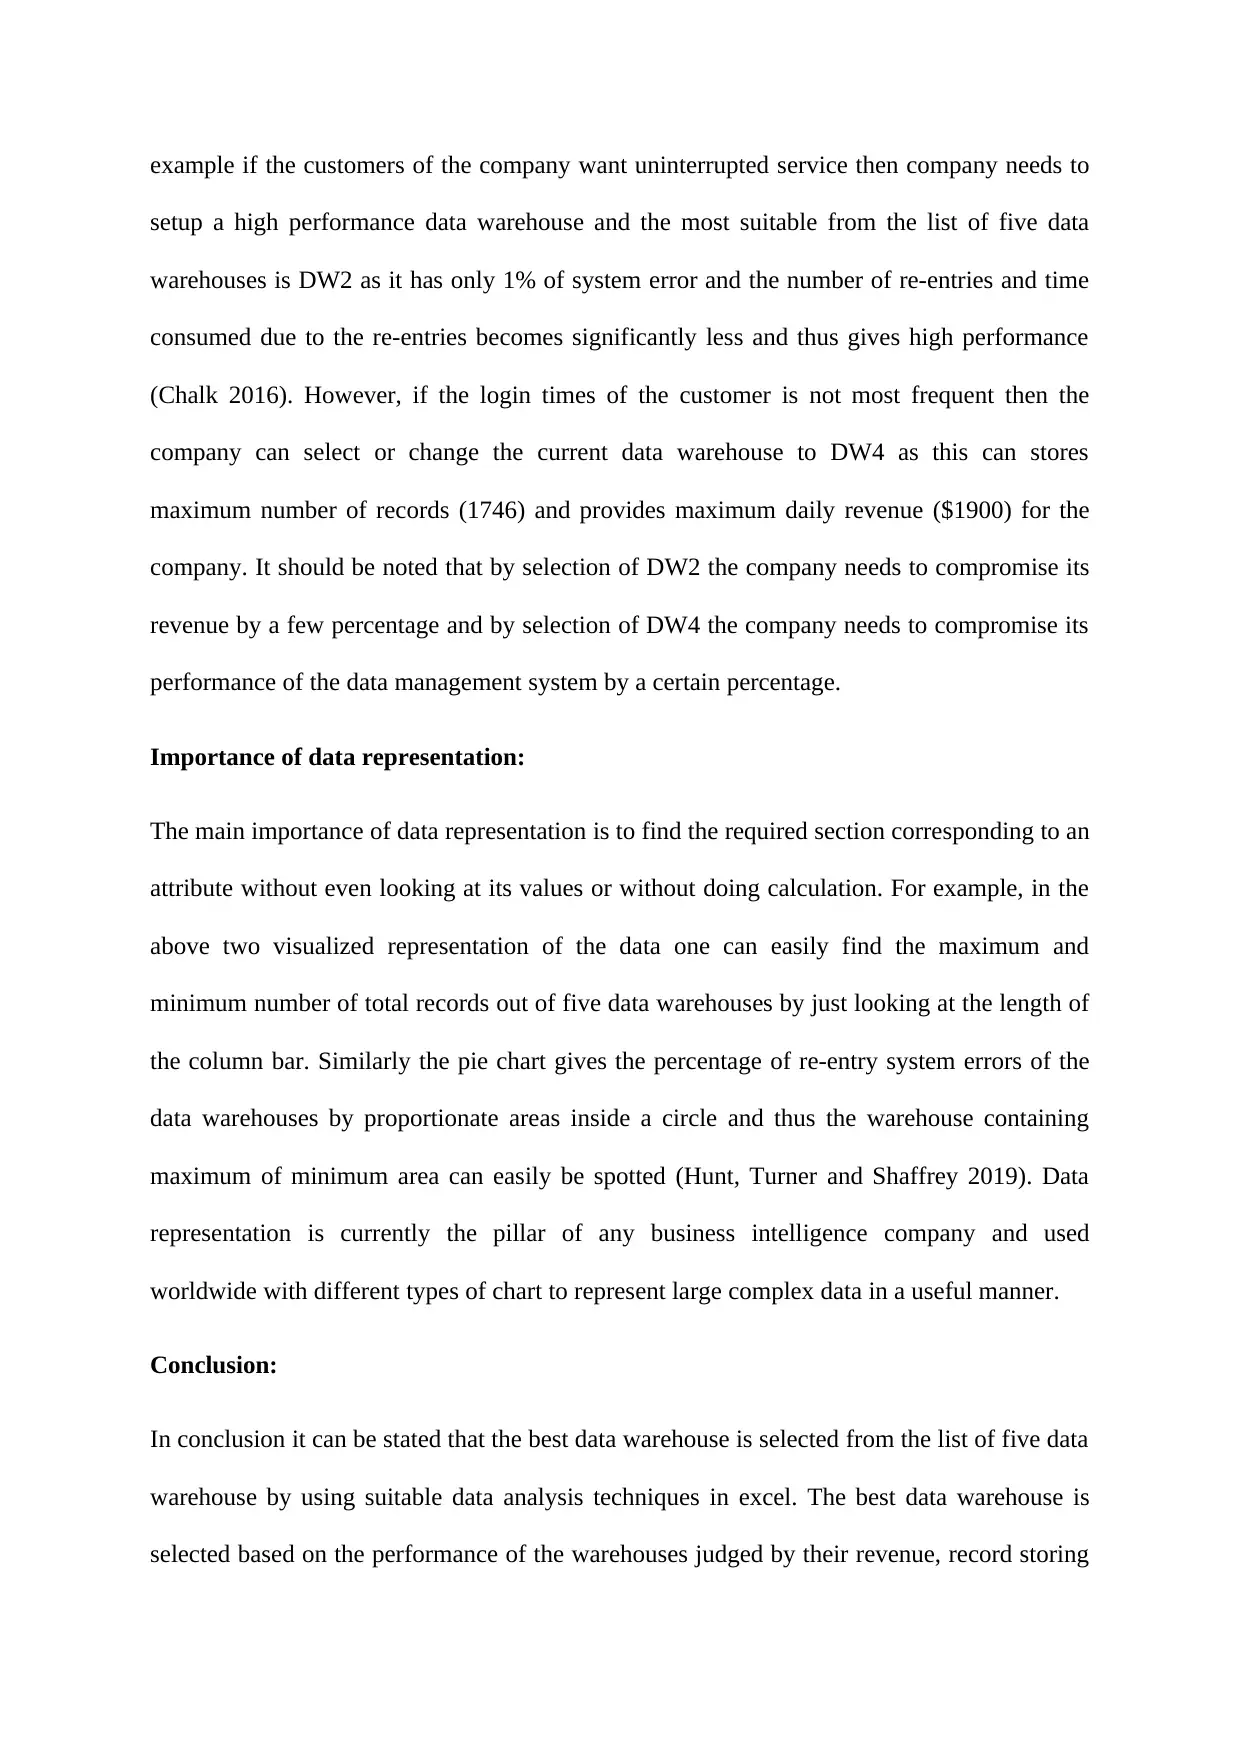
This report presents an analysis of FUSION Company's data, focusing on the selection of an optimal data warehouse system. Utilizing data analysis techniques within Excel, the study evaluates five potential data warehouses (DW1-DW5) based on key performance indicators such as total records, system errors, dimension tables, and daily revenue. Descriptive statistics and visualizations, including clustered column charts and pie charts, are employed to compare the warehouses. The analysis reveals that DW4 offers the maximum record storage and revenue, while DW2 exhibits the fewest system errors. The report emphasizes the importance of data representation in business intelligence and concludes by recommending DW2 for performance and DW4 for capacity and revenue, while also acknowledging the trade-offs between the two. The report also discusses the importance of data representation and visualization for understanding large datasets.

Running head: ICT100 Foundations of Information Systems
ICT100 Foundations of Information Systems
Name of the Student
Name of the University
Author Note
ICT100 Foundations of Information Systems
Name of the Student
Name of the University
Author Note
Paraphrase This Document
Need a fresh take? Get an instant paraphrase of this document with our AI Paraphraser

Introduction:
In this particular assignment data analysis techniques are used to analyse the systems of
FUSION Company to find the best data warehouse system for the company. FUSION is
current undergoing through tough competition as a retail industry as many more companies
are producing similar kinds of products or providing services that are more customer friendly
and easily available. Hence, the company understood to survive in this competitive market,
the only option is to gather the past data of sales which is collected over entire business years
of the company and then to find useful insights of the data to target the customers with their
specific needs. Hence, modern information systems are the only way to survive in the
competitive market (Clayton 2016). At present the IT team of the company evaluated five
data warehouse systems from DW1 to DW5 as their performance specified by the different
software vendors. The performance data is given in the Assessment2-Datafile.xlx and
required properties of the data warehouses are computed and their descriptive statistics has
been calculated using suitable excel formulas as given in the excel file. Further, different
visualizations are created to understand the performance of each warehouse DW1 to DW5 in
different performance properties.
Data Warehouse selection:
In the excel file two properties of the five data warehouses are given and the rest four
properties are calculated using suitable excel formulas. Namely, the records and re-entry
required for system errors of each data warehouses are given. The property total records is
calculated after subtracting the re-entries from the records. Each dimension table of a
warehouse contains 50 records and hence total table of each warehouse is the total records
divided by 50. There are total of 8 databases in each warehouse and hence number of table in
each database is dimension tables by 8. The daily revenue from a warehouse is based on the

number of dimension tables per database and thus is computed by using vlookup function
from the daily revenue chart given below.
Daily revenue chart:
Dimension tables/database Daily
Revenue
1 $1,000.00
2 $1,300.00
3 $1,600.00
4 $1,900.00
5 $2,200.00
Further the measures of central tendency namely minimum, maximum and average for each
property of the five warehouse are calculated by suitable formulas as given below.
DW1 DW2 DW3 DW4 DW5 Total Lowest
Highes
t Average
Records 1400 1300 1100 1800 1000 6600 1000 1800 1320
Re-Entry
Required
due to
system
errors 109 7 295 54 86
550.555
6
6.55555
6 295
110.111
1
⊘ This is a preview!⊘
Do you want full access?
Subscribe today to unlock all pages.

Trusted by 1+ million students worldwide

Total
Records 1291
1293.44
4 805 1746 914
6049.44
4 805 1746
1209.88
9
Dimension
Tables 26 26 16 35 18
120.988
9 16.1 34.92
24.1977
8
Tables per
database
(8
databases) 3.2 3.2 2.0 4.4 2.3
15.1236
1 2.0125 4.365
3.02472
2
Daily
Revenue($
) 1600 1600 1300 1900 1300 7700 1300 1900 1540
For a better understanding of the performances of 5 warehouses a clustered column chart of
the total records is created along with a pie chart of the system errors of the data warehouses.
Clustered column chart of total records:
Paraphrase This Document
Need a fresh take? Get an instant paraphrase of this document with our AI Paraphraser

DW1 DW2 DW3 DW4 DW5
0
200
400
600
800
1000
1200
1400
1600
1800
2000
Total records
Pie chart of system errors:
DW1
20%
DW2
1%
DW3
54%
DW4
10%
DW5
16%
System errors
From the table and the chart it is clear that DW4 has the maximum number of records and
DW2 has the minimum number of system errors. Also, the revenue generated is maximum
from the DW4 warehouse. Hence, the best warehouse for the company from the point of view
of least system errors is DW2, however, from the point of view of maximum record storing
capacity and maximum revenue the best warehouse is DW4. The company can also alternate
their selection based on their requirement at a certain time period (Wilson 2017). For,

example if the customers of the company want uninterrupted service then company needs to
setup a high performance data warehouse and the most suitable from the list of five data
warehouses is DW2 as it has only 1% of system error and the number of re-entries and time
consumed due to the re-entries becomes significantly less and thus gives high performance
(Chalk 2016). However, if the login times of the customer is not most frequent then the
company can select or change the current data warehouse to DW4 as this can stores
maximum number of records (1746) and provides maximum daily revenue ($1900) for the
company. It should be noted that by selection of DW2 the company needs to compromise its
revenue by a few percentage and by selection of DW4 the company needs to compromise its
performance of the data management system by a certain percentage.
Importance of data representation:
The main importance of data representation is to find the required section corresponding to an
attribute without even looking at its values or without doing calculation. For example, in the
above two visualized representation of the data one can easily find the maximum and
minimum number of total records out of five data warehouses by just looking at the length of
the column bar. Similarly the pie chart gives the percentage of re-entry system errors of the
data warehouses by proportionate areas inside a circle and thus the warehouse containing
maximum of minimum area can easily be spotted (Hunt, Turner and Shaffrey 2019). Data
representation is currently the pillar of any business intelligence company and used
worldwide with different types of chart to represent large complex data in a useful manner.
Conclusion:
In conclusion it can be stated that the best data warehouse is selected from the list of five data
warehouse by using suitable data analysis techniques in excel. The best data warehouse is
selected based on the performance of the warehouses judged by their revenue, record storing
⊘ This is a preview!⊘
Do you want full access?
Subscribe today to unlock all pages.

Trusted by 1+ million students worldwide

capacity and least re-entry system errors. Two data warehouses namely DW2 and DW4 are
selected as best warehouse for the company in terms of least re-entry system errors or
maximum performance and the maximum revenue generated on a daily basis. Furthermore
useful statistics of the different attributes of the databases are found using excel functions and
represented as a reference to analytically estimate the best data warehouse for the company. It
is assumed that all the data warehouses are identical in terms of their attributes i.e. no
warehouse has an extra or less attribute than the others.
References:
Clayton, T., 2016. Master Excel: Sharing Your Work, Charts and Graphing (Volume 3).
Hunt, K.M., Turner, A.G. and Shaffrey, L.C., 2019. Representation of western disturbances
in CMIP5 models. Journal of Climate, 32(7), pp.1997-2011.
Wilson, S.J., 2017. Data representation for time series data mining: time domain approaches.
Wiley Interdisciplinary Reviews: Computational Statistics, 9(1), p.e1392.
Chalk, S.J., 2016. SciData: a data model and ontology for semantic representation of
scientific data. Journal of cheminformatics, 8(1), p.54.
1 out of 7

Your All-in-One AI-Powered Toolkit for Academic Success.
 +13062052269
info@desklib.com
Available 24*7 on WhatsApp / Email
Unlock your academic potential
Copyright © 2020–2025 A2Z Services. All Rights Reserved. Developed and managed by ZUCOL.