University Data Science: Assignment 2 on Data Warehousing & Analysis
VerifiedAdded on 2020/03/04
|22
|3176
|50
Report
AI Summary
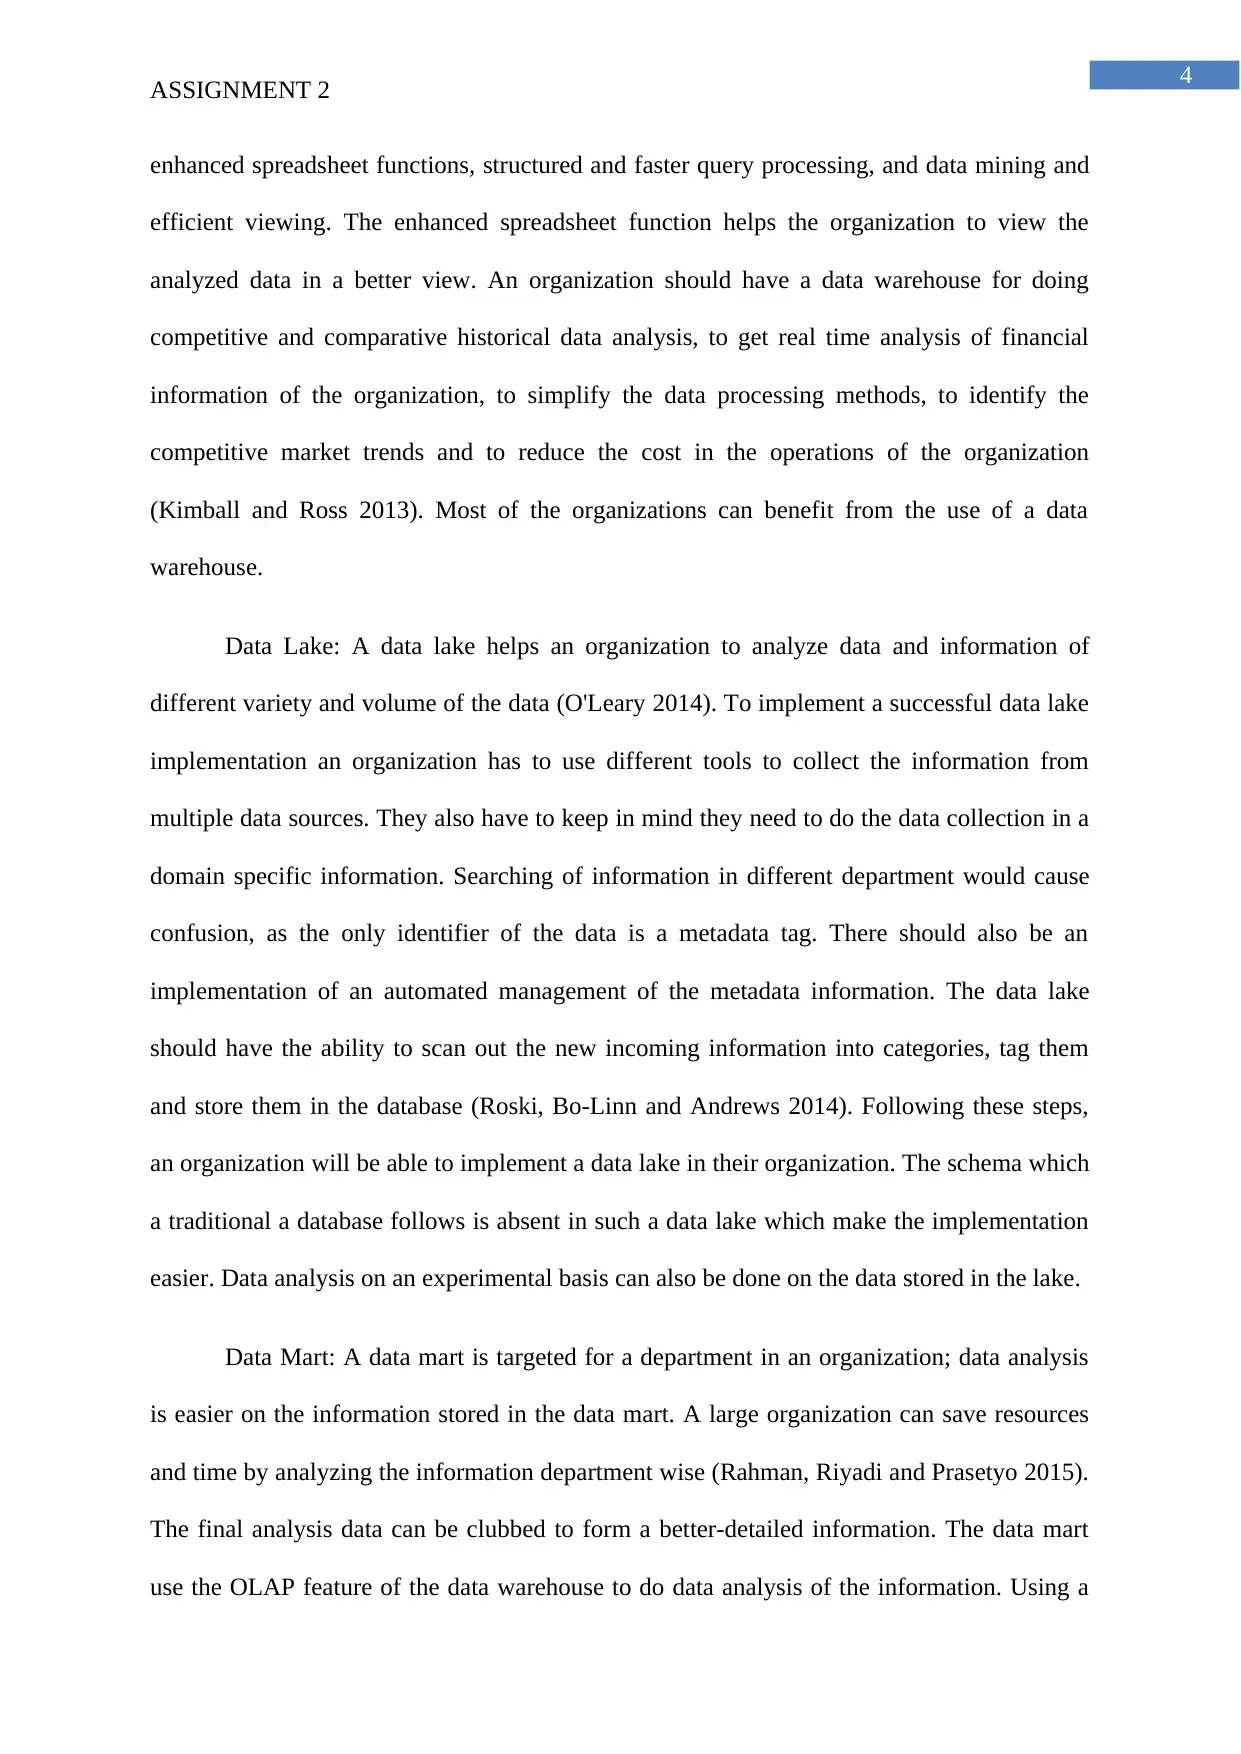
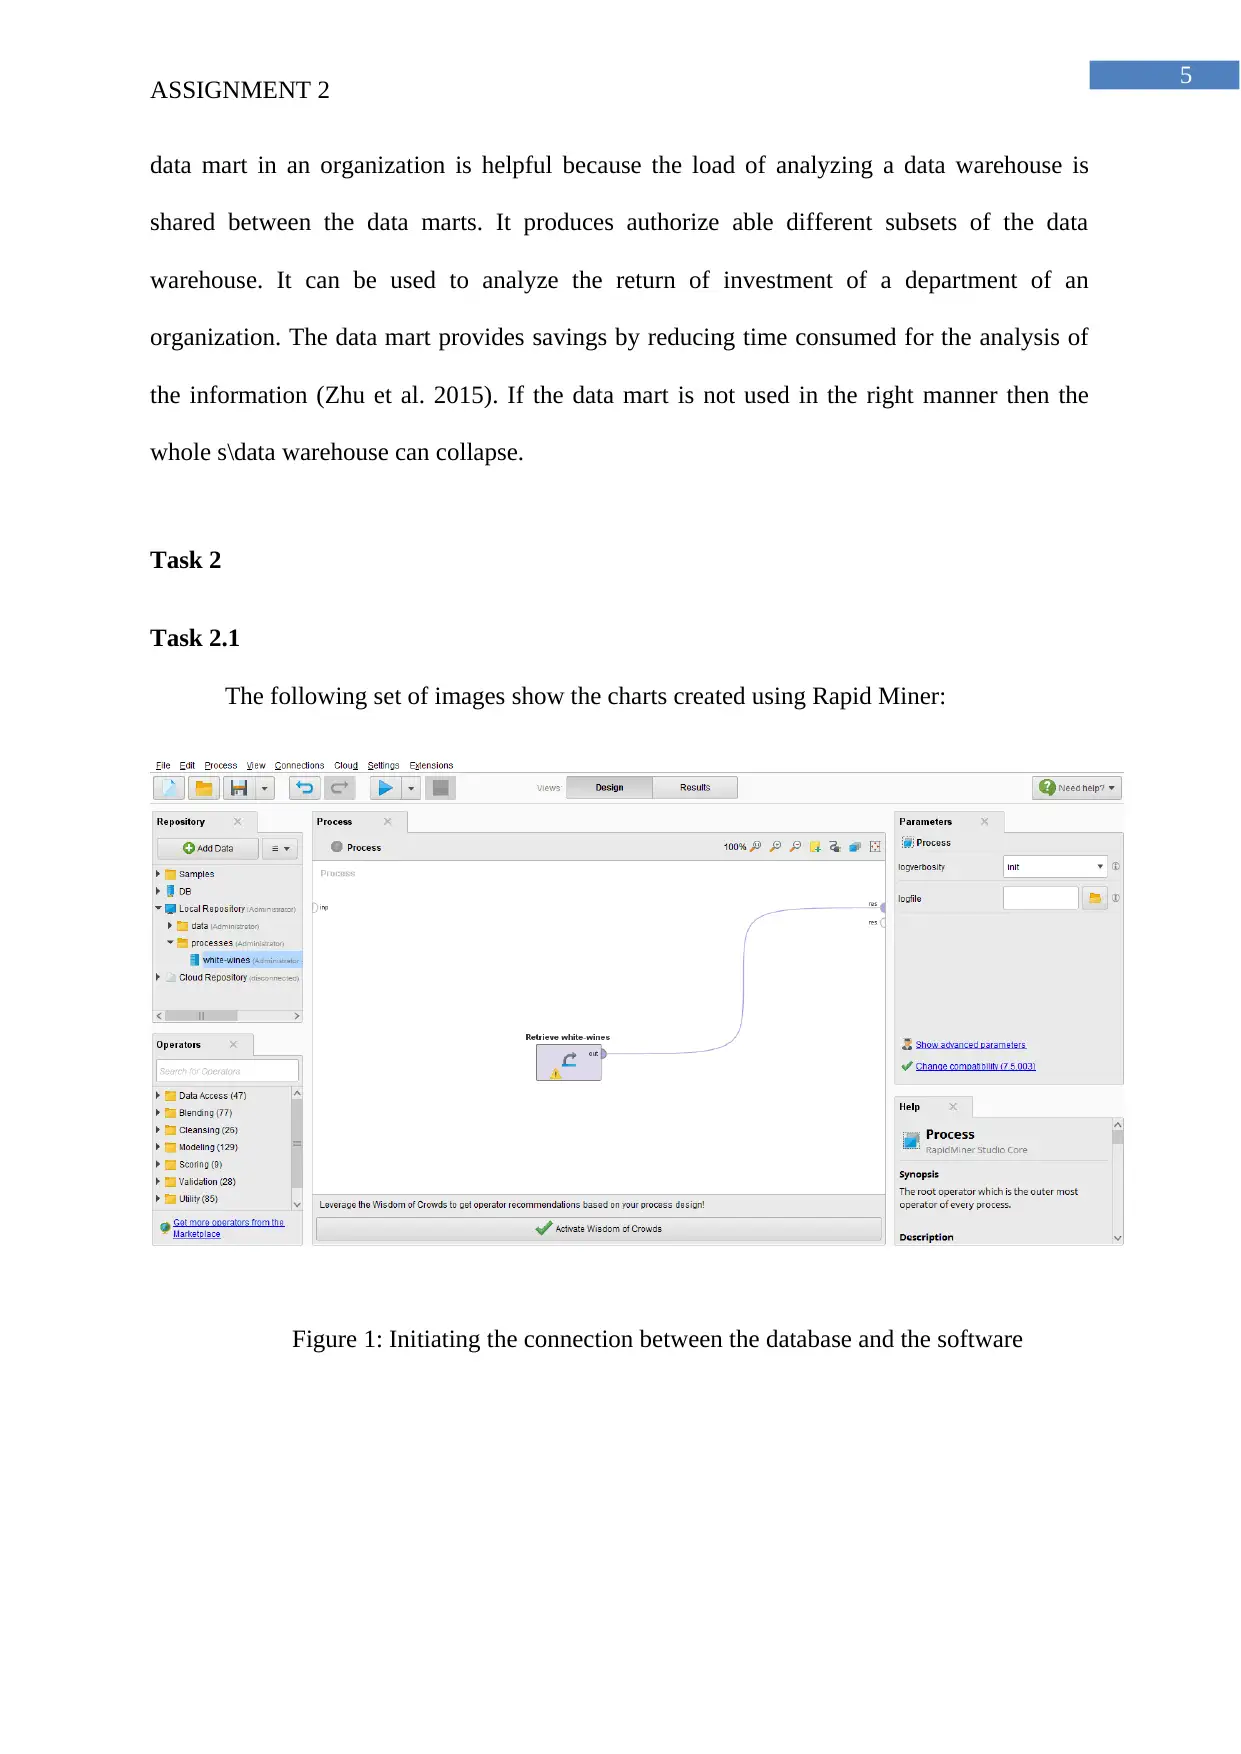
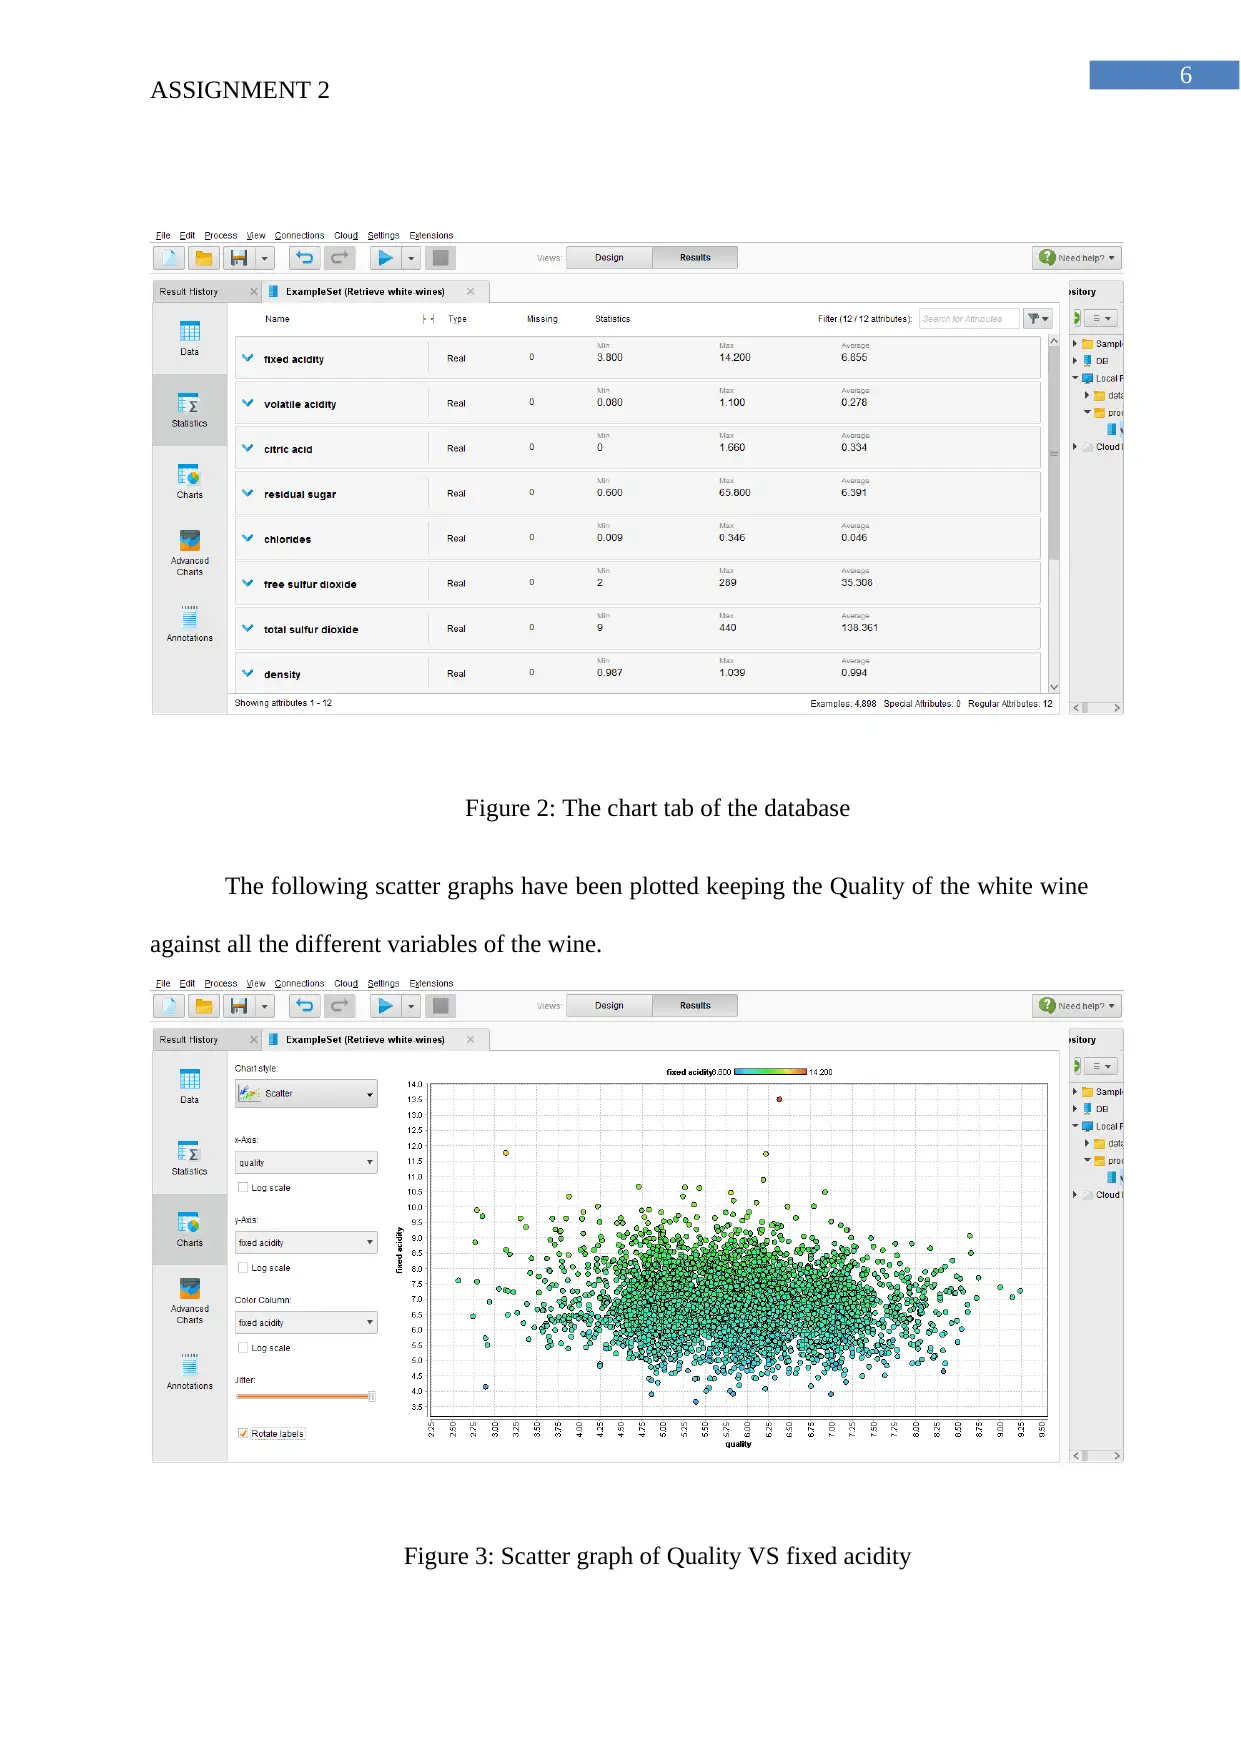
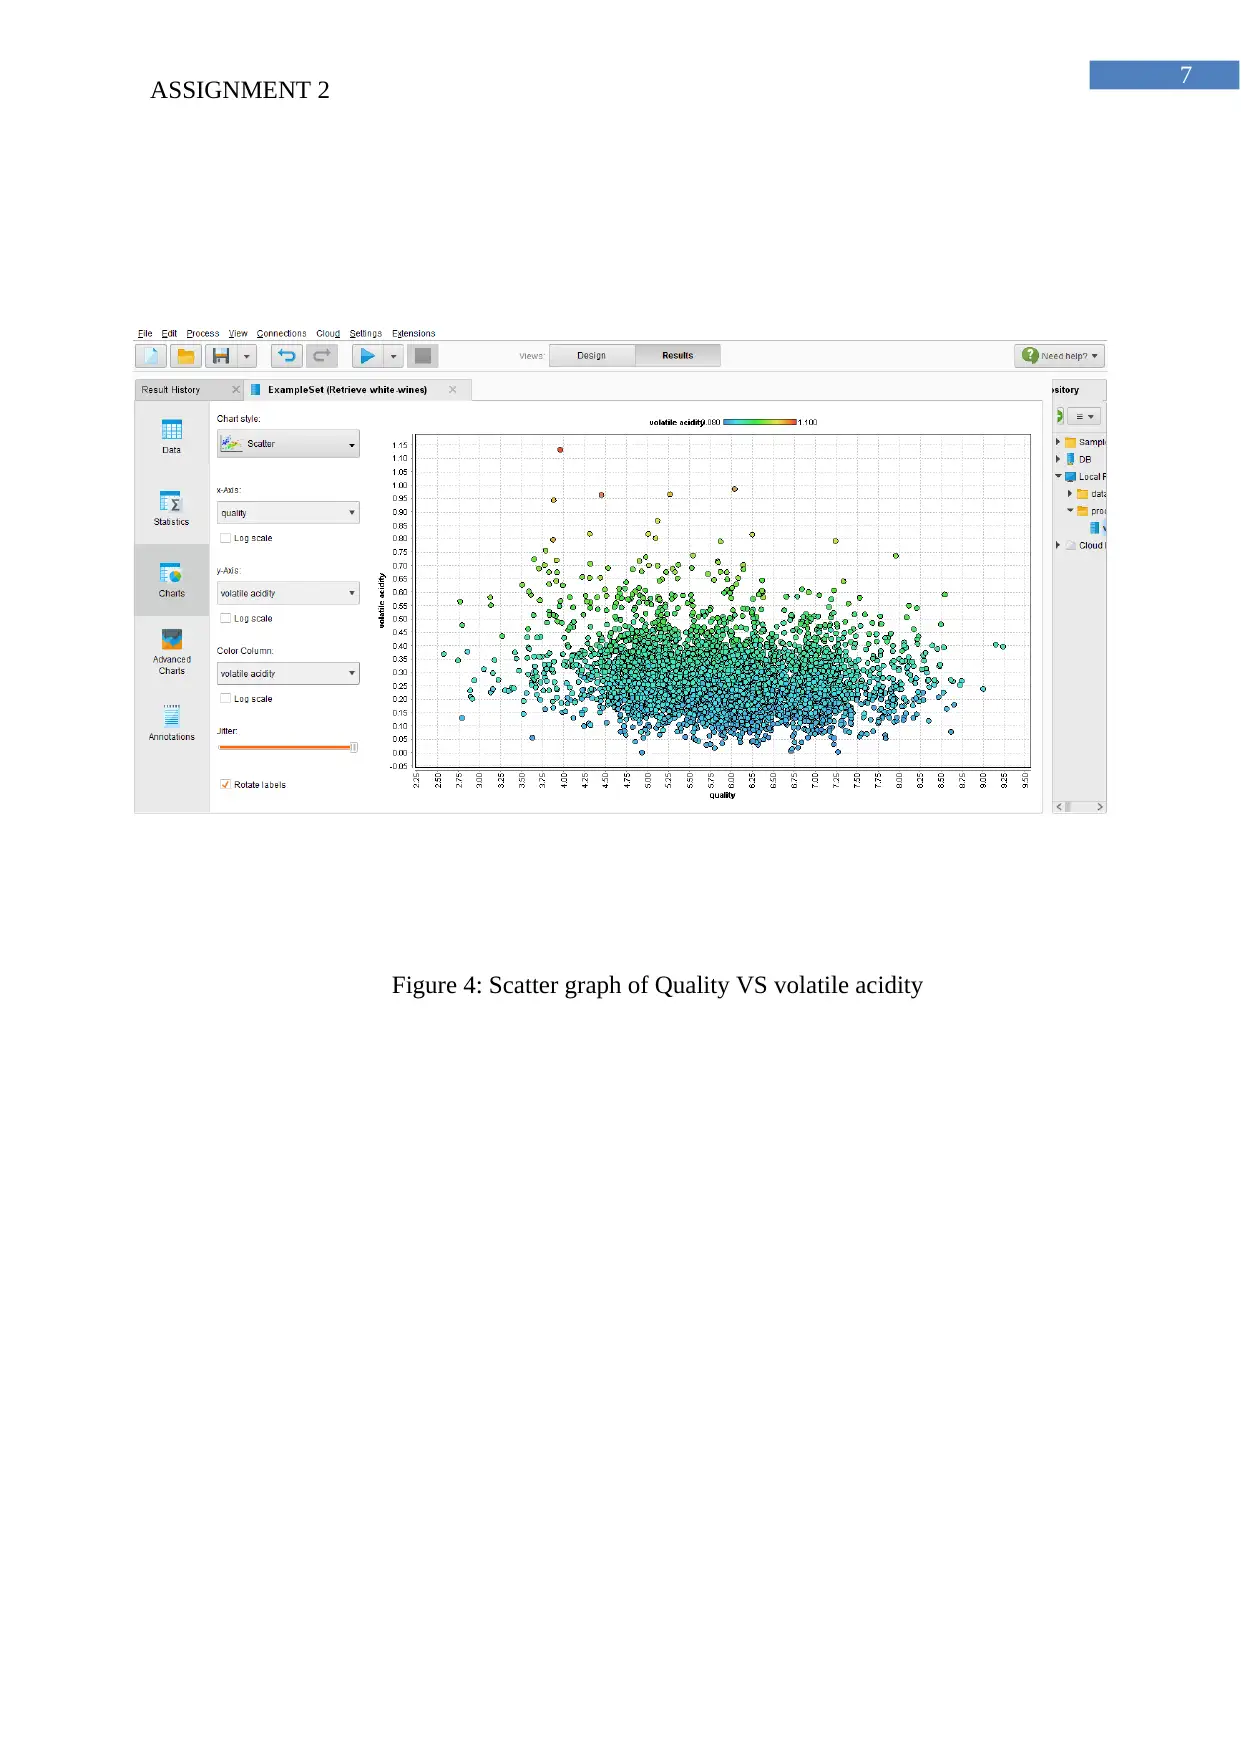
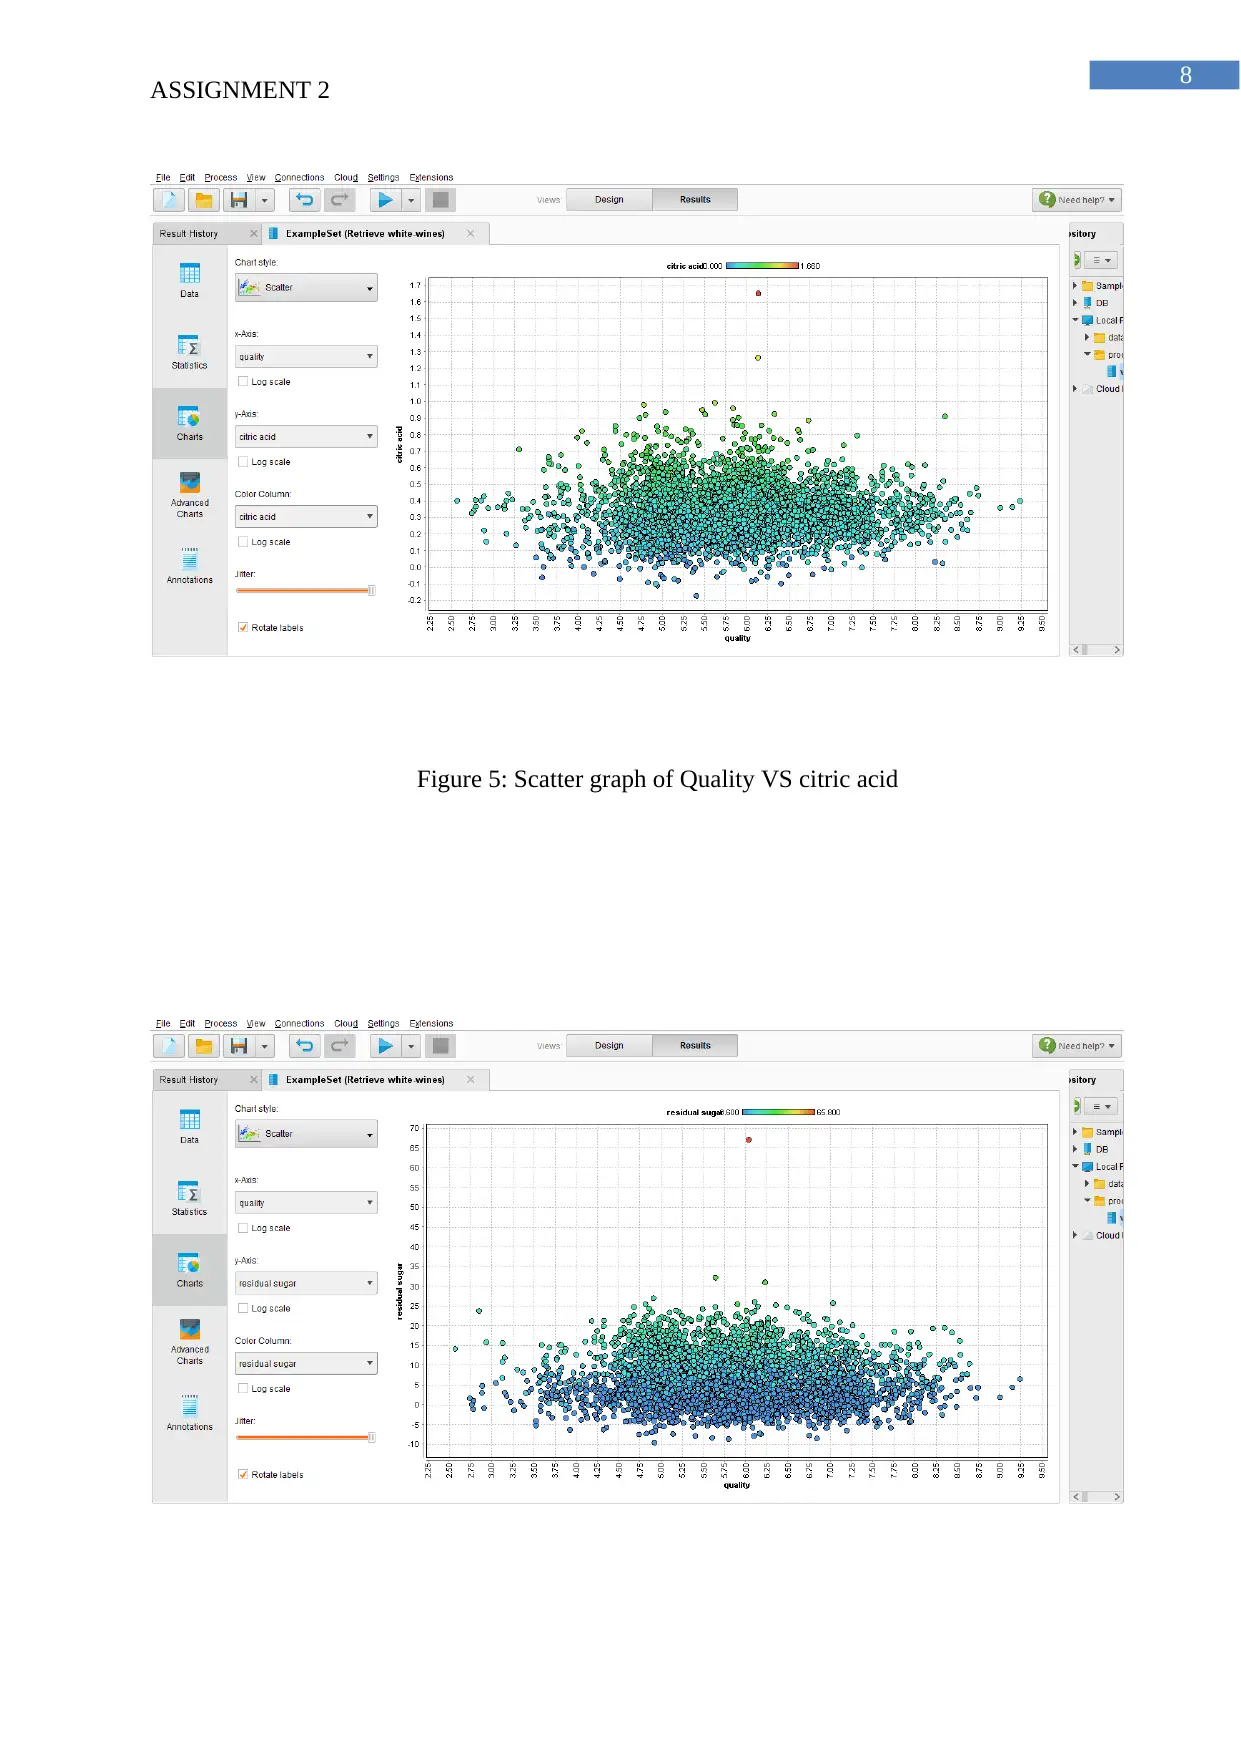
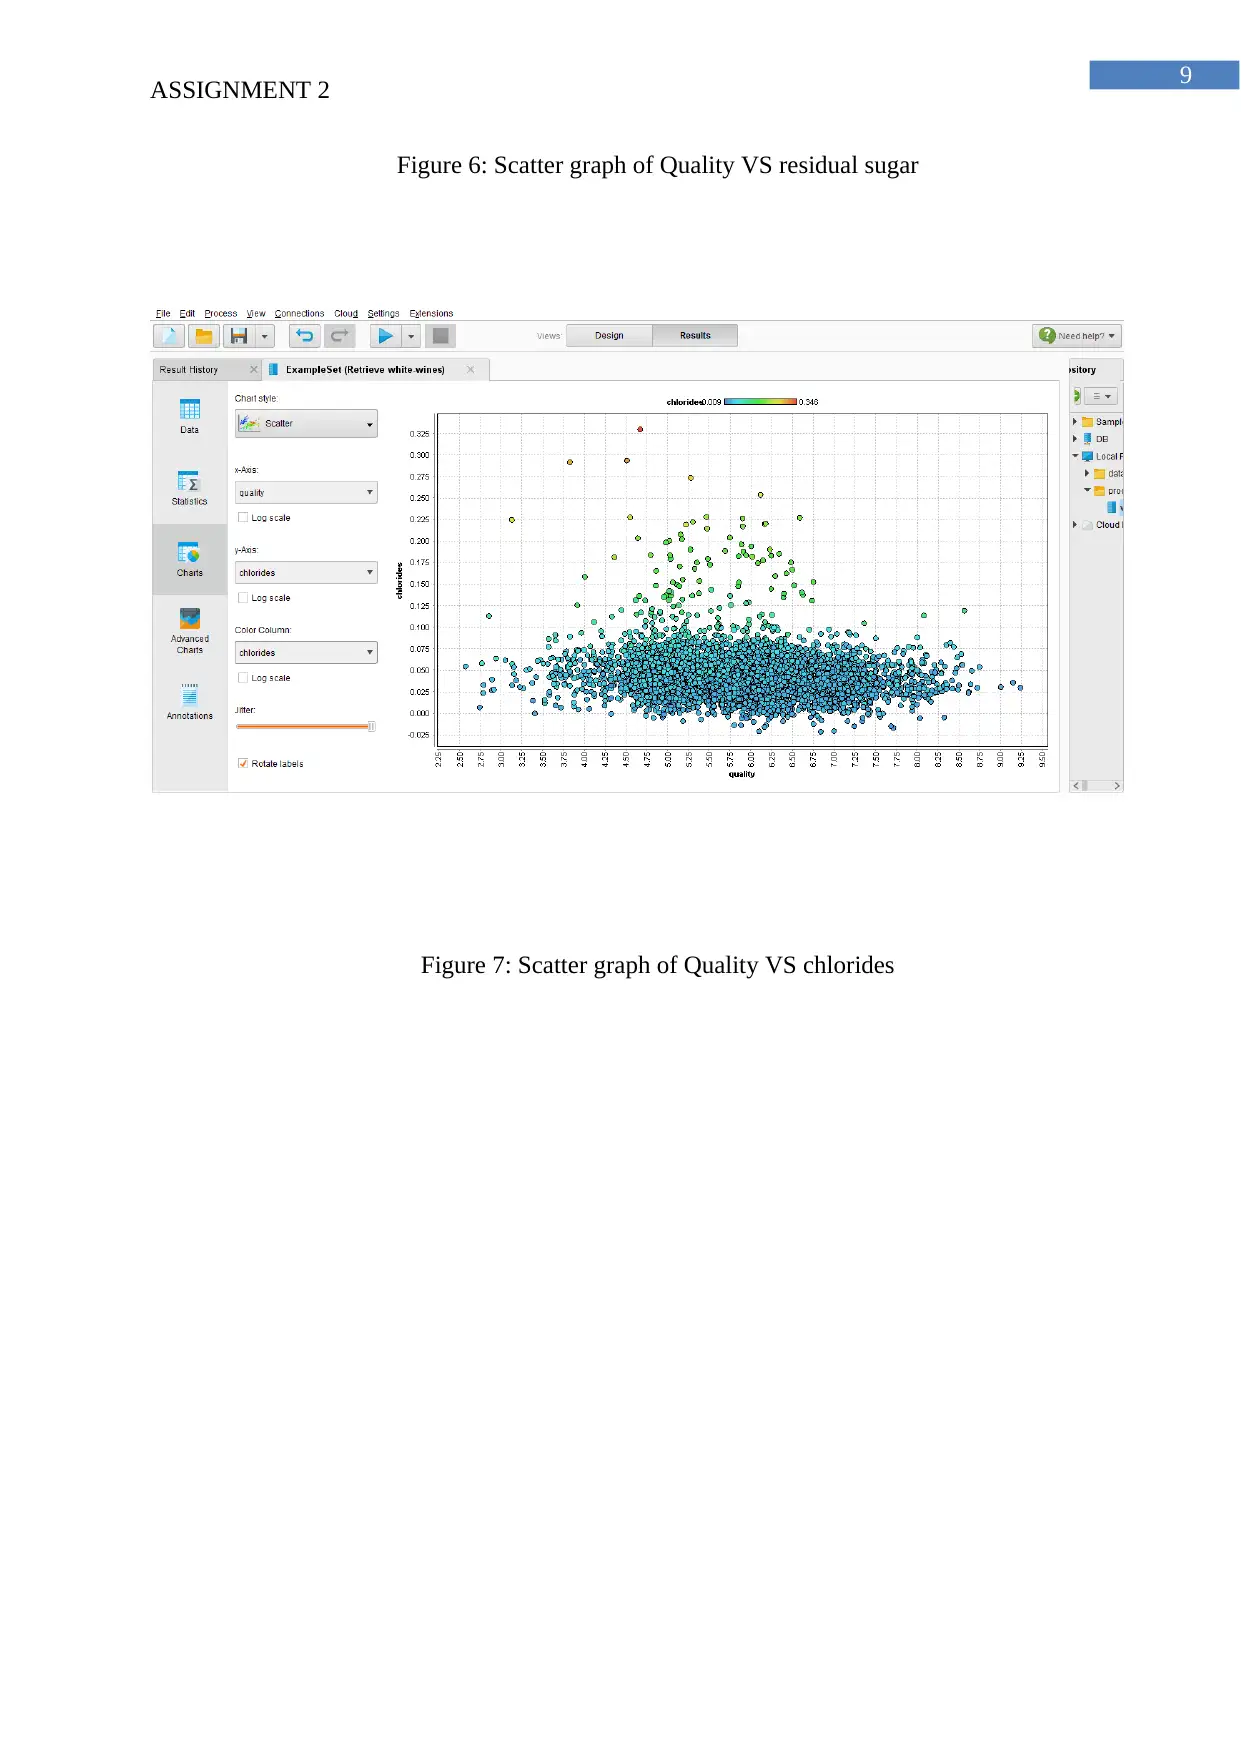
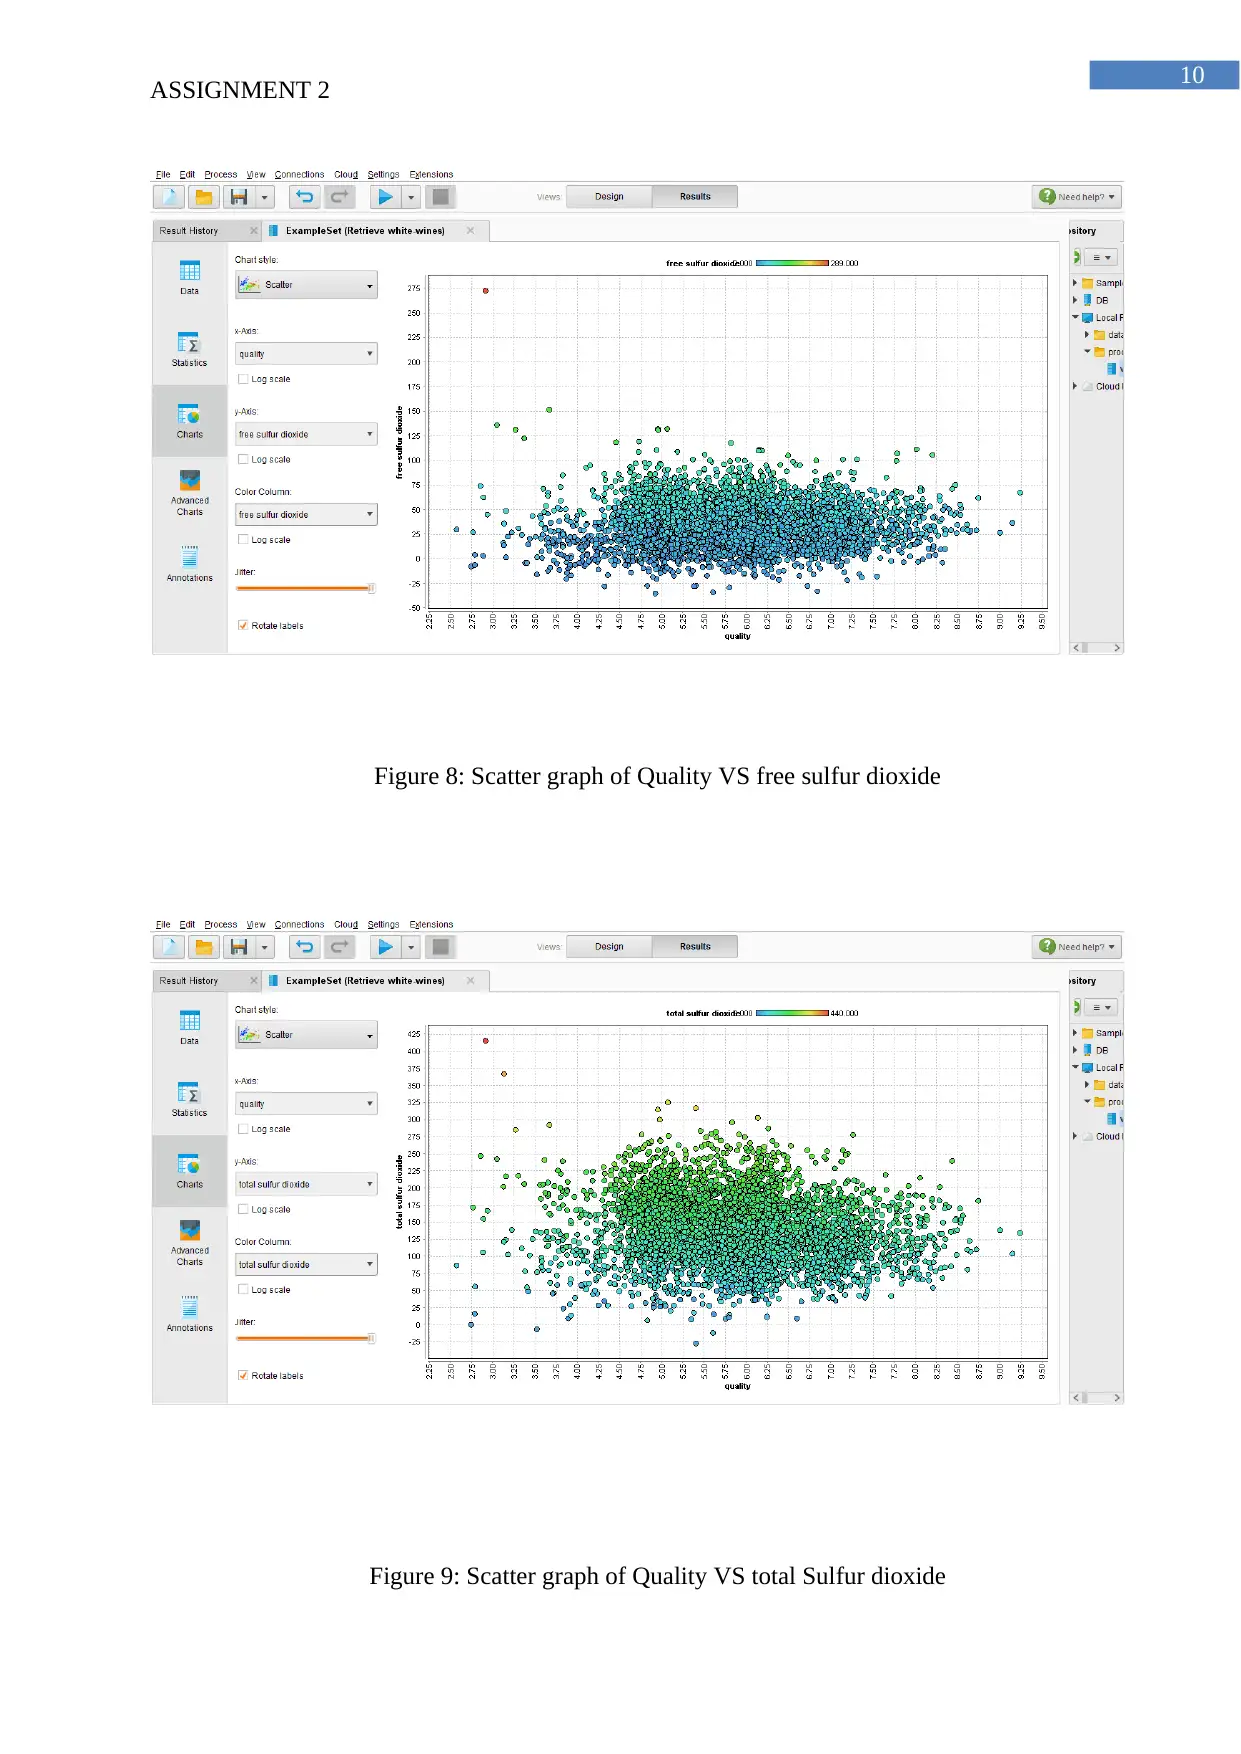
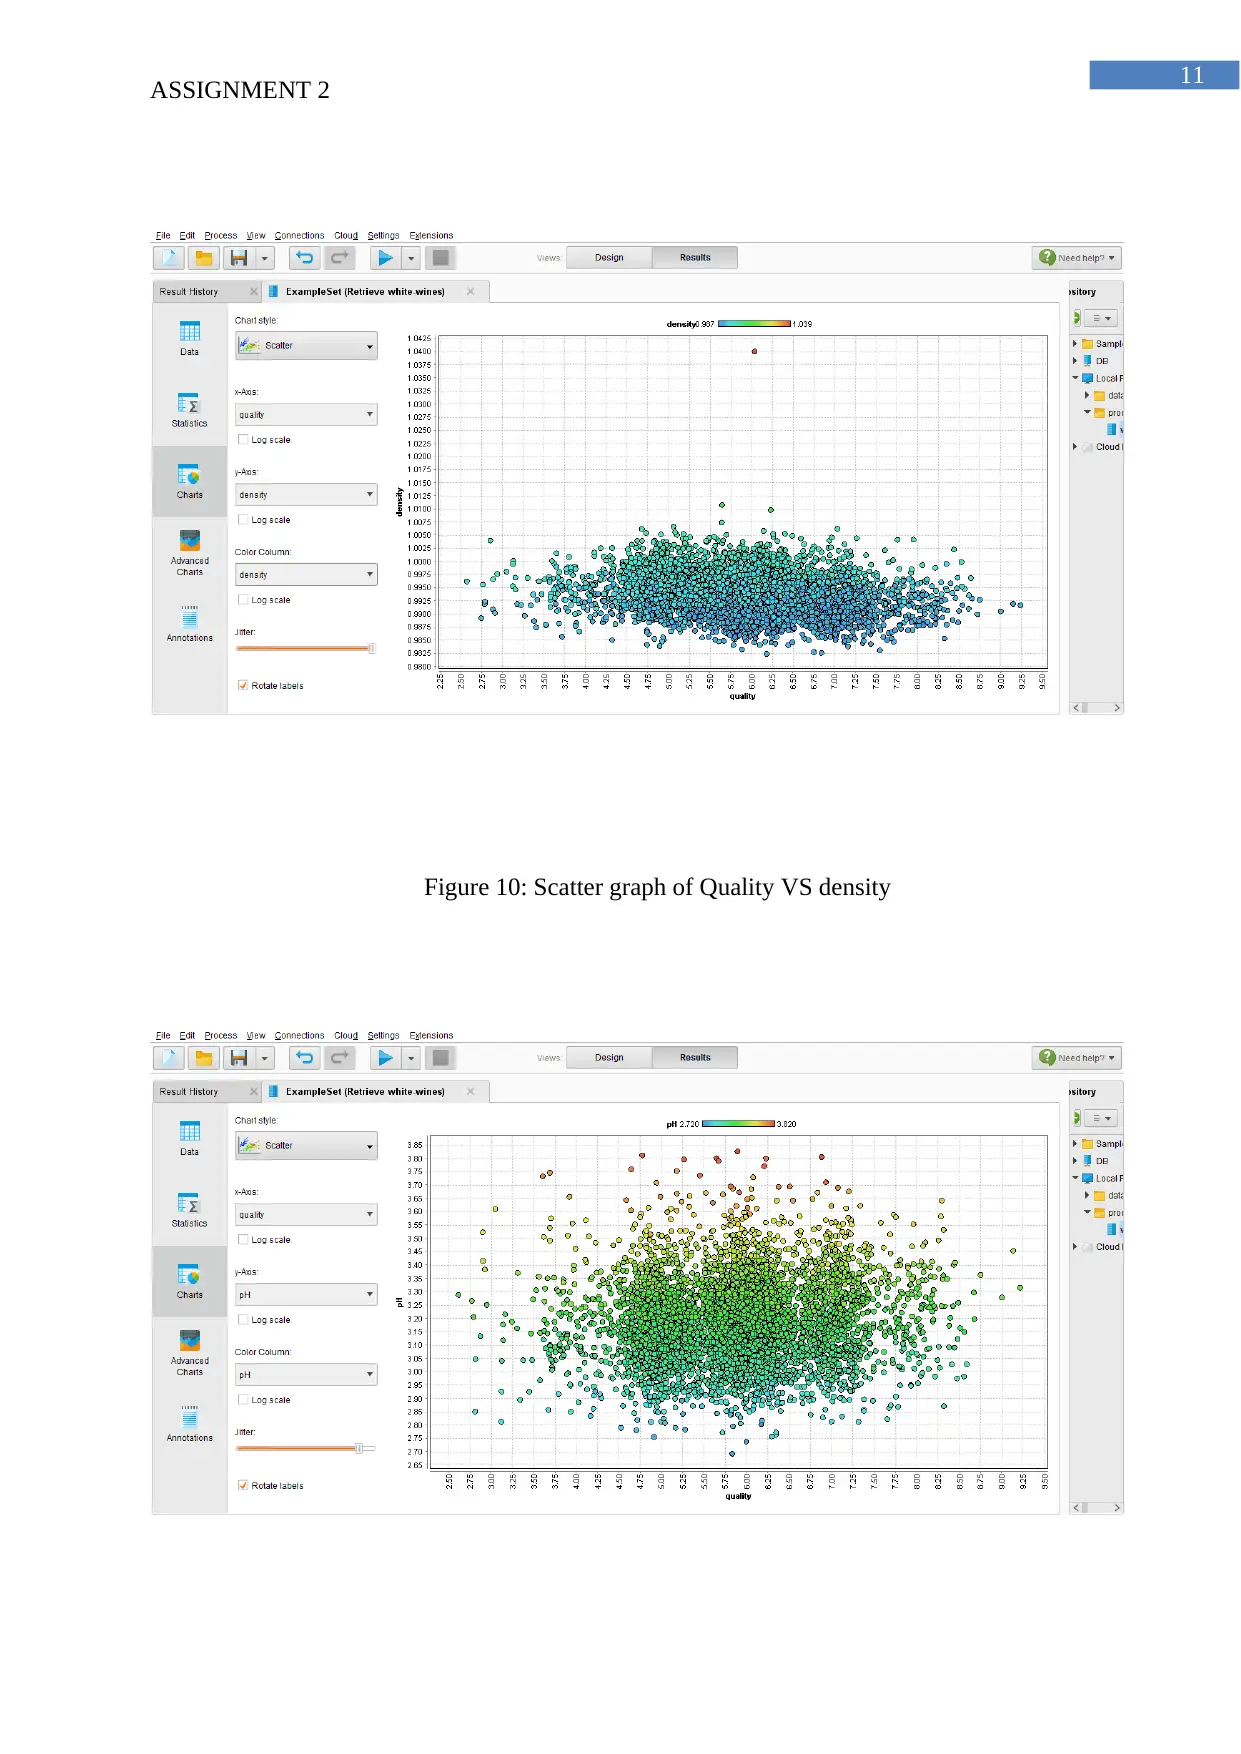
This report analyzes data warehousing, data lakes, and data marts, comparing their functionalities and applications within organizations. It explores data warehousing's role in structured data analysis, data lakes for handling diverse data types, and data marts for departmental data analysis. The report then presents a practical application of data analysis using RapidMiner. The analysis focuses on determining the key variables influencing white wine quality through scatter graphs and a correlation table. Furthermore, it details the process of creating a linear regression model to predict wine quality, providing the resulting equation and coefficient values for each variable. The report highlights the top five variables affecting wine quality, according to both the initial scatter graph analysis and the correlation table, concluding with the linear regression equation derived from the RapidMiner analysis.

Running head: ASSIGNMENT 2
Assignment 2
Name of the Student
Name of the University
Author Note
Assignment 2
Name of the Student
Name of the University
Author Note
Paraphrase This Document
Need a fresh take? Get an instant paraphrase of this document with our AI Paraphraser

1
ASSIGNMENT 2
Table of Contents
Task 1.........................................................................................................................................2
Task 1.1..................................................................................................................................2
Task 1.2..................................................................................................................................3
Task 2.........................................................................................................................................5
Task 2.1..................................................................................................................................5
Task 2.2................................................................................................................................13
Task 3.......................................................................................................................................17
References................................................................................................................................19

2
ASSIGNMENT 2
Task 1
Task 1.1
Data Warehouse: A data warehouse is a kind of relational database designed for
specific query and data analysis. It is not used for regular transactional processing of the data.
Historical data collected from different sources are collected from different transactional data
and other sources. A data warehouse helps the organization to separate out the analysis
workload from the transactional workload of the servers (Kimball 2013). Apart from the
analysis capabilities, a data warehouse also has the capability to do data extraction,
transportation, data transformation and data loading solutions. It also includes an online
analytical processing engine (OLAP), client data analysis tools and applications, which are
used to process the gathering of information and to deliver it to the users. A data warehouse is
designed to help in analyzing of the information collected from the sources. To learn more
about a department of an organization, they can invest in a data warehouse, which will
analyses the information collected from the department (Vaisman and Zimányi 2014). The
ability to analyses the information in a section wise manner helps the warehouse to be subject
oriented in nature. A data warehouse has the properties of being subject oriented in nature,
has data integration procedures, stores time variant information, and has storage for
nonvolatile information. To implement a correct data warehouse the organizations must
follow correct design mechanism.
Data Lake: A data lake is a new generation of data storage procedure that has been
developed to meet the new emerging trends in data analysis. It can be defined as a temporary
storage area for data being collected from the online resources for the analysis of the
organization. The data collected is just dropped into the data lake accompanied by a unique
identifier. This identifier can be used to identify the data that it holds. The identifier ca be
⊘ This is a preview!⊘
Do you want full access?
Subscribe today to unlock all pages.

Trusted by 1+ million students worldwide

3
ASSIGNMENT 2
compared to being a metadata tag of the information collected (Miloslavskaya and Tolstoy
2016). When data analysis is done of the information, the identifiers are called upon by using
a query. The relevant information is collected and the result is returned. The data fetched is
analyzed and a compact decision is provided. The term Data Lake is coined it the Hadoop
oriented object storage. Using a data lake can provide effective information during data
analysis or when data mining is done on the organization (Fang 2015). The concept of a data
lake is a new trend in the digital world and is being slowly accepted. As a data lake is a large
storage of information there is no need to follow any schema for designing the storage facility
of the database.
Data Mart: Data mart is a small version of data warehouse that is used by a certain
class of workers to store their data analysis information. The term is often misused with data
warehouse, but they are very different terms (Ramos, Alturas and Moro 2017). However,
they might to the same work but the working environment is different. For a larger
organization, there is always the option of using a data warehouse. However, the use of a data
mart concept in new it is slowly being accepted into the digital world (Golfarelli and Rizzi
2013).
Task 1.2
Data Warehouse: Data has been stored in a data warehouse at a very granular level of
details. During analysis, all information related to the query is extracted, changed and loaded.
This means that the information is first extracted from the sources and changed into a
common format for the warehouse to read it (Ross et al. 2014). The revised information is
then loaded into the database to continue analyzing. When a query is sent to the data
warehouse, it first locates the information from the warehouse and retrieves the data. It then
presents the information in an integrated view for the user to view. A warehouse provides a
better form of query support than the traditional database. The warehouse has access to
Paraphrase This Document
Need a fresh take? Get an instant paraphrase of this document with our AI Paraphraser

4
ASSIGNMENT 2
enhanced spreadsheet functions, structured and faster query processing, and data mining and
efficient viewing. The enhanced spreadsheet function helps the organization to view the
analyzed data in a better view. An organization should have a data warehouse for doing
competitive and comparative historical data analysis, to get real time analysis of financial
information of the organization, to simplify the data processing methods, to identify the
competitive market trends and to reduce the cost in the operations of the organization
(Kimball and Ross 2013). Most of the organizations can benefit from the use of a data
warehouse.
Data Lake: A data lake helps an organization to analyze data and information of
different variety and volume of the data (O'Leary 2014). To implement a successful data lake
implementation an organization has to use different tools to collect the information from
multiple data sources. They also have to keep in mind they need to do the data collection in a
domain specific information. Searching of information in different department would cause
confusion, as the only identifier of the data is a metadata tag. There should also be an
implementation of an automated management of the metadata information. The data lake
should have the ability to scan out the new incoming information into categories, tag them
and store them in the database (Roski, Bo-Linn and Andrews 2014). Following these steps,
an organization will be able to implement a data lake in their organization. The schema which
a traditional a database follows is absent in such a data lake which make the implementation
easier. Data analysis on an experimental basis can also be done on the data stored in the lake.
Data Mart: A data mart is targeted for a department in an organization; data analysis
is easier on the information stored in the data mart. A large organization can save resources
and time by analyzing the information department wise (Rahman, Riyadi and Prasetyo 2015).
The final analysis data can be clubbed to form a better-detailed information. The data mart
use the OLAP feature of the data warehouse to do data analysis of the information. Using a

5
ASSIGNMENT 2
data mart in an organization is helpful because the load of analyzing a data warehouse is
shared between the data marts. It produces authorize able different subsets of the data
warehouse. It can be used to analyze the return of investment of a department of an
organization. The data mart provides savings by reducing time consumed for the analysis of
the information (Zhu et al. 2015). If the data mart is not used in the right manner then the
whole s\data warehouse can collapse.
Task 2
Task 2.1
The following set of images show the charts created using Rapid Miner:
Figure 1: Initiating the connection between the database and the software
⊘ This is a preview!⊘
Do you want full access?
Subscribe today to unlock all pages.

Trusted by 1+ million students worldwide

6
ASSIGNMENT 2
Figure 2: The chart tab of the database
The following scatter graphs have been plotted keeping the Quality of the white wine
against all the different variables of the wine.
Figure 3: Scatter graph of Quality VS fixed acidity
ASSIGNMENT 2
Figure 2: The chart tab of the database
The following scatter graphs have been plotted keeping the Quality of the white wine
against all the different variables of the wine.
Figure 3: Scatter graph of Quality VS fixed acidity
Paraphrase This Document
Need a fresh take? Get an instant paraphrase of this document with our AI Paraphraser

7
ASSIGNMENT 2
Figure 4: Scatter graph of Quality VS volatile acidity
ASSIGNMENT 2
Figure 4: Scatter graph of Quality VS volatile acidity

8
ASSIGNMENT 2
Figure 5: Scatter graph of Quality VS citric acid
ASSIGNMENT 2
Figure 5: Scatter graph of Quality VS citric acid
⊘ This is a preview!⊘
Do you want full access?
Subscribe today to unlock all pages.

Trusted by 1+ million students worldwide

9
ASSIGNMENT 2
Figure 6: Scatter graph of Quality VS residual sugar
Figure 7: Scatter graph of Quality VS chlorides
ASSIGNMENT 2
Figure 6: Scatter graph of Quality VS residual sugar
Figure 7: Scatter graph of Quality VS chlorides
Paraphrase This Document
Need a fresh take? Get an instant paraphrase of this document with our AI Paraphraser

10
ASSIGNMENT 2
Figure 8: Scatter graph of Quality VS free sulfur dioxide
Figure 9: Scatter graph of Quality VS total Sulfur dioxide
ASSIGNMENT 2
Figure 8: Scatter graph of Quality VS free sulfur dioxide
Figure 9: Scatter graph of Quality VS total Sulfur dioxide

11
ASSIGNMENT 2
Figure 10: Scatter graph of Quality VS density
ASSIGNMENT 2
Figure 10: Scatter graph of Quality VS density
⊘ This is a preview!⊘
Do you want full access?
Subscribe today to unlock all pages.

Trusted by 1+ million students worldwide
1 out of 22
Related Documents

Your All-in-One AI-Powered Toolkit for Academic Success.
+13062052269
info@desklib.com
Available 24*7 on WhatsApp / Email
Unlock your academic potential
Copyright © 2020–2025 A2Z Services. All Rights Reserved. Developed and managed by ZUCOL.