Data Handling Report: Weka vs. Excel and Data Mining Methods
VerifiedAdded on 2023/01/11
|13
|3265
|100
Report
AI Summary
This report provides a comprehensive overview of data handling, encompassing data warehousing, business intelligence, and data mining. It begins by outlining current trends in these areas, emphasizing their importance in organizational decision-making. The report then evaluates the role of Excel in data pre-processing and determination, showcasing its data analysis and visualization capabilities through examples. Furthermore, it delves into the use of Weka, a machine learning tool, providing an example of its application and comparing its advantages and disadvantages relative to Excel. The report also explains common data mining methods such as classification, tracking patterns, prediction, and regression used by organizations. Through detailed examples and comparisons, the report illustrates how different tools and techniques can be employed to analyze data, gain insights, and make informed decisions.
DATA HANDLING
1
1
Paraphrase This Document
Need a fresh take? Get an instant paraphrase of this document with our AI Paraphraser
Table of Contents
INTRODUCTION...........................................................................................................................3
PART 1............................................................................................................................................3
Current trend in data warehousing, business intelligence and data mining...........................3
For pre-processing and determining the data uses of excel are evaluated.............................4
PART 2............................................................................................................................................7
2.1 Providing the conjunction with Weka through an example.............................................7
2.2 Explain the most common methods associated with data mining which are used by the
organization............................................................................................................................9
2.3 Critically evaluating the advantages and disadvantages of Weka over Excel................10
CONCLUSION.............................................................................................................................11
REFERENCES..............................................................................................................................12
2
INTRODUCTION
\ Data handling is considered to be as one of the most effective platform which is very
beneficial in storing and disposing off the information within the safe and secure manner. As it
is one of the most important measure which used to help them in handling the different large set
of data effectively in the organization (Obeidat, and et.al., 2015). This report has explain
Different trend which are generally prevailing in data warehousing, business intelligence and
data mining in the current scenario. Report will also highlight the use of excel for pre processing
and data determining in the organization. After that in the second part of the report explains the
different advantage of Weka over excel in the organization. Also, report explain common
methods associated with data mining.
PART 1
Current trend in data warehousing, business intelligence and data mining
There are many different type of trends which are generally prevailing in context of Data
warehousing, business intelligence and data mining in the organization. This eventually used to
help Organization in achieving the different goals and objective very efficiently in an
organization. This trend are very important for the business to look at this trend as this trend will
help the organization in making the variety of the decision in regards to data collection, analysis
and interpret data which generally provide good basis for decision making in the company.
Data Warehousing: Data warehousing as the name suggest is the name of process which
used to help in constructing and effectively usage of data warehouses in an organization. This
process generally help on achieving the different goal and objective of the business very
effectively in an organization, as data warehousing used to help in taking different decision very
effectively in an organization (Vanani and Jalali, 2017). Data Warehouse generally used to help
the organization in analysing and understand complex data in the organization as it used to
provide important information regarding the technology in the market. At the same time it used
to help organization in protecting the complex data in the nation as warehousing used to play a
very crucial role in enhancing the practice of an organization.
Business Intelligence: It is the process in the organization which is generally used by the
organization to convert the raw data into meaningful information. Business intelligence software
in the organization generally help the organization in creating different relevant, important and
3
⊘ This is a preview!⊘
Do you want full access?
Subscribe today to unlock all pages.
Trusted by 1+ million students worldwide
value out of large amount of complex data of an organization. As it is very important for all the
organization to make different decision correctly in the organization, Business intelligence
generally help the manager in the organization to improve the quality of different decision which
are made in an organization. Business intelligence is generally preferred by the firm as it help in
reducing cost and attaining economies if scale for the organization in the long run. There are
many different benefit which is provided by the Business intelligence for the organization to see
a good amount of the growth as well as open up opporurtunity for development, as business
intelligence used to help in identify different error in the process. There are many different type
of the trend in data intelligence trend, data quality management is one of the same as it has been
identified that for carrying out different data intelligence work in the organization machine
learning and artificial learning are two trend which are present and associated with business
intelligence and analysis (Sathiyamoorthi, 2017).
Data mining: Data mining is one of the process in the organization which is used for the
purpose of using raw material and collect important information from the data which has been
collected. It is one of the most prominent way of collecting different information which can be
used by the organization in finding out the solution of the different issue which is being seen by
the individual in the market. It generally help the organization in solving the variety of complex
information very prominently in an organization. There are many different type of the trend
which are prevailing in the Data mining. Some of the trend which are commonly seen in the data
mining are multi media data mining, as it generally collects the raw data from various sources
and present in different numeric form in organization.
For pre-processing and determining the data uses of excel are evaluated.
Excel is generally used in the organization to present the data in more accurate way in the
organization, as with the help of excel organization can record and analysis the different data in
better way to get more accurate outcome of the same. Excel also can help the organization in
understanding the numerical values as this application used to help the organization in
understanding the reason behind decline in sales and profit of different superstore. As a result to
determine the answer of the reason which has been identified this software is generally used in
an organization (Choi, Chan and Yue, 2016).
4
Paraphrase This Document
Need a fresh take? Get an instant paraphrase of this document with our AI Paraphraser
Data clear Process: It is the initial stage where all the data is generally clear by the user in the
organization without any sort of the error. Excel is generally operated in the organization using
various shortcut in organization. Shift + F4 is a short cut key which is used to determine the
value in the short time. This is a example there are many other short cut just like this which is
also used by the organization to carry out different function in an organization. Another example
is the SUM, it is the formula which is generally used for adding up all the activity together.
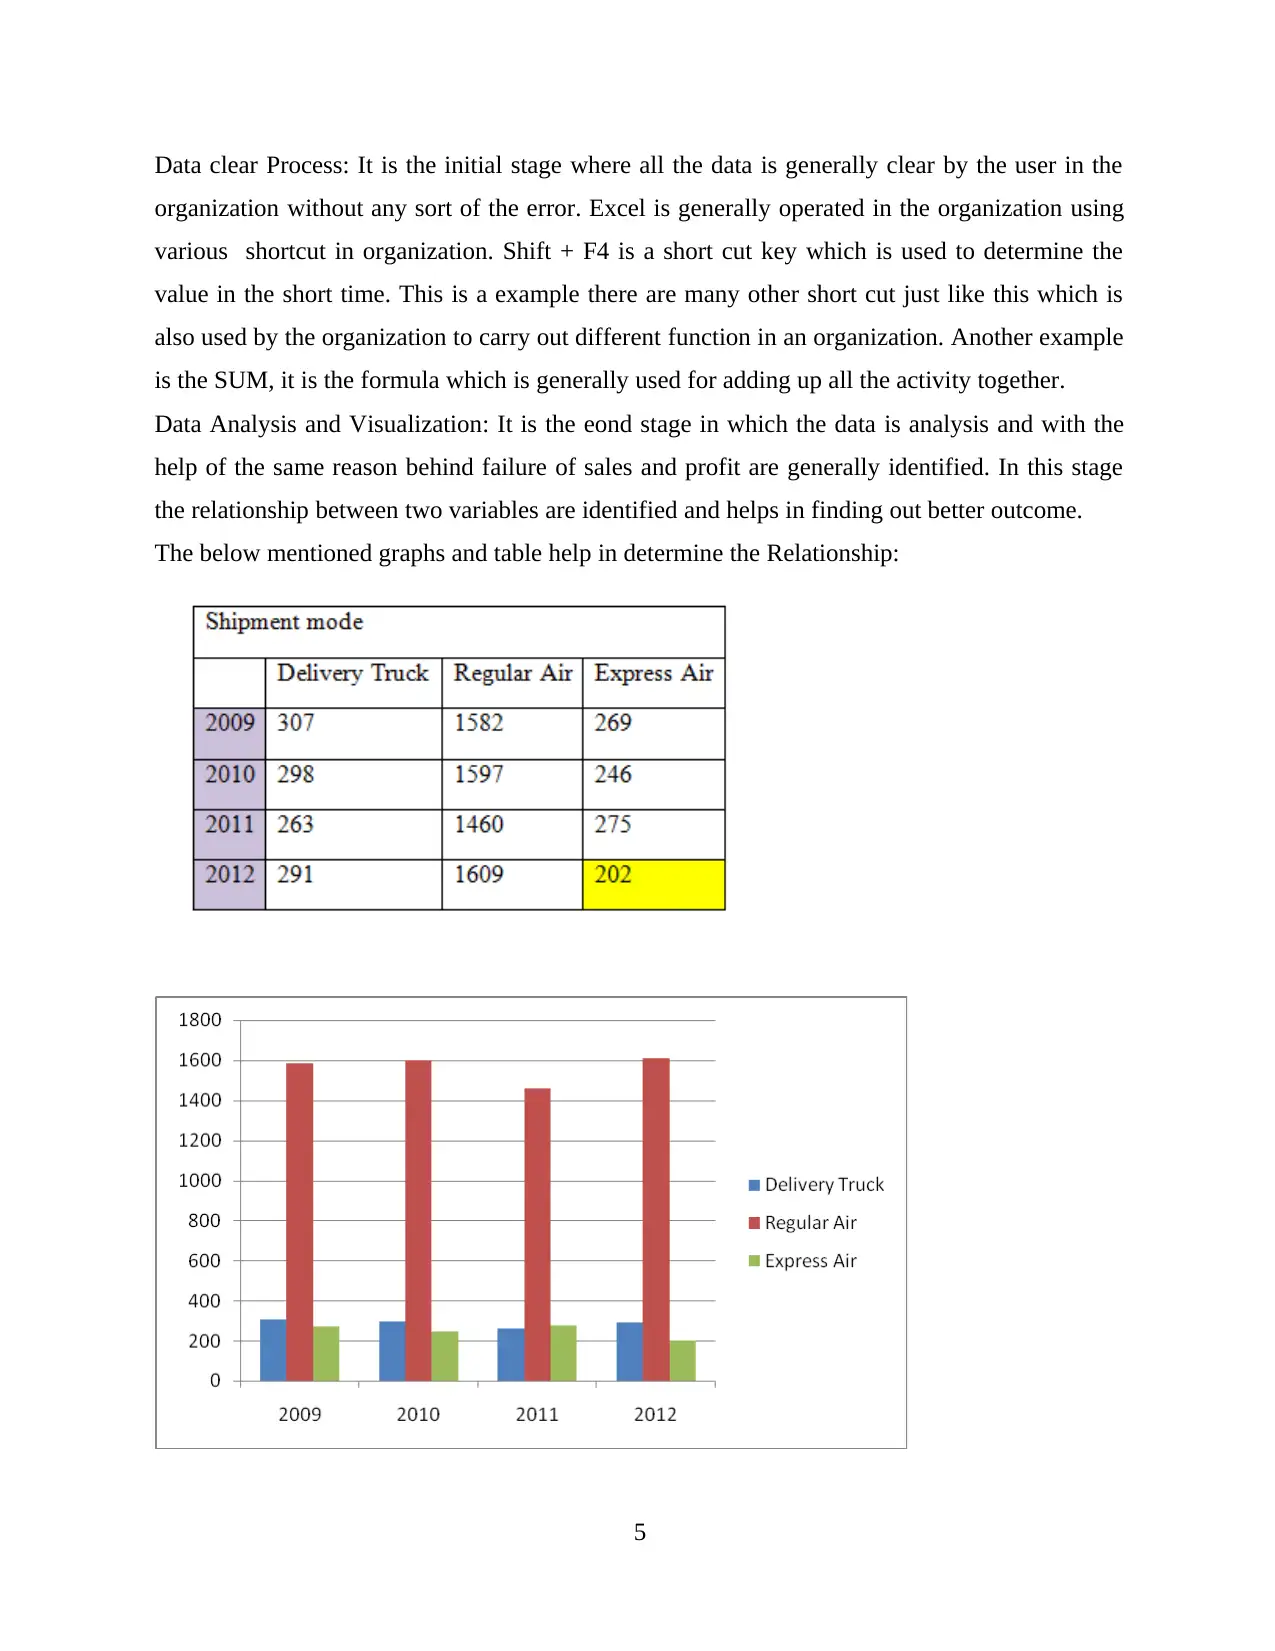
Data Analysis and Visualization: It is the eond stage in which the data is analysis and with the
help of the same reason behind failure of sales and profit are generally identified. In this stage
the relationship between two variables are identified and helps in finding out better outcome.
The below mentioned graphs and table help in determine the Relationship:
5
organization without any sort of the error. Excel is generally operated in the organization using
various shortcut in organization. Shift + F4 is a short cut key which is used to determine the
value in the short time. This is a example there are many other short cut just like this which is
also used by the organization to carry out different function in an organization. Another example
is the SUM, it is the formula which is generally used for adding up all the activity together.
Data Analysis and Visualization: It is the eond stage in which the data is analysis and with the
help of the same reason behind failure of sales and profit are generally identified. In this stage
the relationship between two variables are identified and helps in finding out better outcome.
The below mentioned graphs and table help in determine the Relationship:
5
Interpretation: After going to the above data it has been identified that variety of shipment have
been used by company to deliver company product at market. There was rapid change in the
method of shipment as ships were used in year 2009 in place of trucks which were used at the
initial stage of the company. In year 2012 number of ships has also been decreased from 307 to
219 (Kimble, and Milolidakis, 2015). In long term profit of the company and its sales has also
effected by this. From the above data it has been interpreted that air transport is best among all
three shipments method. In 2012 with decrease in number of ship it has also identified that there
was increase in number of air ships from 1582 to 1609. This has a positive impact on the sales
and profit of the company.
6
⊘ This is a preview!⊘
Do you want full access?
Subscribe today to unlock all pages.
Trusted by 1+ million students worldwide
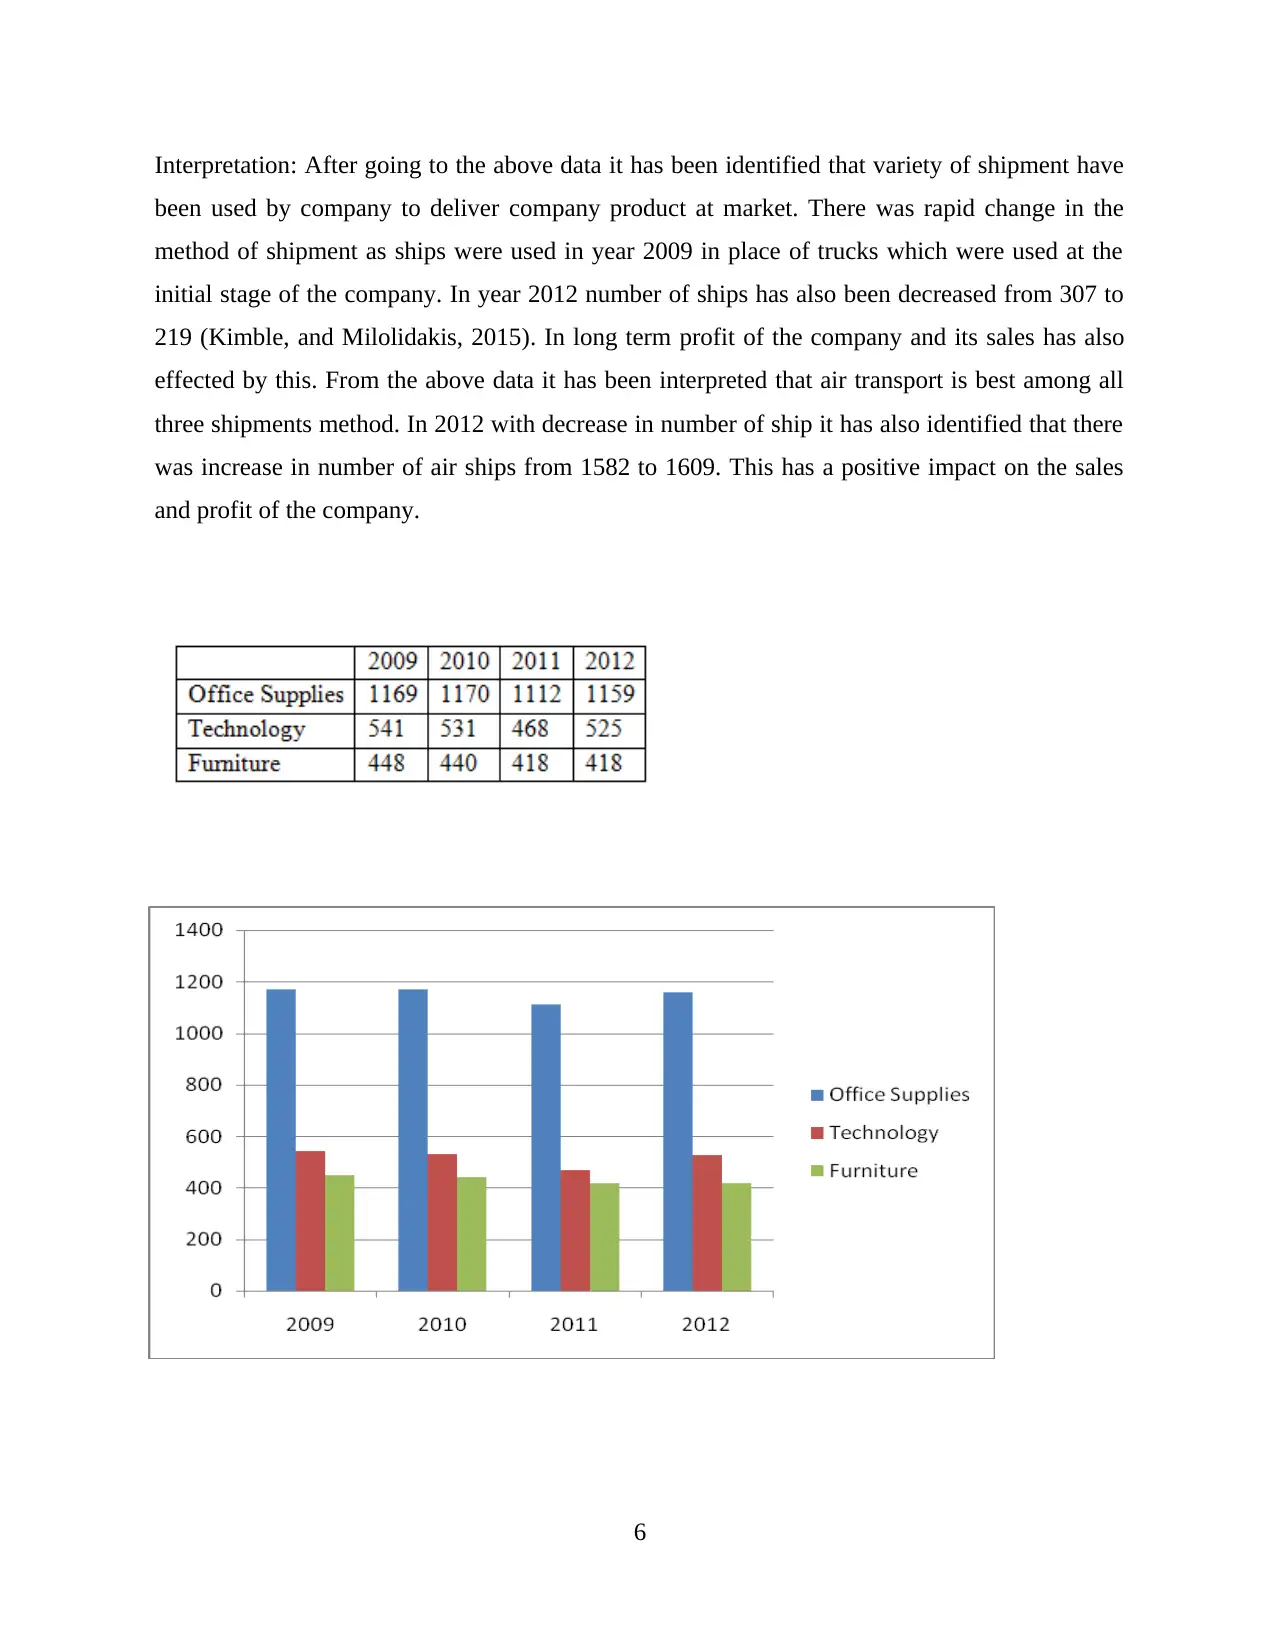
After analysis the above data it has been identified that there is increase in the sales of office
appliances. There are 2 other businesses which do not show rapid growth. For rapid increase in
the business Air shipments has been identified as best method both in present and past situations.
Furniture sectors which do not use any shipment mode do not show any growth of the business.
There are constant sales in furniture sector. It helps in understanding that a positive relationship
prevail between sales and profit and different variables of the business.
PART 2
2.1 Providing the conjunction with Weka through an example
Weka is also known as Environment for Knowledge Analysis, this was consider to be one of the
most important tool which was used by the organization for the purpose of effectively analysis
of various statistical function which is mainly related to the descriptive and clustering. This
refers to the machine learning algorithm. This is much better than excel as it is one of the most
prominent tool which used to help in solving the variety of real life issue in regards to the issue
which is linked with the data mining in the organization. In that also clustering is one of the
most prominent measures which is useful in grouping the set of the data into the specific classes
in accordance to the features. Weka tool also being appropriately used in analyzing the Audi
Leadership.
7
Paraphrase This Document
Need a fresh take? Get an instant paraphrase of this document with our AI Paraphraser
8
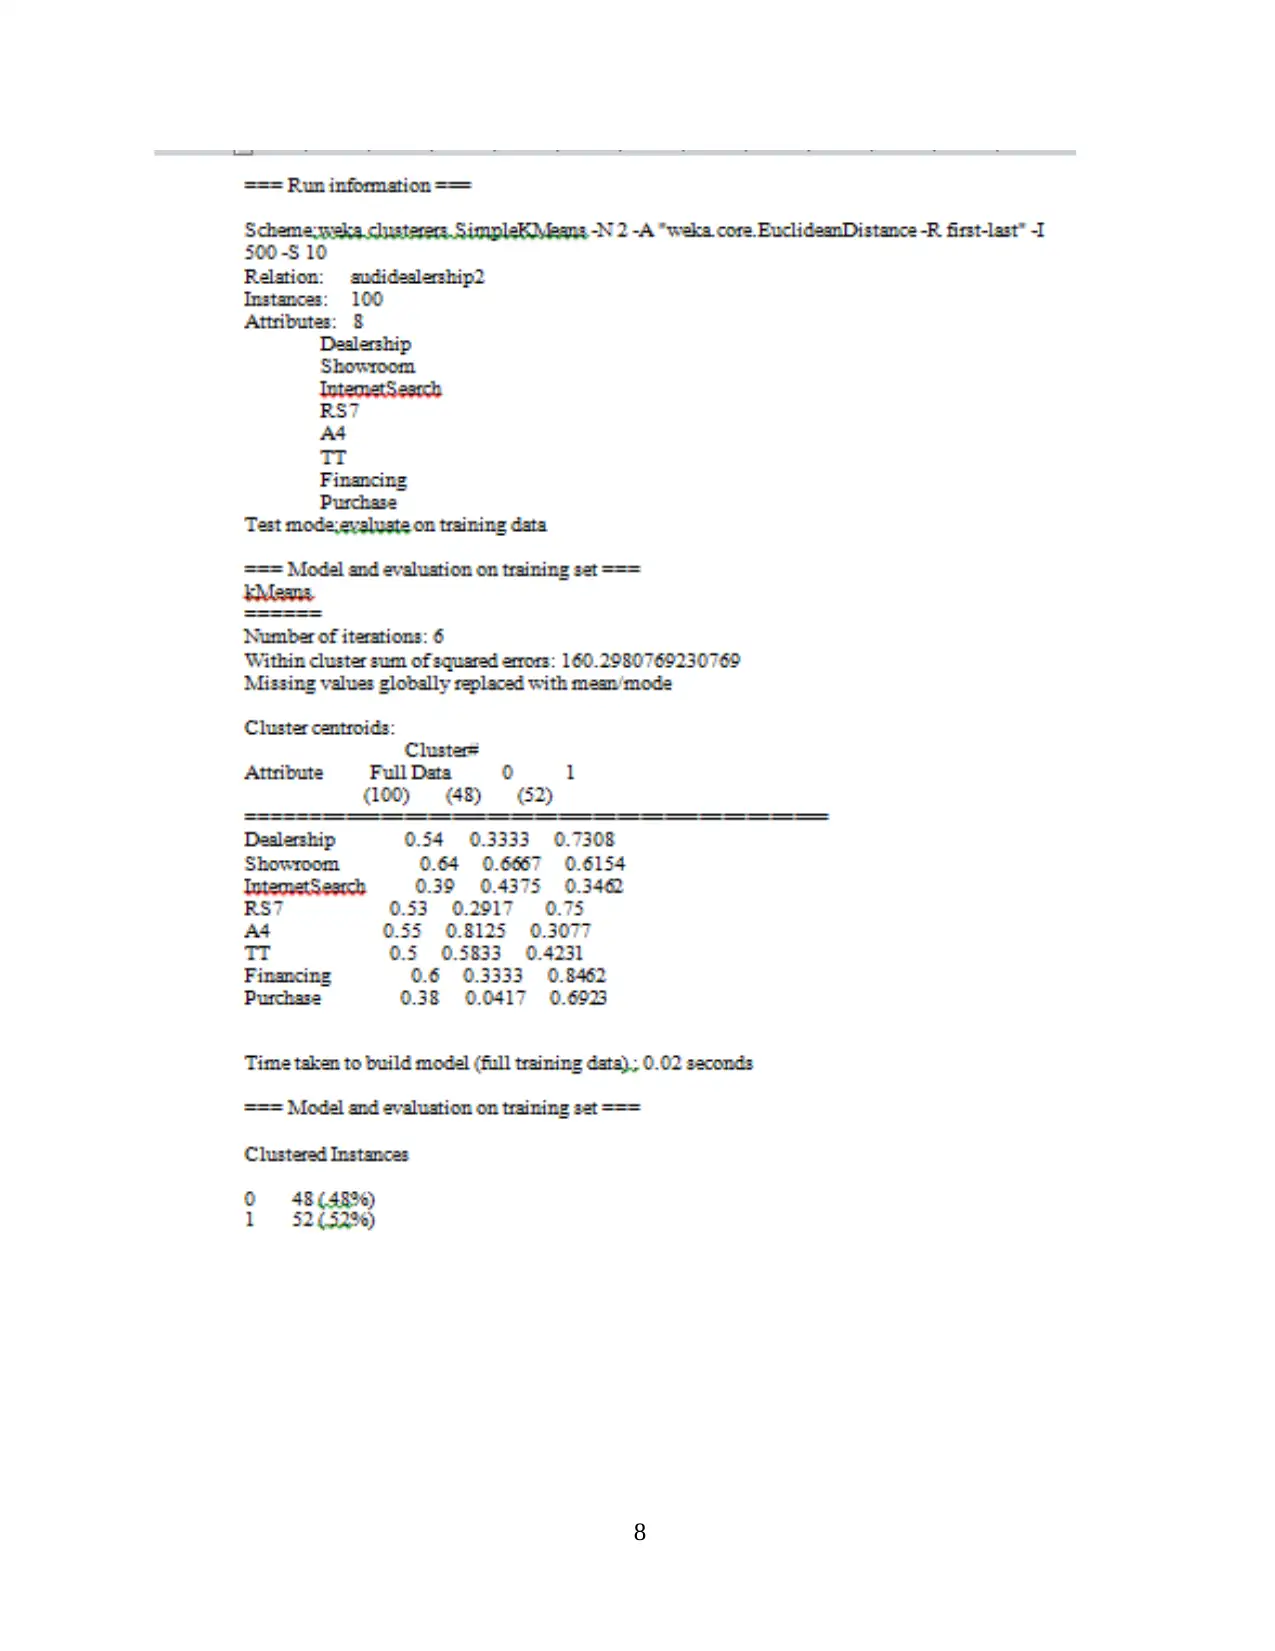
Interpretation: after going through above data it has been examined that almost 100 people were
interested in taking Audi dealership. 0 and 1 are two variables which have been used for Audi
dealership. When samples are processed further then variable 1 is used while variable 0 is used
when sample are not processed further. As per the above data it has been analyzed that variable
0 has 48%of samples while variable 1 has 52% of samples. It has also observed that number of
respondents who are preferred to select audi dealership are 54 where as 48% of respondents
prefer to go to showrooms and take decisions after reaching showrooms only. It have also
identified that from the total respondents more percentages of respondents prefer to buy it from
showrooms as compare to internet. 64% of respondents are preferred showrooms where only
39% people prefer internet (Moro, Cortez, and Rita, 2015). For analysis data and interpret the
data weka tool have been proved best as it help in identified the exact answer from the complex
set of data. To identify how people prefer to choose Audi dealership weka is the tool which can
apply within the current situation.
2.2 Explain the most common methods associated with data mining which are used by the
organization.
Data mining is the process which is useful in using the variety of the data which help them in
building the information which is useful for the organization/ This process is also known as one
of the effective process which is used to evaluate complex set of the data in an organization.
Data mining is one of the most prominent approaches as it used to reduce the various error in the
market. Also it help in evaluating different sort of trend in the organization and making different
decision in an organization. Some of the common data mining tool which are used by the
organization are as follows:
Classification: Classification is known as one of the most complex data mining technique
because it forces the different individual in collection of various elements and attributes which
help in describing different categories. This also provides very crucial support to the
management in drawing conclusive set of result and serving special attributes of event in
particular.
Tracking pattern: It is another important mining tool, this generally used to help the
management in effective decision making procedure by analysing different pattern within data
sets. Tracking pattern feature generally help the organization in tracking to different trend
related to the sales data set in organization (Park, El Sawy and Fiss, 2017).
9
⊘ This is a preview!⊘
Do you want full access?
Subscribe today to unlock all pages.
Trusted by 1+ million students worldwide
Prediction: This is the type of the data mining tool which used to help in protecting the
different type of data which can be used by the organization in the future context. This tool is
well known for considering variety of different historical trend in order to gain a accurate
prediction associated with relevant data set. For example, this mining technique is well known
for understanding and reviewing the credit history of different customer in an organization.
Regression: Regression is one of the most prominent data mining tool which can be used
by the organization for the purpose of planning and modelling variety of the data in the
organization. This tool in the organization is generally linked with the formulation of key nature
of relationship which is in the end linked with the data set and different variable. This tool is
consider to be straightforward tool as it used to help in clearly revealing variety of key variable
which are highly associated with each other in the organization.
Outlier detection: It is another important measure as it used to help the organization in
determining effective overarching patters, which help them in giving the clear idea and
understanding associated with the set of the data collected in the organization.
2.3 Critically evaluating the advantages and disadvantages of Weka over Excel.
Weka is also known as Environment for Knowledge Analysis. This tool generally help the
organization in analysisng the different data very proficiently in the organization, this eventually
associated with the descriptive and clustering of different data. Clustering is one of the most
important measure which is used for grouping the variety of the data into the specific classes in
accordance to different feature. Weka is consider as one of the effective approach in exploring
and analyzing the various set of the data related to specific subject matter in an organization. It
tend to contain different set of the tool for the purpose of visualization and pre data processing in
the organization (Bahrami, and Singhal, 2015).
Advantage of Weka tool
Weka tool is very important for the business to interpret variety of different set of the
data in the organization. It also helps the organization in systematically evaluating the complex
and large set of data in the organization. Also Weka is very important in the organization, as it
used to focuses on carrying out the large set of the data in the organization in a appropriate
manner. Not only that the fact that it used to come up with the GUI in the organization it leads
10
Paraphrase This Document
Need a fresh take? Get an instant paraphrase of this document with our AI Paraphraser
to more easy and convenient way to access the large set of the data in the organization. Another
fact of usefulness is that it used to come up with the JAVA programming language. As a result it
used to increase the efficiency of tool as JAVA is also having good sort of the name in the field
of collecting the different data in the organization. Another benefit which is brought by the
Weka tool in the organization is that this tool is well known for comprehensive collection of
specific data with the help of pre processing method.
Disadvantage of Weka tool
One of the biggest disadvantages of Weka tool is that this function is not that smooth
functioning in an organization. As there is no automated function in Weka tool as almost all the
function in the organization should and require to be carried out by the labour in the
organization. Also there is high degree of probability of occurring error in the organization in
related to the memory. As Weka tool in the organization only can handle the small set of data in
the organization. At the same time any increase in the data set in the organization used to
increase the number of the bug in the organization very rapidly (Park, El Sawy and Fiss, 2017)..
CONCLUSION
After going through the above report it has been concluded that Data handling in the
organization used to help the organization in managing the different complex data very easily in
the organization. After that the report goes on to summarized that there are many different
benefits or usage of Excel in the organization. After that the report summarized that there are
many different benefit of using of Weka tool in the organization as compare to Excel in the
organization. Report also summarized different sort of disadvantage of the same in the
organization as well.
11
REFERENCES
Books and Journals
Alpar, P. and Schulz, M., 2016. Self-service business intelligence. Business & Information
Systems Engineering, 58(2), pp.151-155.
Bahrami, M. and Singhal, M., 2015. The role of cloud computing architecture in big data.
In Information granularity, big data, and computational intelligence (pp. 275-295).
Springer, Cham.
Choi, T.M., Chan, H.K. and Yue, X., 2016. Recent development in big data analytics for
business operations and risk management. IEEE transactions on cybernetics, 47(1),
pp.81-92.
Gallinucci, E., Golfarelli, M. and Rizzi, S., 2015. Advanced topic modeling for social business
intelligence. Information Systems, 53, pp.87-106.
Kimble, C. and Milolidakis, G., 2015. Big data and business intelligence: Debunking the
myths. Global Business and Organizational Excellence, 35(1), pp.23-34.
Martínez-Rojas, M., Marín, N. and Vila, M.A., 2016. The role of information technologies to
address data handling in construction project management. Journal of Computing in
Civil Engineering, 30(4), p.04015064.
Moro, S., Cortez, P. and Rita, P., 2015. Business intelligence in banking: A literature analysis
from 2002 to 2013 using text mining and latent Dirichlet allocation. Expert Systems with
Applications, 42(3), pp.1314-1324.
Obeidat, M and et.al., 2015. Business intelligence technology, applications, and trends.
Park, Y., El Sawy, O.A. and Fiss, P., 2017. The role of business intelligence and communication
technologies in organizational agility: a configurational approach. Journal of the
association for information systems, 18(9), p.1.
Larson, D. and Chang, V., 2016. A review and future direction of agile, business intelligence,
analytics and data science.International Journal of Information Management. 36(5).
pp.700-710.
Vanani, I. R. and Jalali, S. M. J., 2017. Analytical evaluation of emerging scientific trends in
business intelligence through the utilisation of burst detection algorithm. International
Journal of Bibliometrics in Business and Management. 1(1). pp.70-79.
12
⊘ This is a preview!⊘
Do you want full access?
Subscribe today to unlock all pages.
Trusted by 1+ million students worldwide
1 out of 13
Related Documents


Your All-in-One AI-Powered Toolkit for Academic Success.
+13062052269
info@desklib.com
Available 24*7 on WhatsApp / Email
![[object Object]](/_next/static/media/star-bottom.7253800d.svg)
Unlock your academic potential
Copyright © 2020–2026 A2Z Services. All Rights Reserved. Developed and managed by ZUCOL.