Data Wrangling Assignment: Data Acquisition, Filtering, and Analysis

Verified

Added on  2020/05/16

|6
|748
|56
Homework Assignment
AI Summary
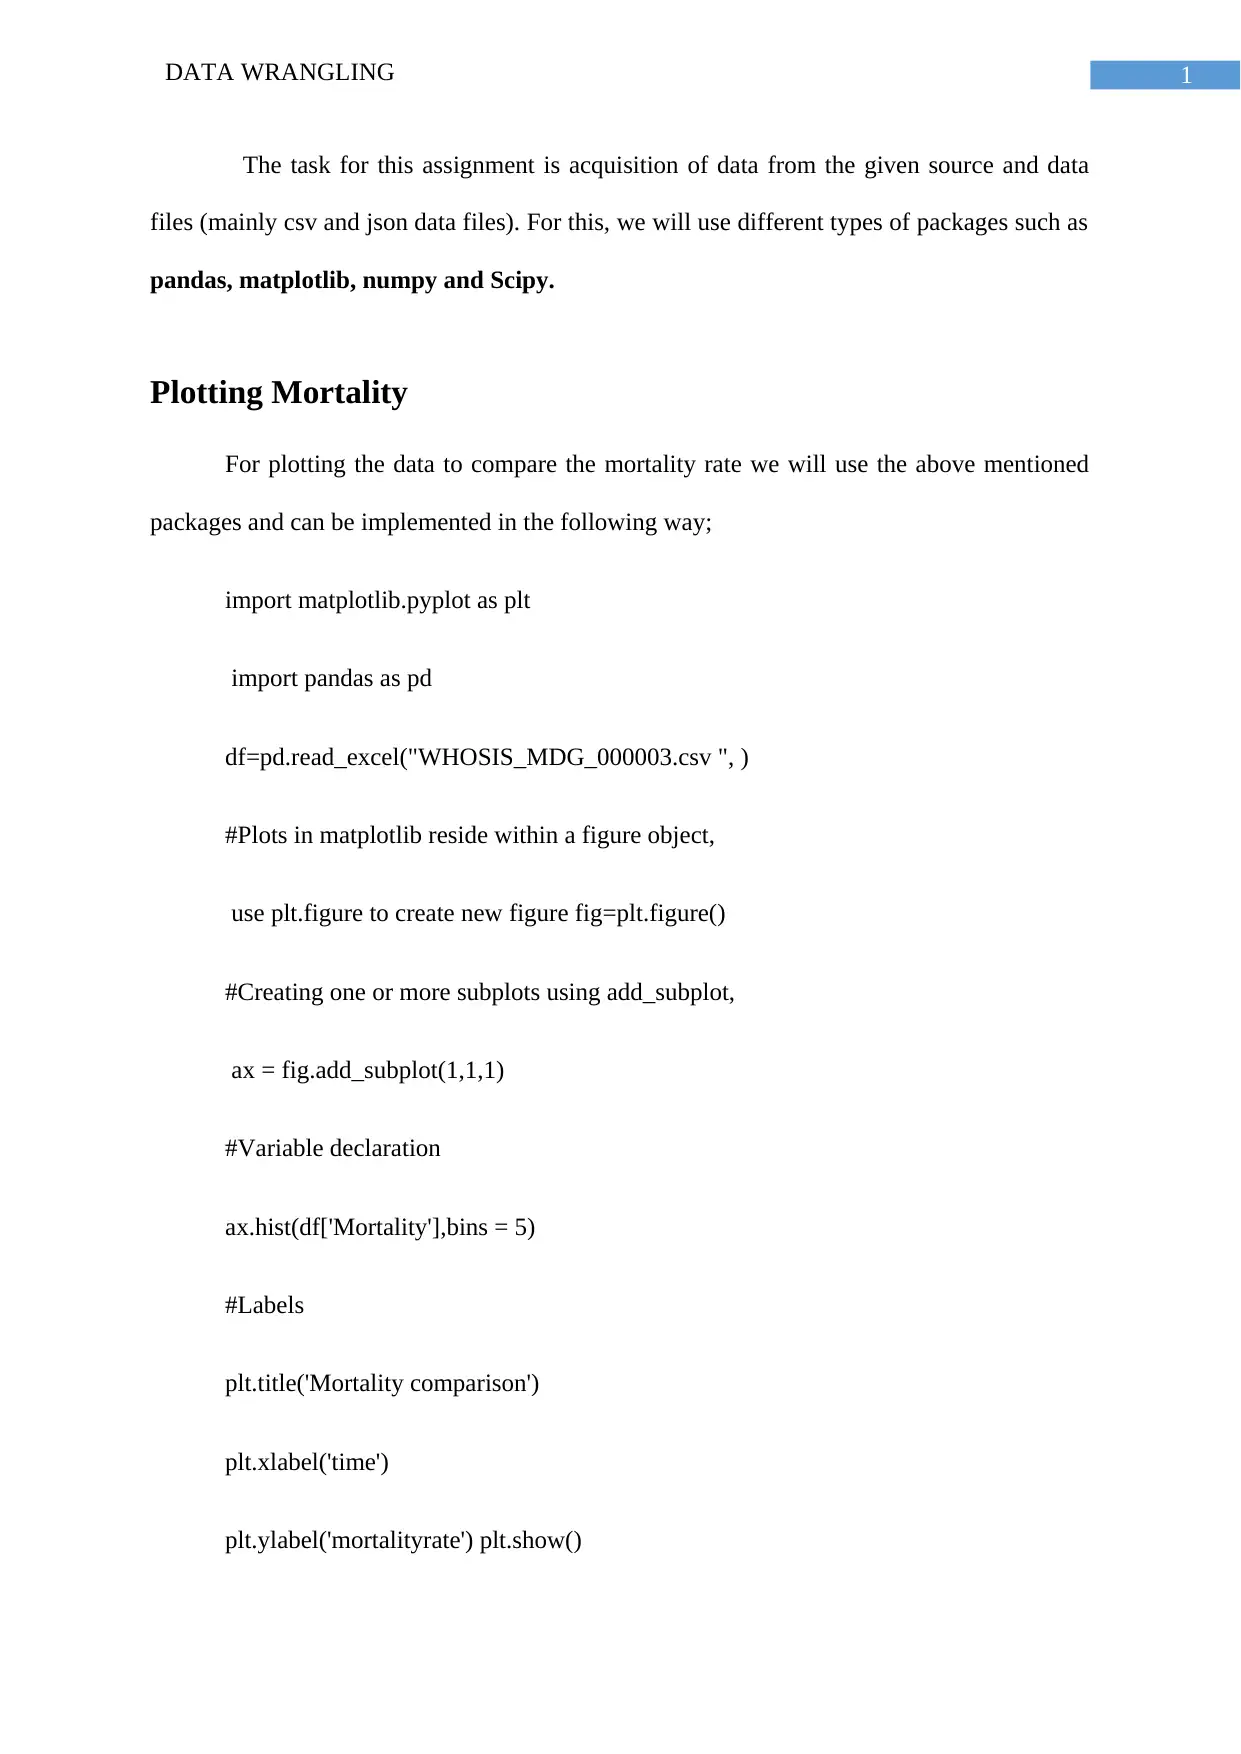
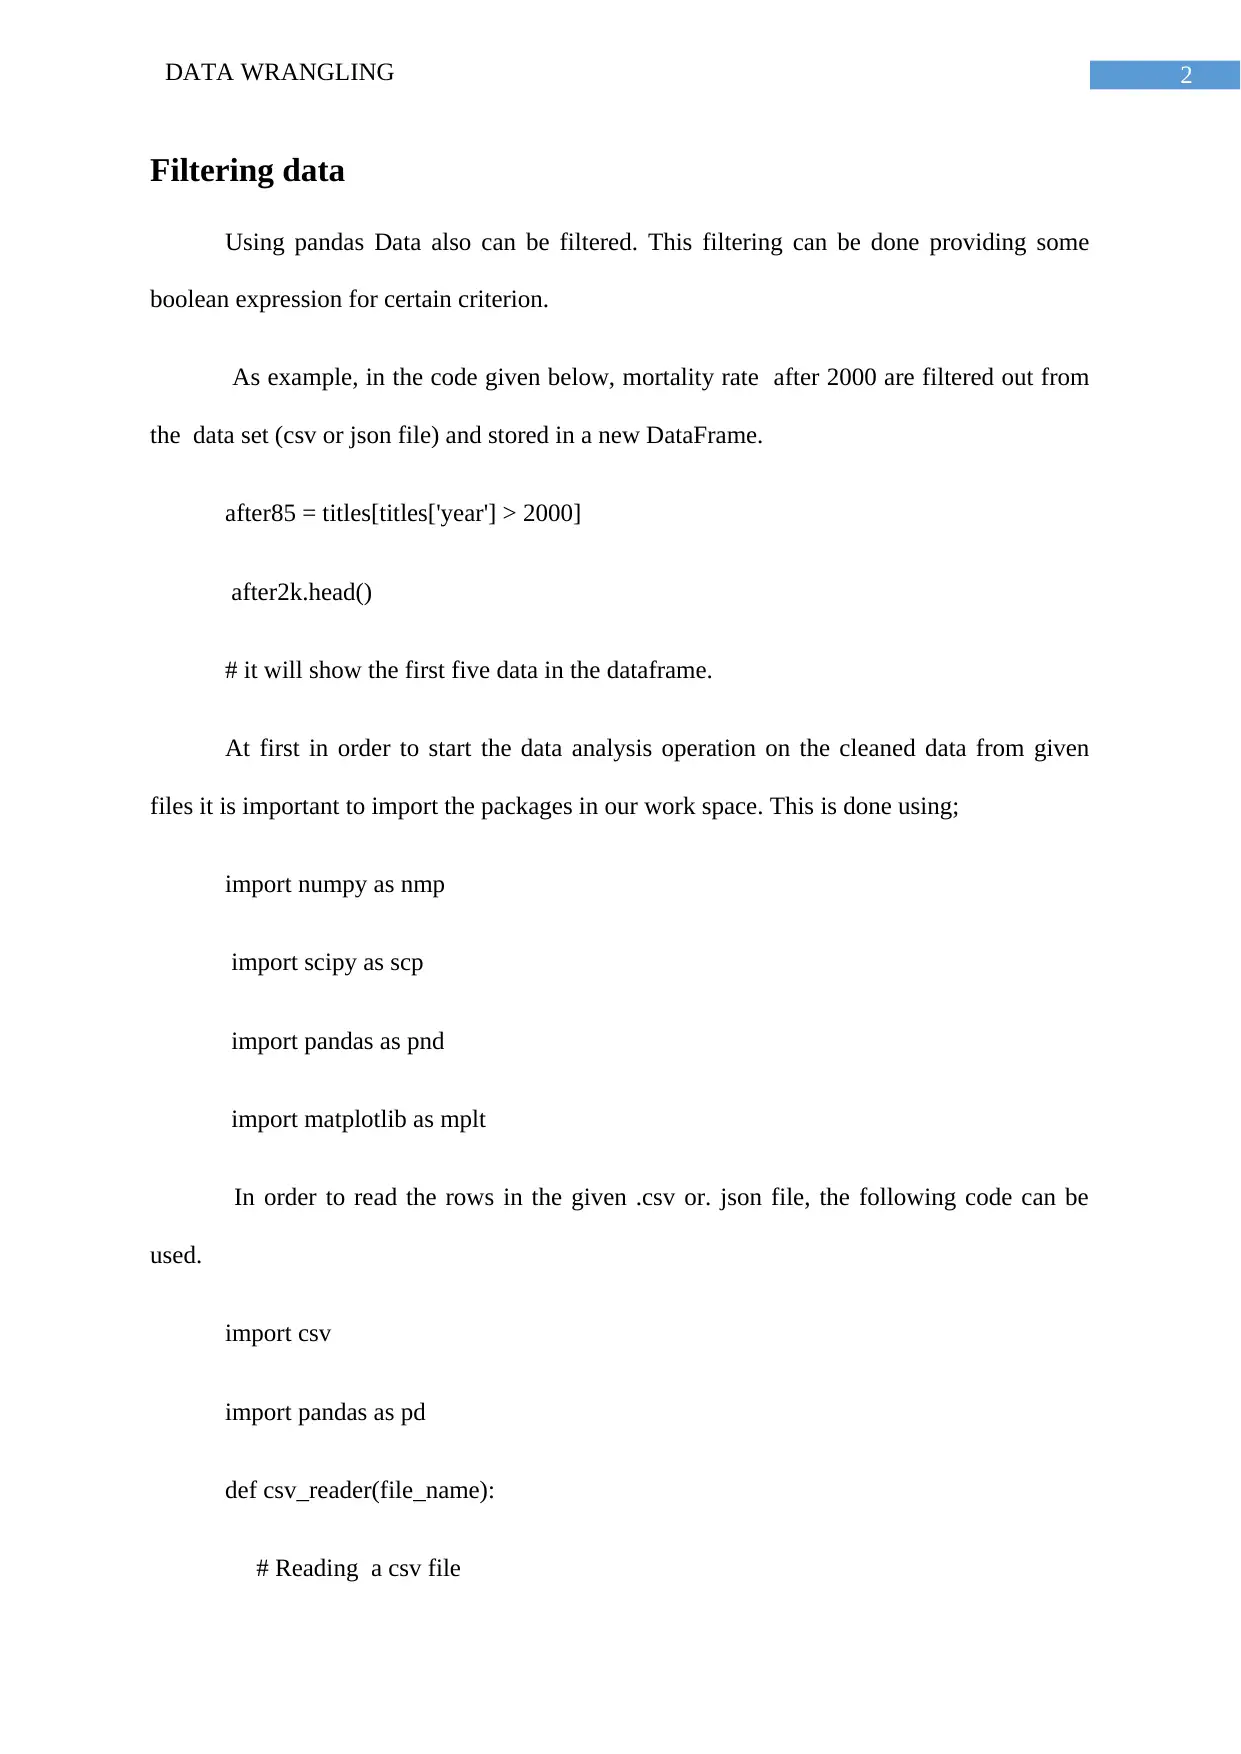
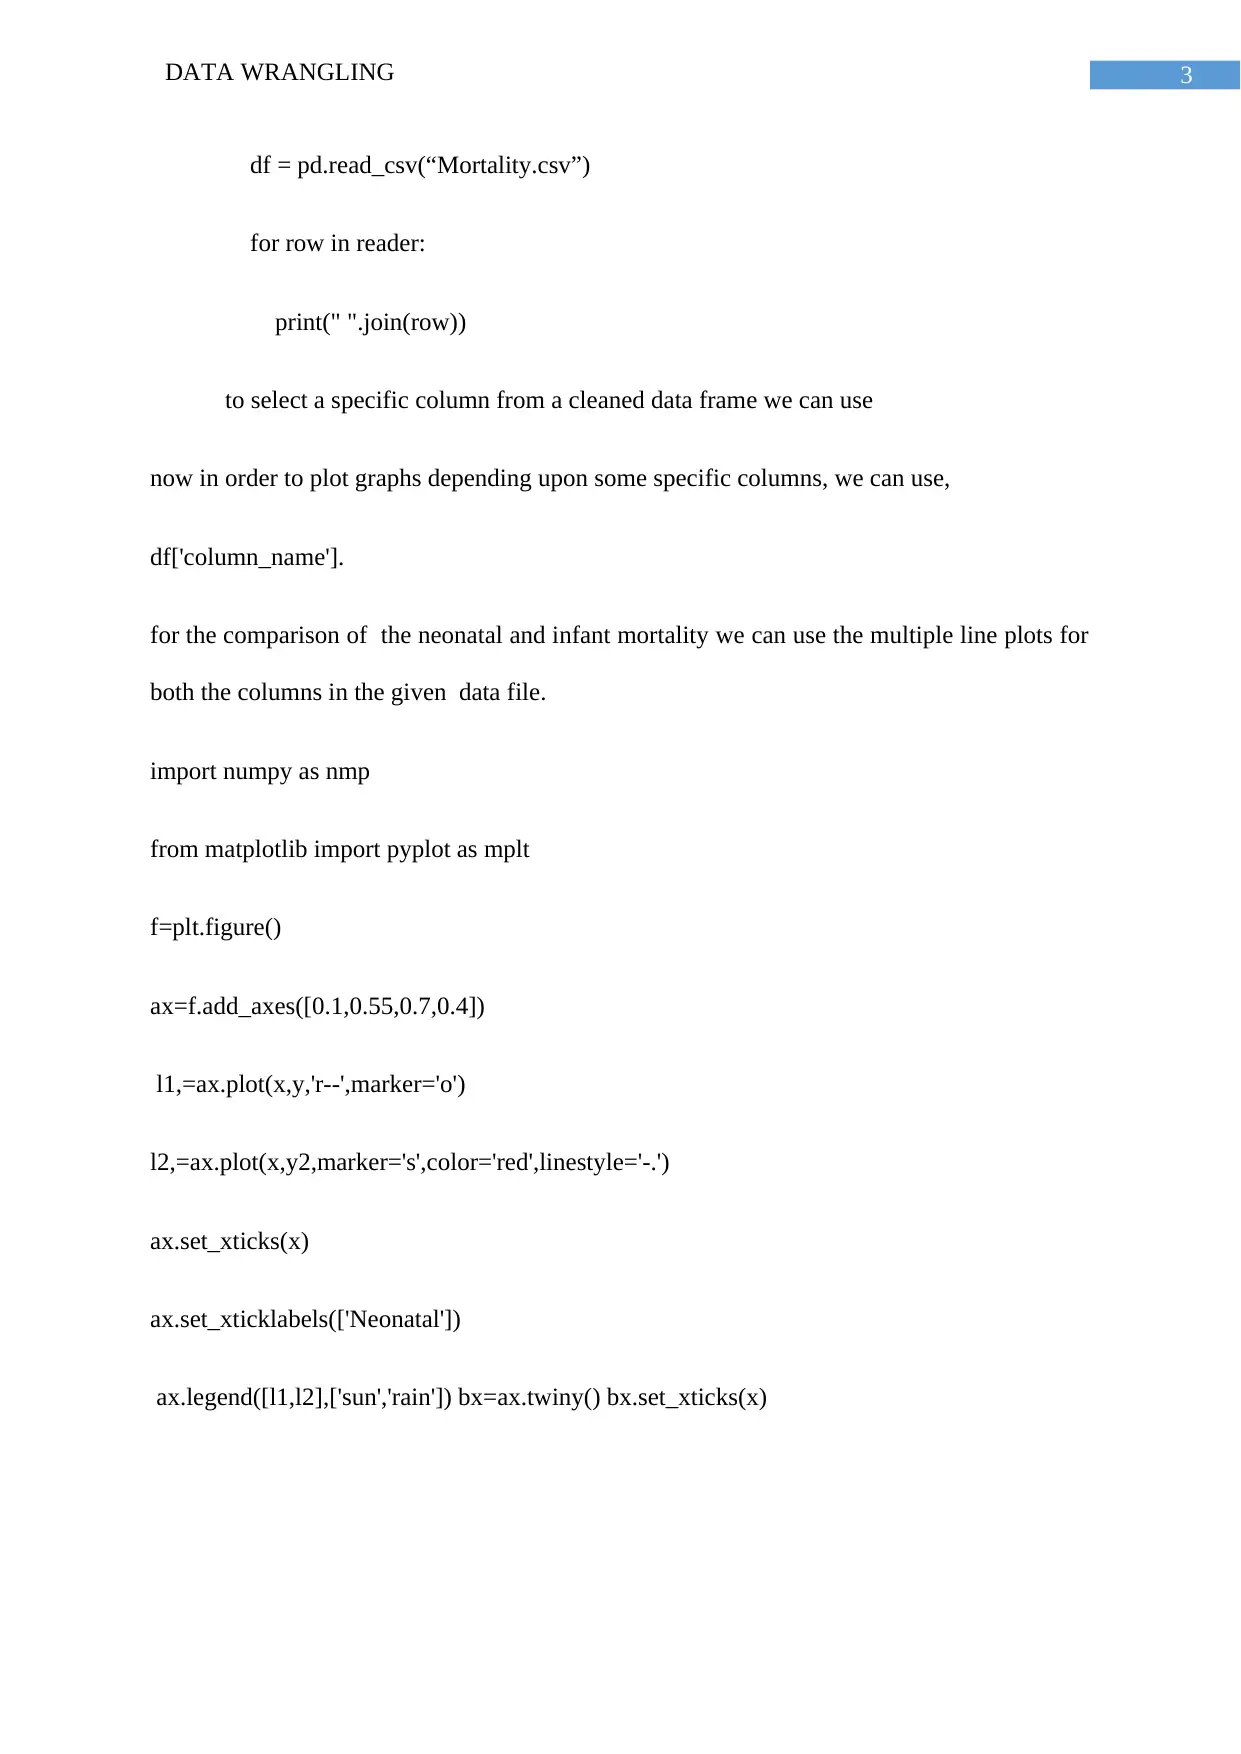
This data wrangling assignment focuses on acquiring and manipulating data from CSV and JSON files using Python libraries such as pandas, matplotlib, numpy, and scipy. The solution demonstrates how to plot mortality rates, filter data based on specific criteria (e.g., years after 2000), and perform data analysis. It includes code snippets for reading data from files, plotting histograms, creating multiple line plots for comparing neonatal and infant mortality, and grouping data based on 'WORLD_BANK_INCOME_GROUP' for calculating mean values and statistical distribution. The assignment emphasizes the use of Python for data cleaning, analysis, and visualization, providing a practical approach to data wrangling tasks. The student uses various functions and methods to read and process data, select specific columns, and generate plots for data comparison. The assignment concludes with a bibliography of relevant resources.
Document Page
Running head: DATA WRANGLING
Data wrangling
Name of the Student
Name of the University
Authors note
tabler-icon-diamond-filled.svg

Paraphrase This Document

Need a fresh take? Get an instant paraphrase of this document with our AI Paraphraser
Document Page
1DATA WRANGLING
The task for this assignment is acquisition of data from the given source and data
files (mainly csv and json data files). For this, we will use different types of packages such as
pandas, matplotlib, numpy and Scipy.
Plotting Mortality
For plotting the data to compare the mortality rate we will use the above mentioned
packages and can be implemented in the following way;
import matplotlib.pyplot as plt
import pandas as pd
df=pd.read_excel("WHOSIS_MDG_000003.csv ", )
#Plots in matplotlib reside within a figure object,
use plt.figure to create new figure fig=plt.figure()
#Creating one or more subplots using add_subplot,
ax = fig.add_subplot(1,1,1)
#Variable declaration
ax.hist(df['Mortality'],bins = 5)
#Labels
plt.title('Mortality comparison')
plt.xlabel('time')
plt.ylabel('mortalityrate') plt.show()
Document Page
2DATA WRANGLING
Filtering data
Using pandas Data also can be filtered. This filtering can be done providing some
boolean expression for certain criterion.
As example, in the code given below, mortality rate after 2000 are filtered out from
the data set (csv or json file) and stored in a new DataFrame.
after85 = titles[titles['year'] > 2000]
after2k.head()
# it will show the first five data in the dataframe.
At first in order to start the data analysis operation on the cleaned data from given
files it is important to import the packages in our work space. This is done using;
import numpy as nmp
import scipy as scp
import pandas as pnd
import matplotlib as mplt
In order to read the rows in the given .csv or. json file, the following code can be
used.
import csv
import pandas as pd
def csv_reader(file_name):
# Reading a csv file
Document Page
3DATA WRANGLING
df = pd.read_csv(“Mortality.csv”)
for row in reader:
print(" ".join(row))
to select a specific column from a cleaned data frame we can use
now in order to plot graphs depending upon some specific columns, we can use,
df['column_name'].
for the comparison of the neonatal and infant mortality we can use the multiple line plots for
both the columns in the given data file.
import numpy as nmp
from matplotlib import pyplot as mplt
f=plt.figure()
ax=f.add_axes([0.1,0.55,0.7,0.4])
l1,=ax.plot(x,y,'r--',marker='o')
l2,=ax.plot(x,y2,marker='s',color='red',linestyle='-.')
ax.set_xticks(x)
ax.set_xticklabels(['Neonatal'])
ax.legend([l1,l2],['sun','rain']) bx=ax.twiny() bx.set_xticks(x)
tabler-icon-diamond-filled.svg

Paraphrase This Document

Need a fresh take? Get an instant paraphrase of this document with our AI Paraphraser
Document Page
4DATA WRANGLING
For 'WORLD_BANK_INCOME_GROUP’ we can split the given data set into multiple
groups based on the given criteria
df_incm = df.groupby([‘Income_Group’])
for calculating the mean value, we can use
df_incm.mean().
With the following codes, it is possible to find out the different income groups and
statistical distribution,
def pq(I, beta, sigma):
a = 1. / (sigma * np.sqrt(2. * np.pi))
return a * np.exp(b * (I - beta) ** 2)
I =np.linspace(-5,8, 8)
plt.plot(I, pq(I, 0., 1.), color = 'k', linestyle ='solid')
plt.plot(I, pq(I, 0., .25), color = 'k', linestyle ='dashdot')
Document Page
5DATA WRANGLING
Bibliography
McKinney, W., 2012. Python for data analysis: Data wrangling with Pandas, NumPy, and
IPython. " O'Reilly Media, Inc.".
Kazil, J. and Jarmul, K., 2016. Data wrangling with Python: tips and tools to make your life
easier. " O'Reilly Media, Inc.".
Nelli, F., 2015. Python Data Analytics.
chevron_up_icon
1 out of 6
circle_padding
hide_on_mobile
zoom_out_icon
[object Object]