BUS5IAF Introduction to Accounting & Finance: Data3 Limited Analysis

Verified

Added on  2020/02/19

|21
|3837
|145
Report
AI Summary
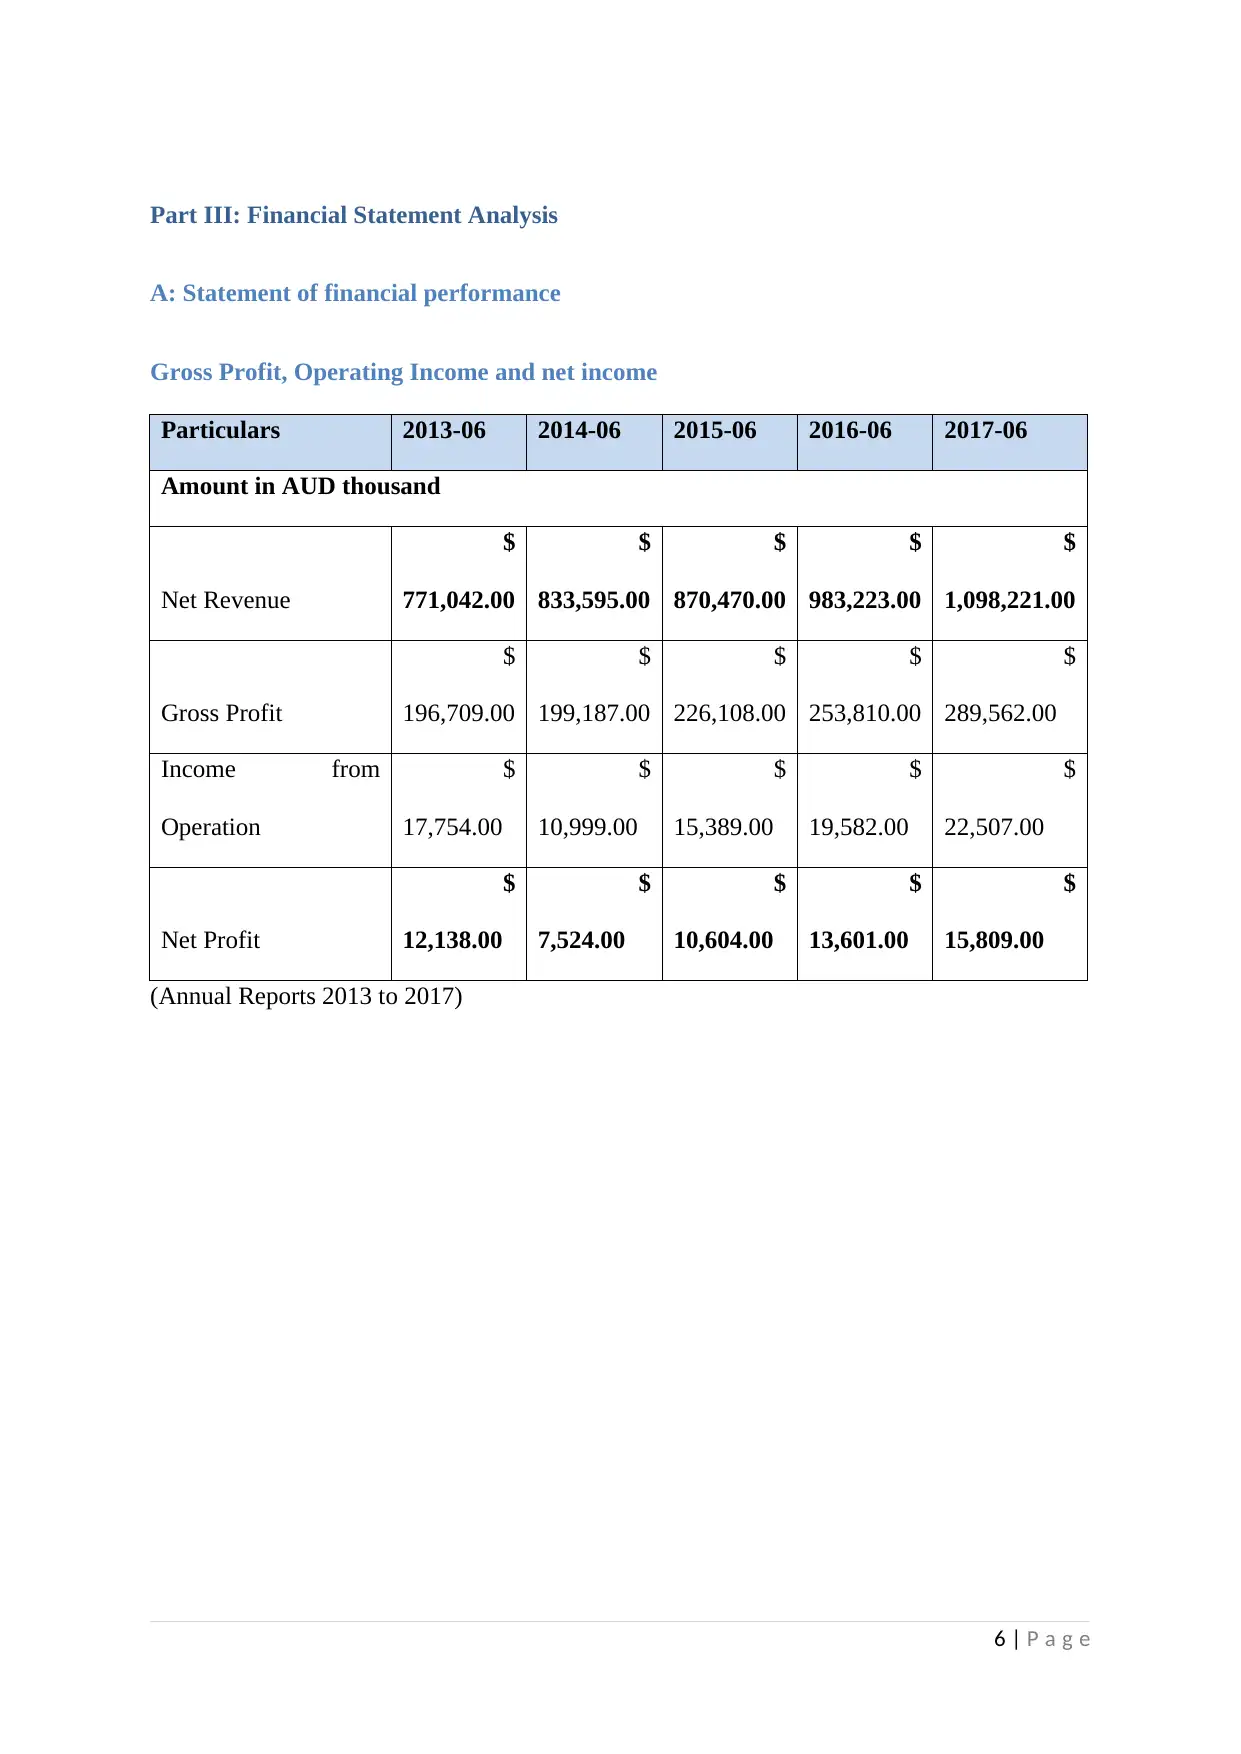
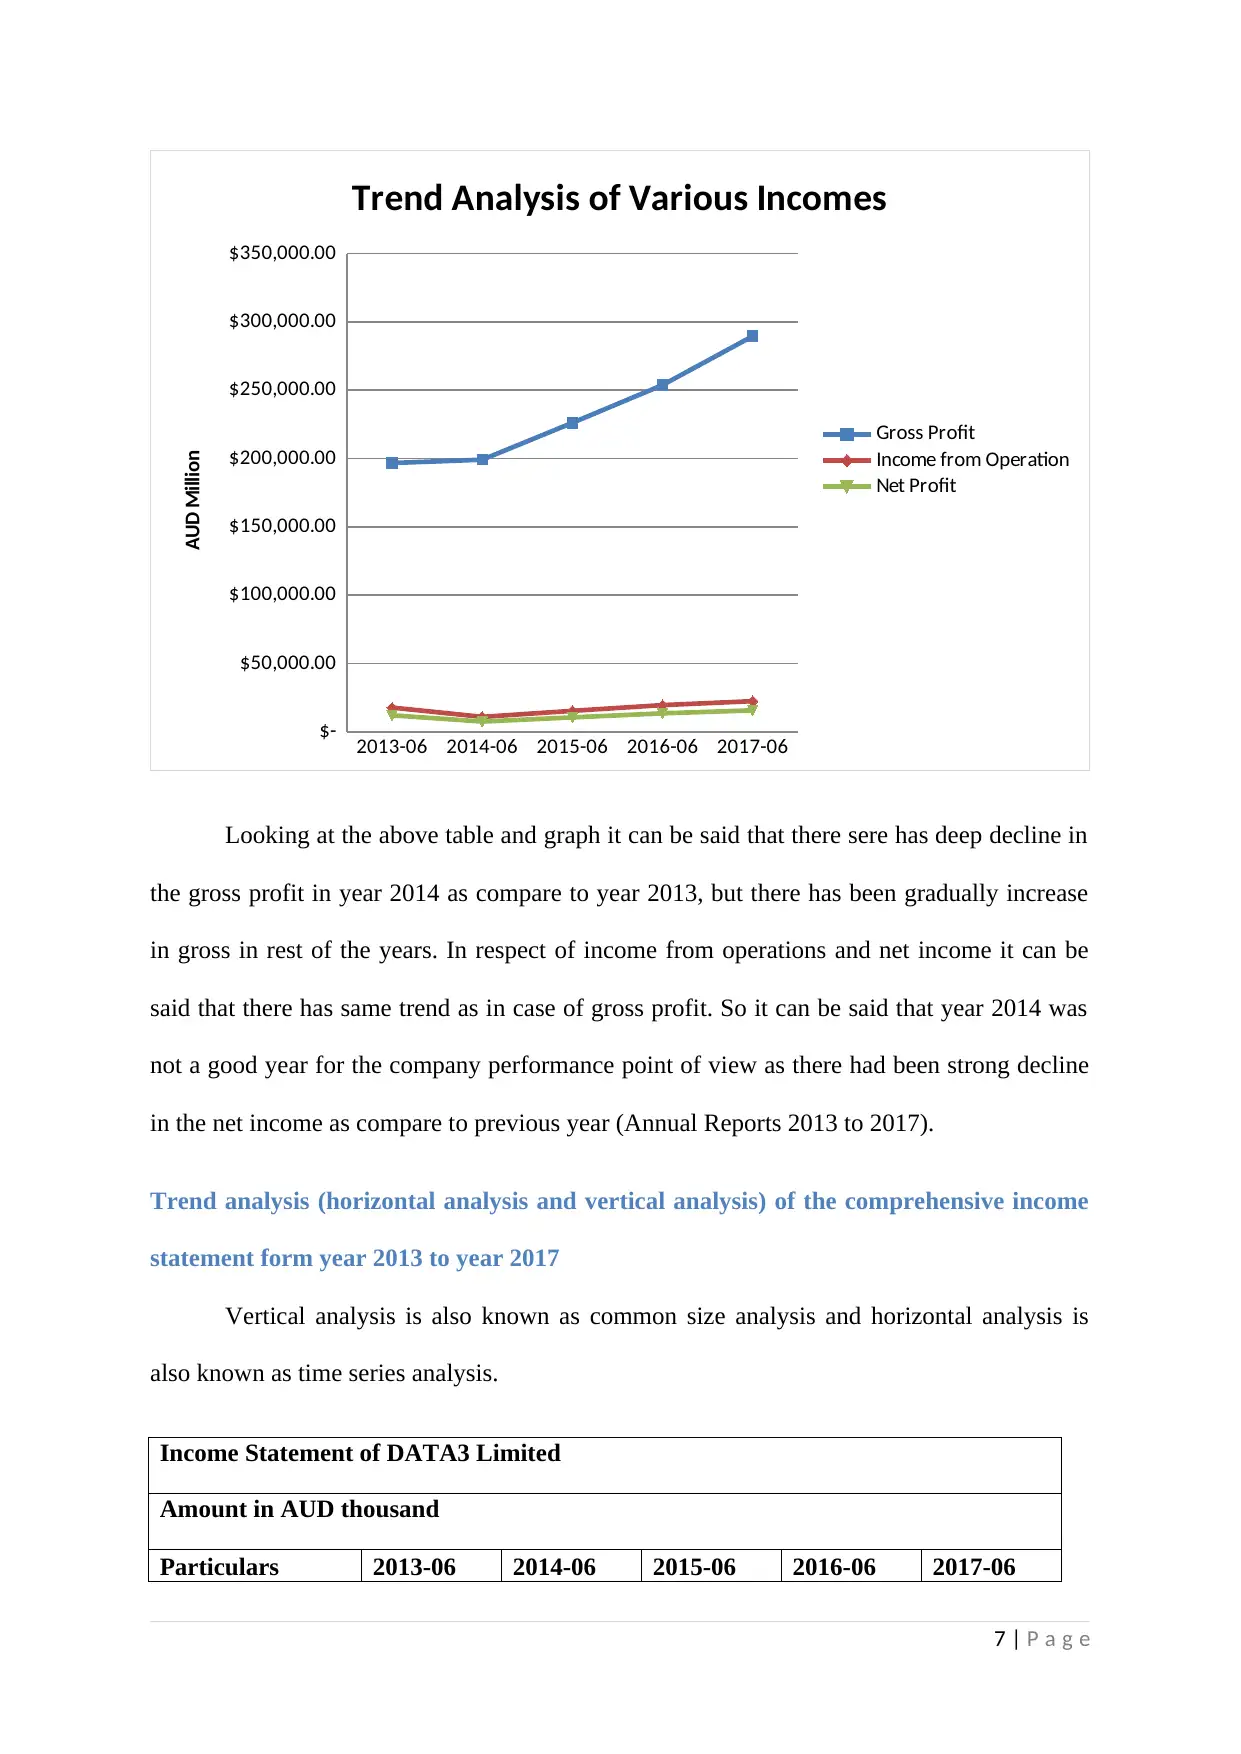
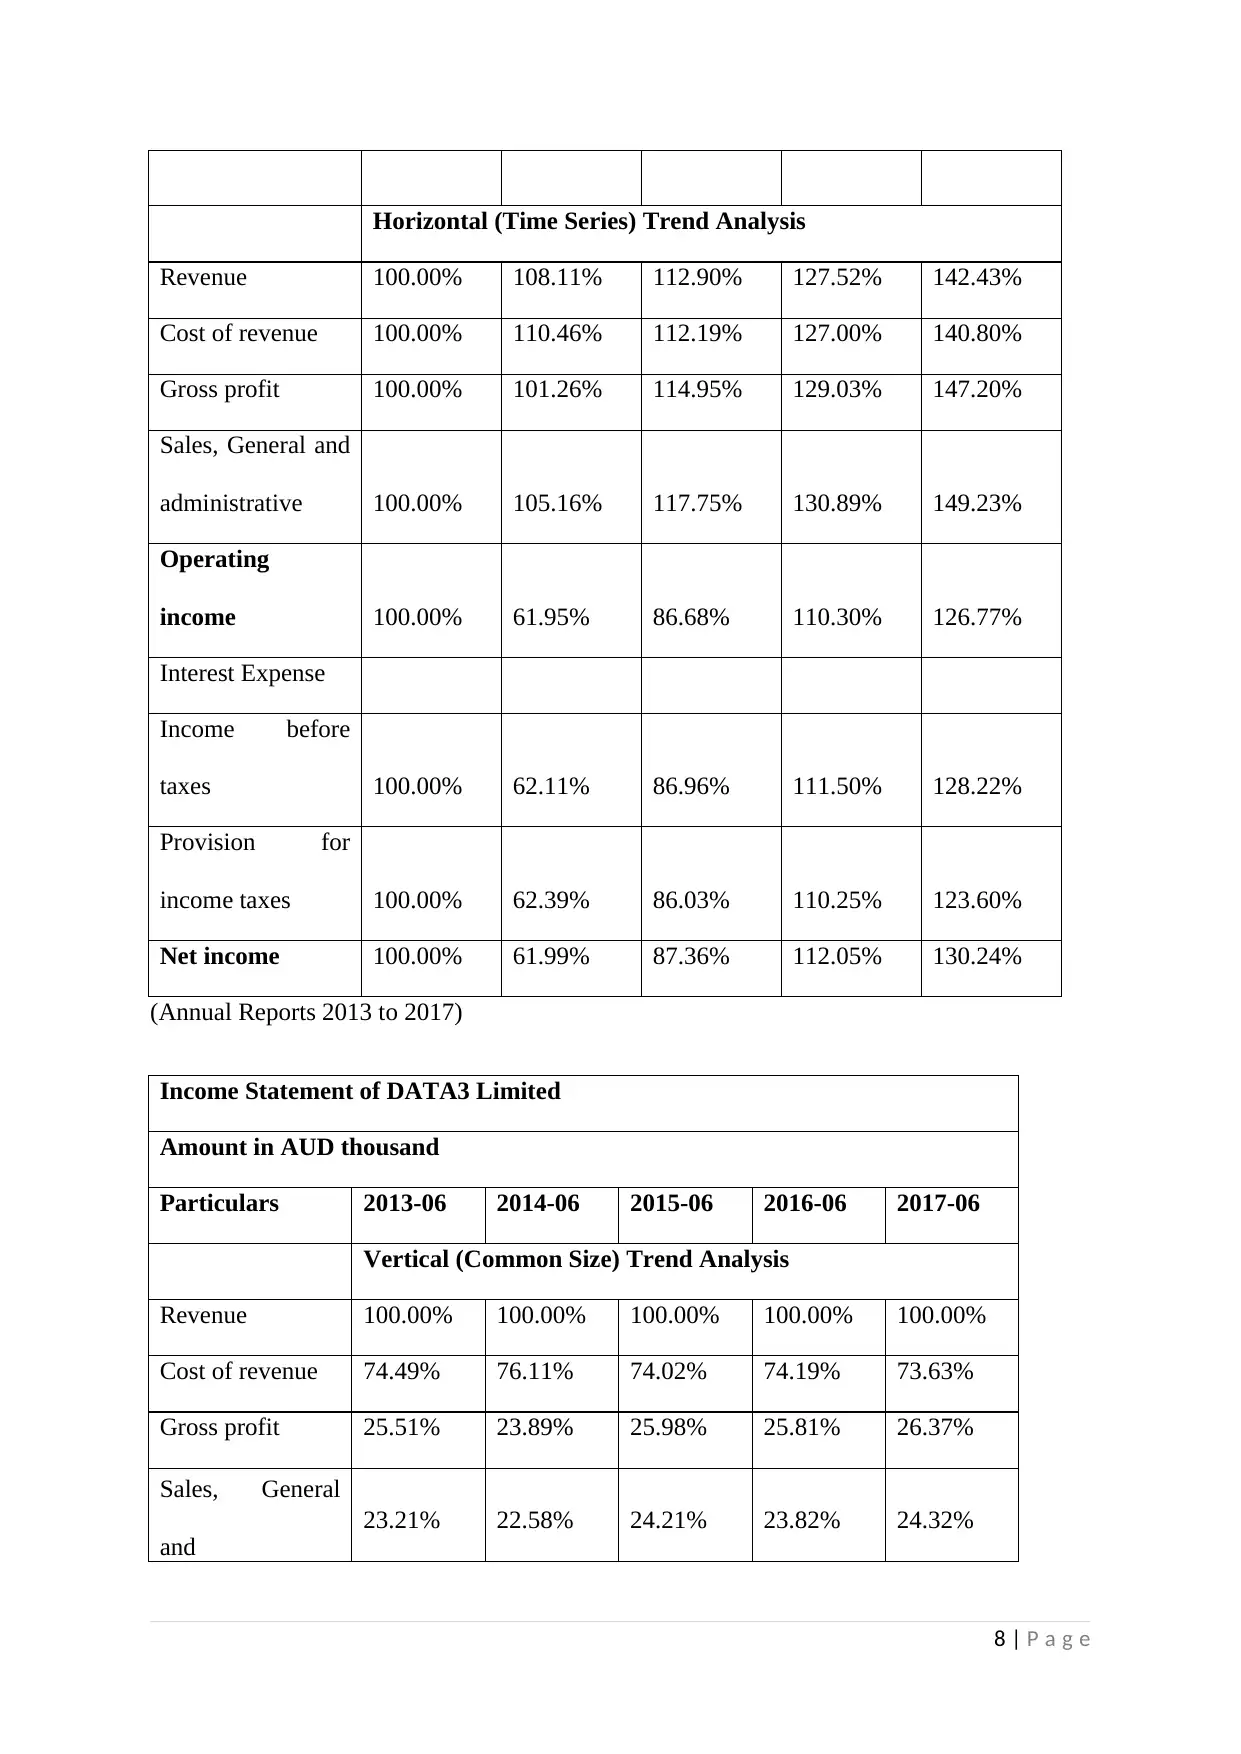
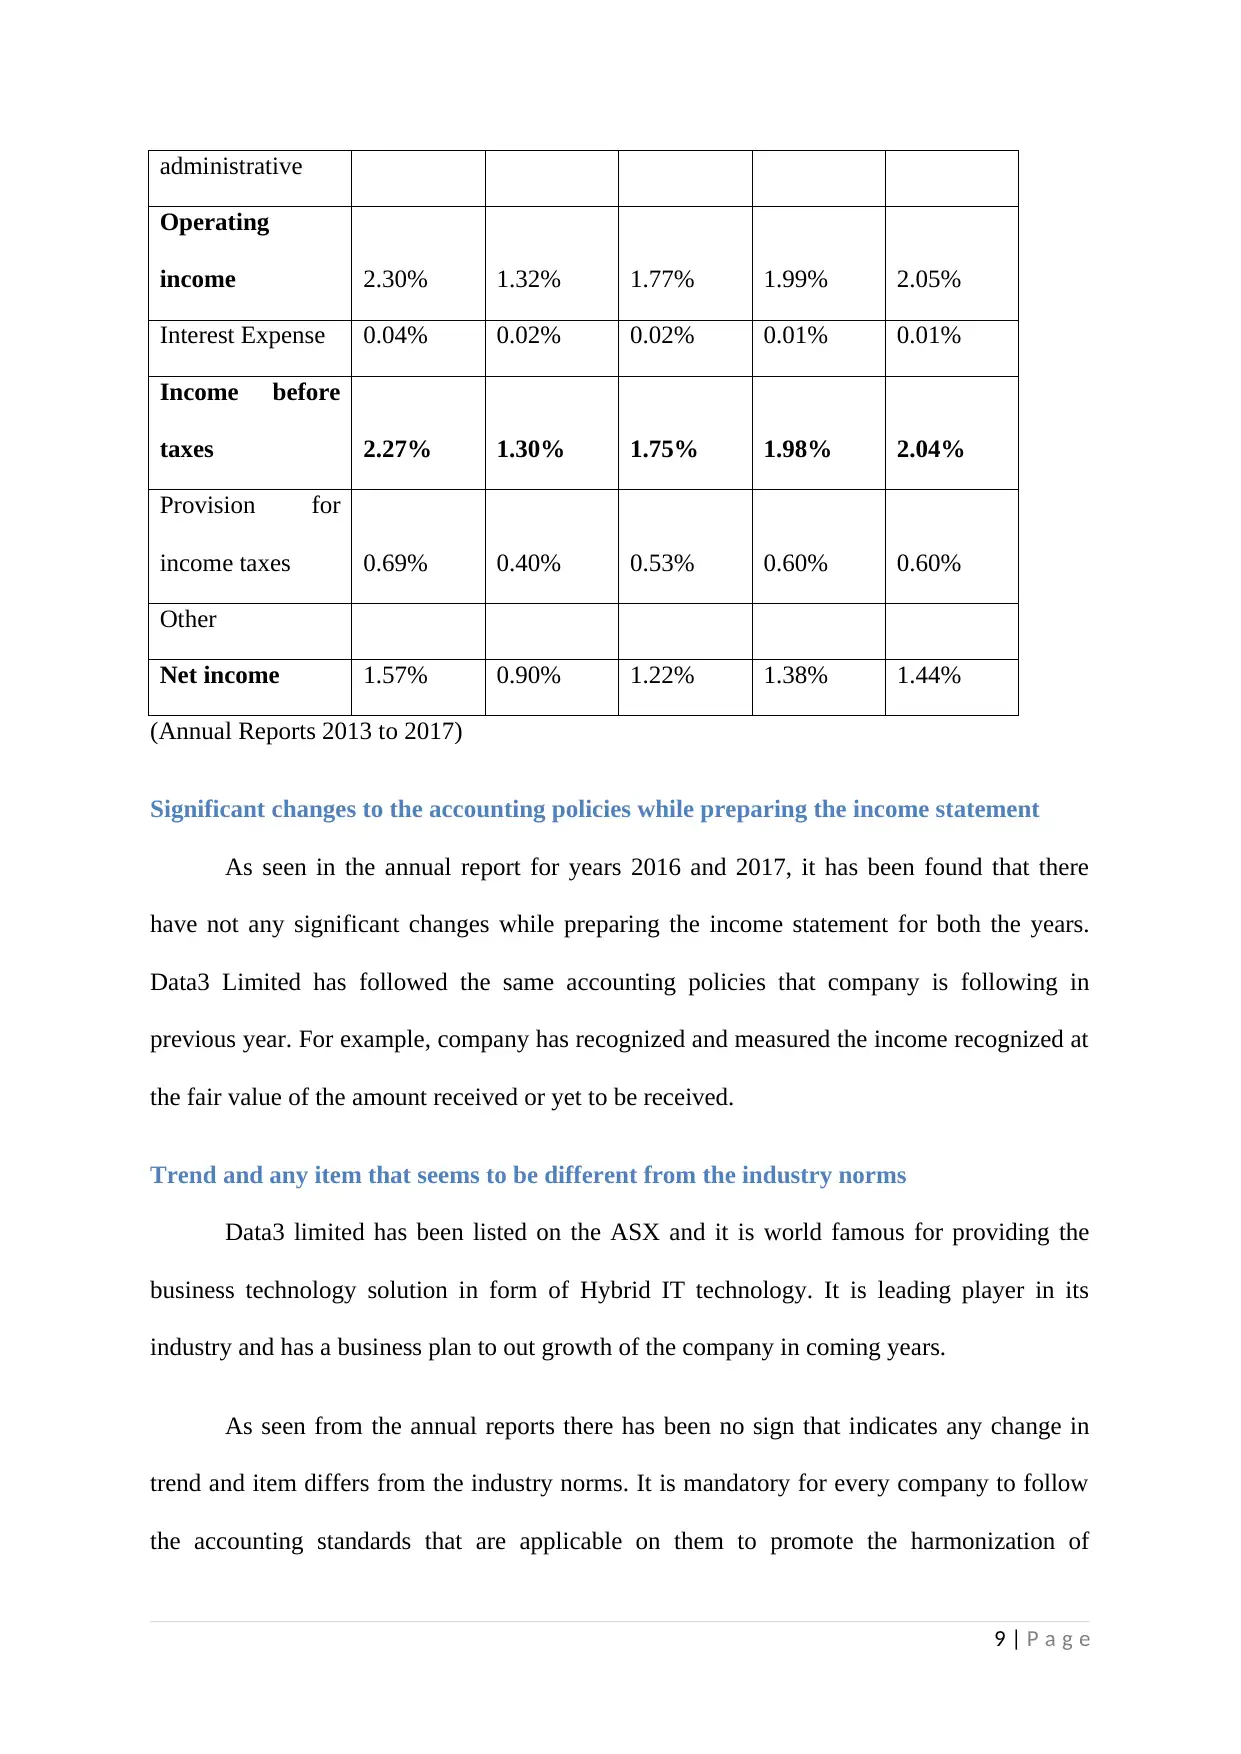
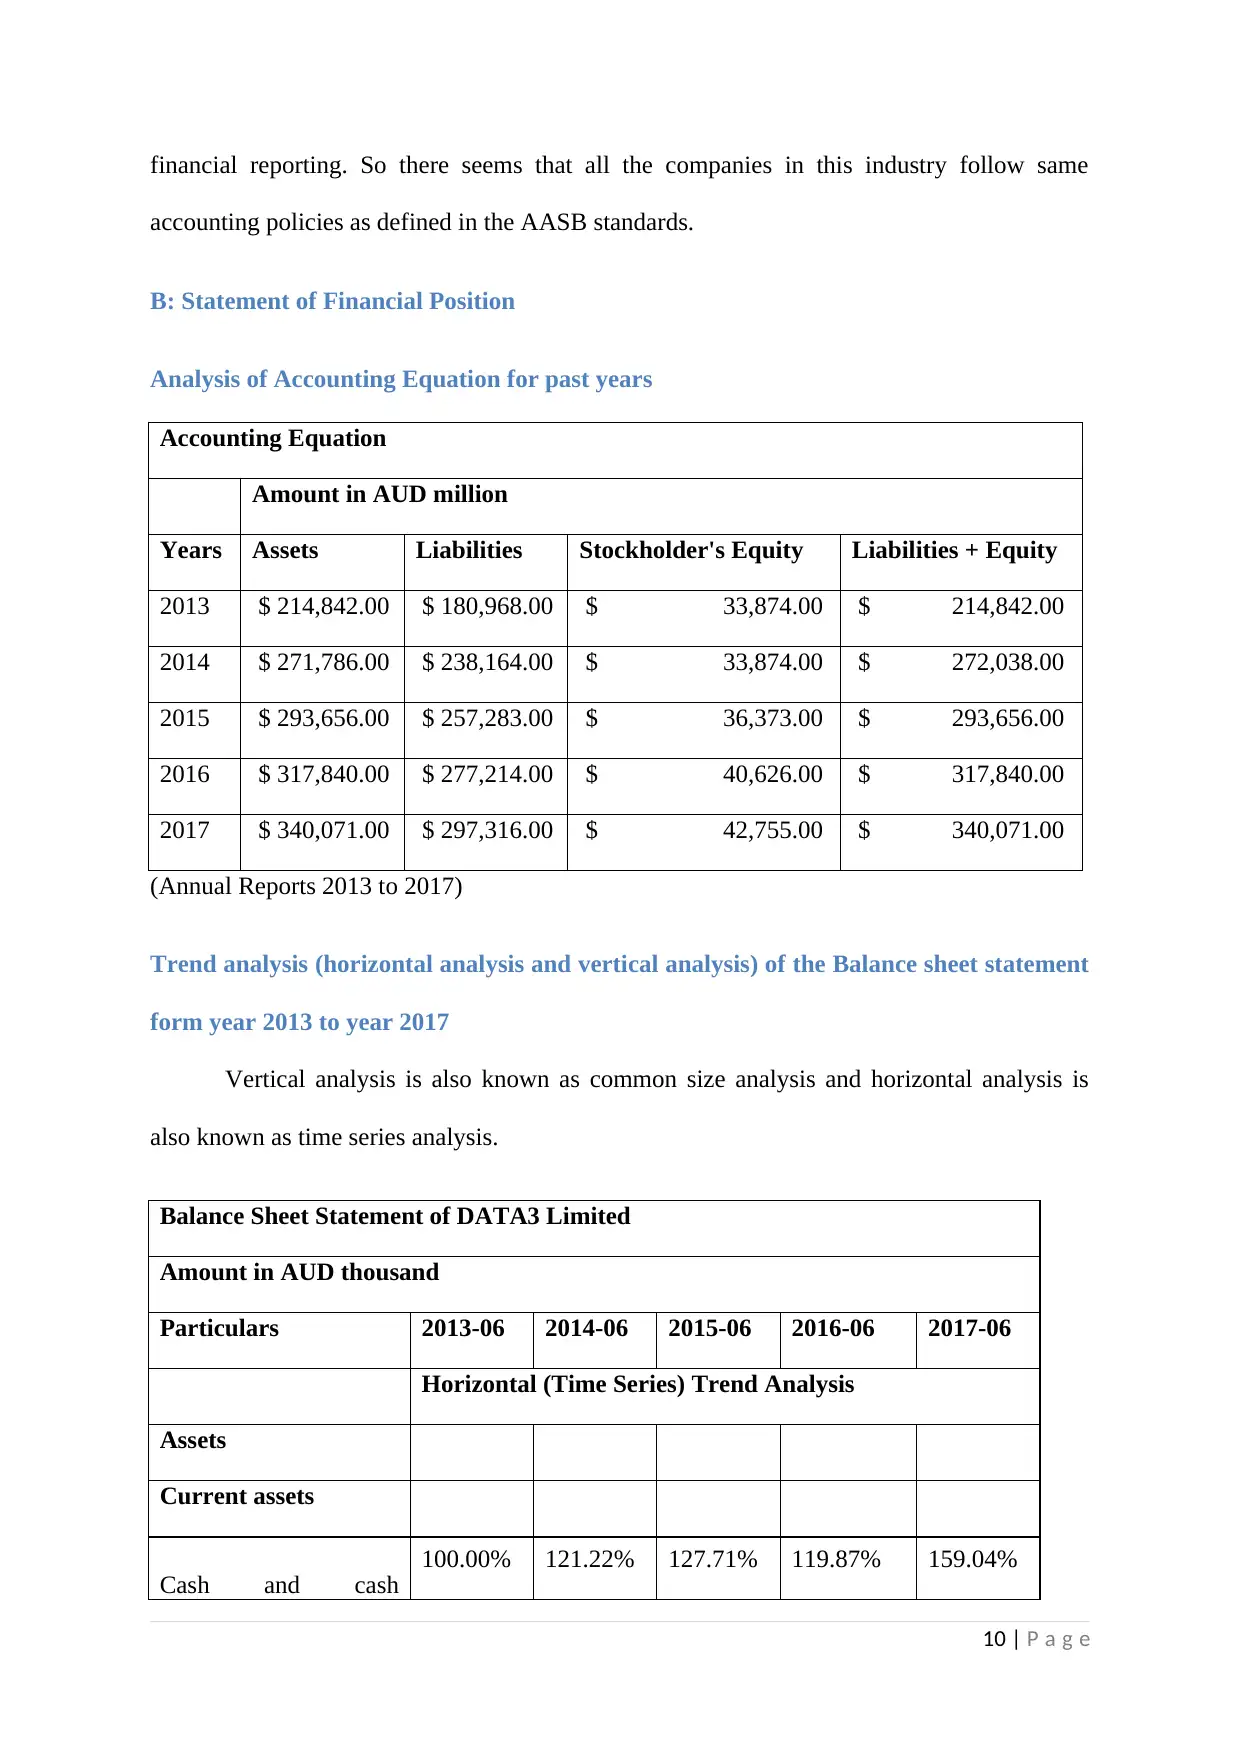
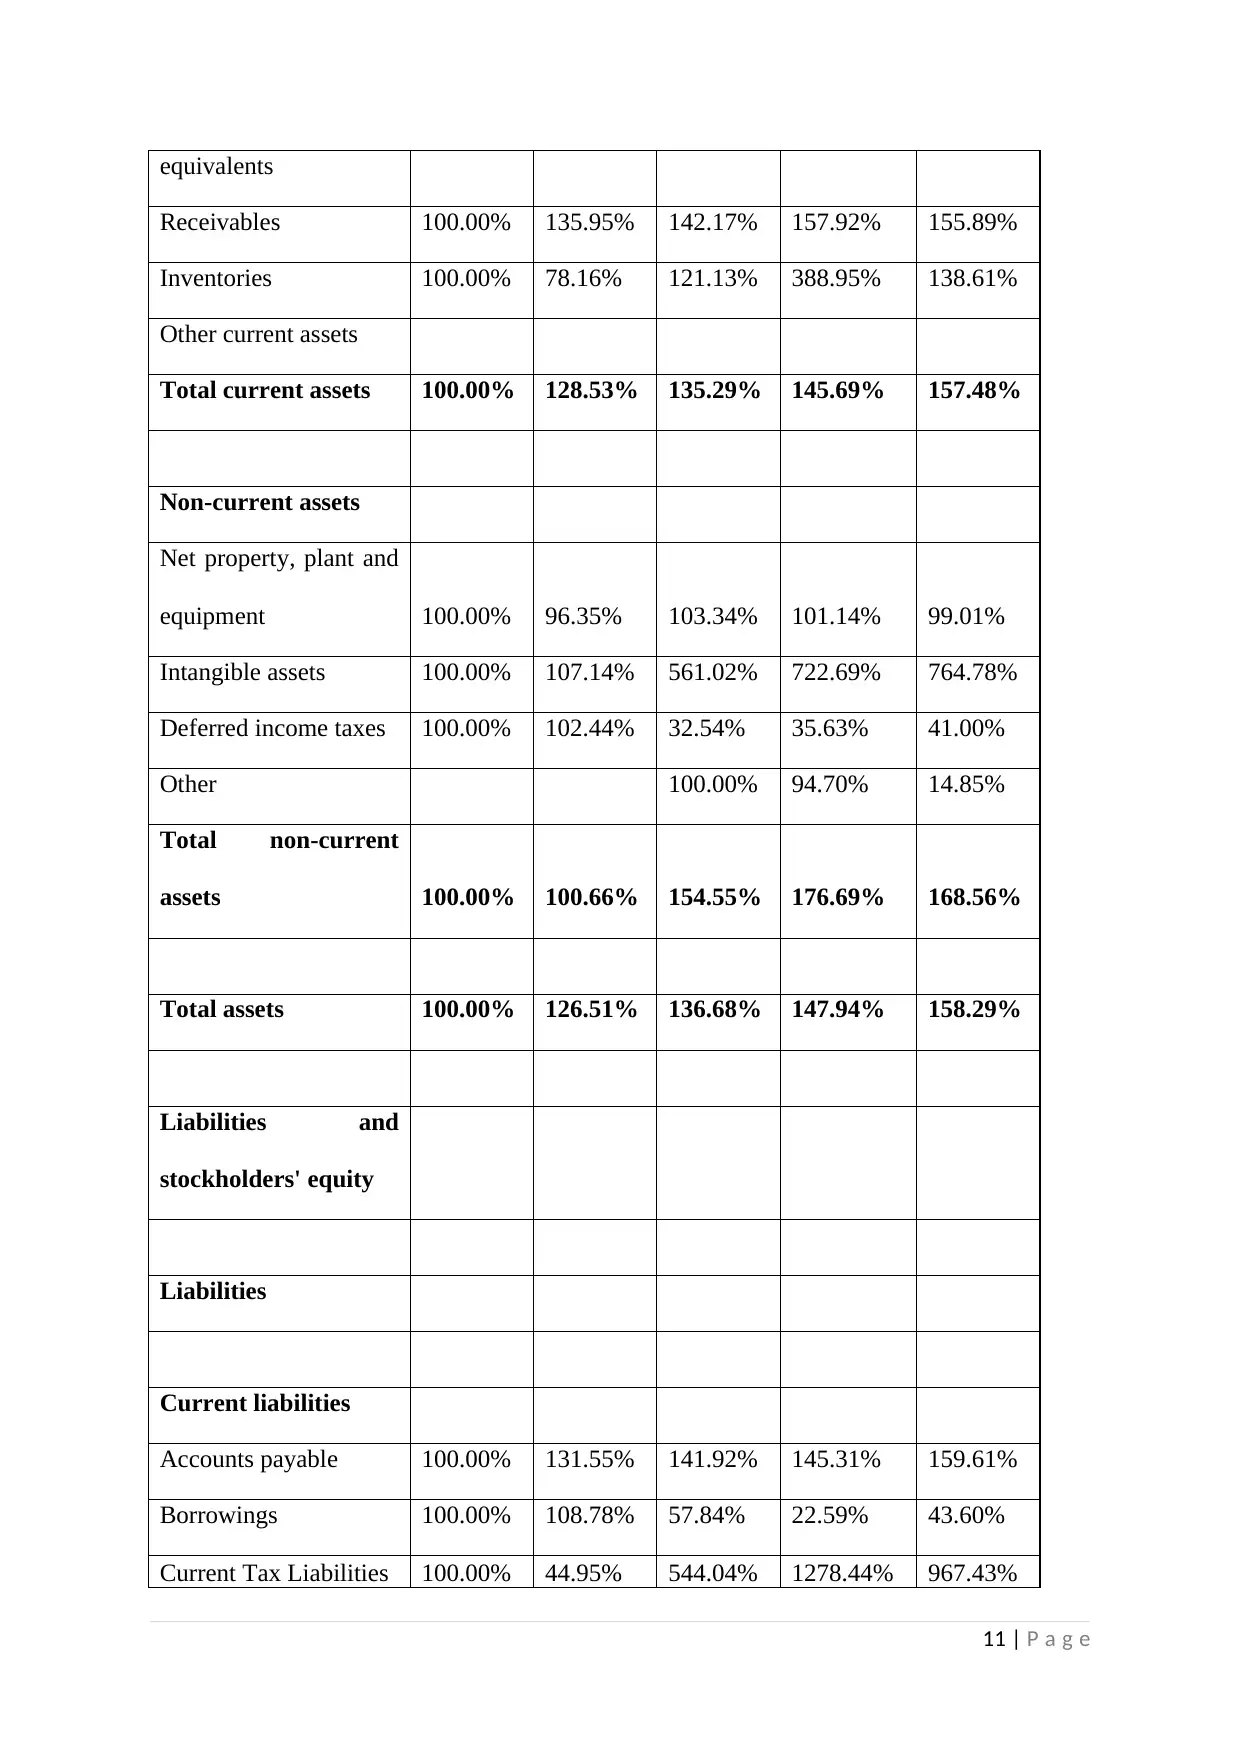
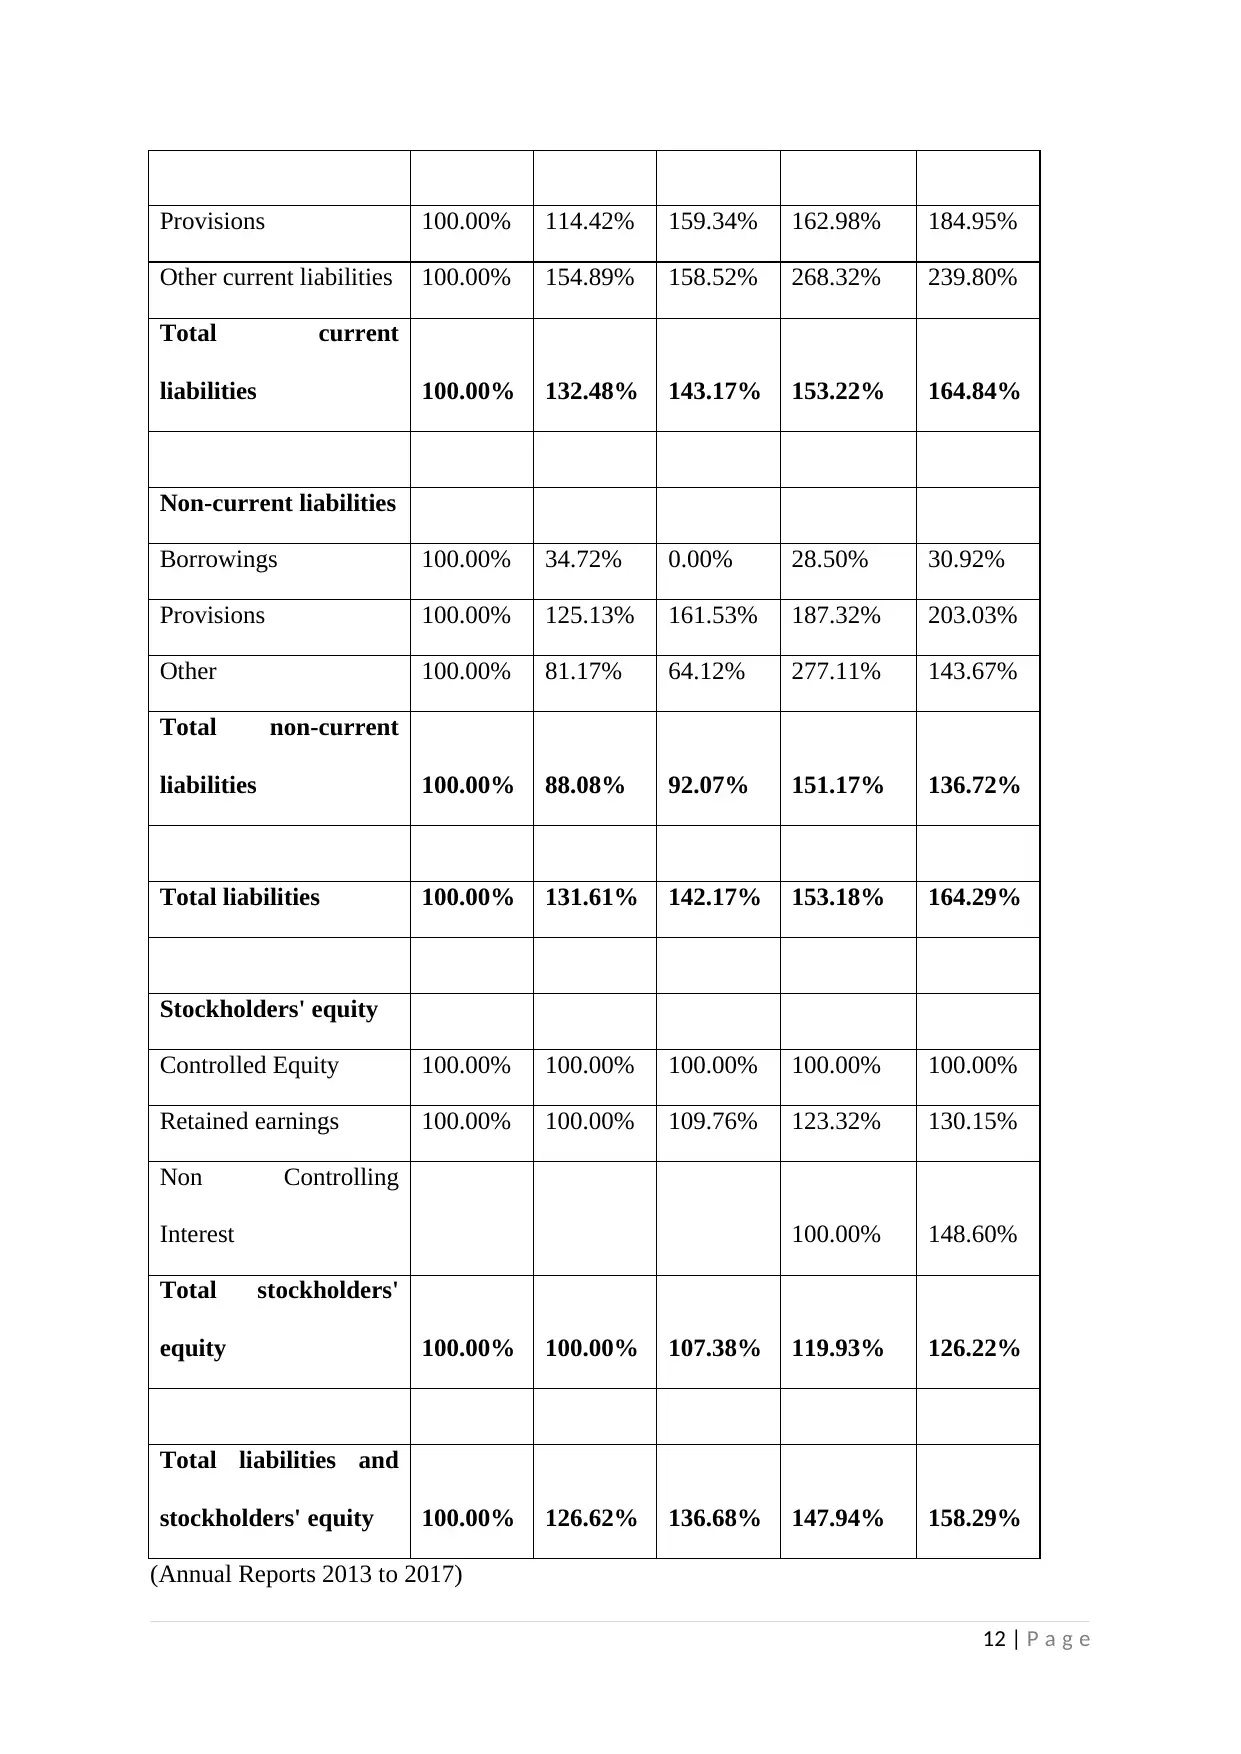
This report presents a detailed financial statement analysis of Data3 Limited spanning the years 2013 to 2017. The analysis includes a review of the company's statement of financial performance, examining gross profit, operating income, and net income trends through horizontal and vertical analysis. The report also investigates significant changes in accounting policies and compares items against industry norms. Furthermore, the analysis extends to the statement of financial position, evaluating the accounting equation, and analyzing trends in assets, liabilities, and equity. The statement of cash flow is examined, comparing cash flow from operating activities with net income and identifying key financing and investing activities. Ratio analysis is conducted to measure the company's performance, highlighting strengths and weaknesses. The report concludes with recommendations based on the findings and includes references to the company's annual reports.
Document Page
BUS5IAF Introduction to Accounting & Finance
Financial Statement Analysis
DATA#3 Limited
1 | P a g e
tabler-icon-diamond-filled.svg

Paraphrase This Document

Need a fresh take? Get an instant paraphrase of this document with our AI Paraphraser
Document Page
Contents
Part I: Introduction.....................................................................................................................4
Part II: Industry Situation and company plans...........................................................................4
Part III: Financial Statement Analysis.......................................................................................6
A: Statement of financial performance...................................................................................6
Gross Profit, Operating Income and net income.................................................................6
Trend analysis (horizontal analysis and vertical analysis) of the comprehensive income
statement form year 2013 to year 2017..............................................................................7
Significant changes to the accounting policies while preparing the income statement......9
Trend and any item that seems to be different from the industry norms............................9
B: Statement of Financial Position.......................................................................................10
Analysis of Accounting Equation for past years..............................................................10
Trend analysis (horizontal analysis and vertical analysis) of the Balance sheet statement
form year 2013 to year 2017.............................................................................................10
Accounting Policies in respect to different items presents in the balance sheet...............16
Trend and any item that seems to be different from the industry norms..........................17
C: Statement of Cash Flow...................................................................................................17
Comparison of cash flow from operating activity with past net income..........................17
Note on whether company is expanding through the investing activity...........................17
Important source of finances for the Data3 Limited.........................................................18
Movement of cash flows after comprising all the three activities....................................18
2 | P a g e
Document Page
D: Summary of above analysis.............................................................................................18
Part IV: Ratio Analysis............................................................................................................18
Trends, Strength and Weakness of the company performance measured through ratio
analysis.................................................................................................................................22
Part V: Conclusion and recommendations...............................................................................23
References................................................................................................................................24
3 | P a g e
Document Page
Part I: Introduction
Analysis of financial statements helps in evaluating the performance of the company
during the past years and compares them with the current year. In this report financial
performance of Data3 Limited has been evaluated for last five years using the trend analysis
and ratio analysis. The head office of the company is located at Brisbane, Australia. The chief
executive director of the company is Laurence Baynham. The ending date of lasted financial
year was June, 2017. Data3 Limited is related to the information technology industry and
aims to provide the services to the business organization to overcome their data problem and
other IT related problems. Some of the major services provided by the company are
Consulting services, procurement services, projects handling service, managing the task
services; and resourcing the human requirement. Company provides their services in whole
of Australia, and Asia Pacific (Company Overview, 2017). The independent auditors of the
company are Pitcher Partners. As per the auditors financial statements present true and fair
picture of the company financial performance. The most recent price of the company as on 7
September, 2017 was AUD $1.82. The last dividend per share for the year 2016-17 was $0.13
AUD (Morning Star, 2017).
Part II: Industry Situation and company plans
Data3 Limited belongs to IT services industry and it provides services that is needs by
organizations to handle there data problems and other IT related problems. This industry is
growing at rapid pace in Australia as well as in Asia Pacific countries. So it is highly
expected that company will definite expand their business in future years and become the
world strong player in this industry.
4 | P a g e
tabler-icon-diamond-filled.svg

Paraphrase This Document

Need a fresh take? Get an instant paraphrase of this document with our AI Paraphraser
Document Page
The long term business plan of the company is to grow the business aspect consulting
group and leveraging the Data3 Limited. Make the brand name Data3 Popular enough to get
international business frequently. Improving the health of employees and playing important
role in sustainable accounting with help of corporate governance (Annual Report, 2016).
5 | P a g e
Document Page
Part III: Financial Statement Analysis
A: Statement of financial performance
Gross Profit, Operating Income and net income
Particulars 2013-06 2014-06 2015-06 2016-06 2017-06
Amount in AUD thousand
Net Revenue
$
771,042.00
$
833,595.00
$
870,470.00
$
983,223.00
$
1,098,221.00
Gross Profit
$
196,709.00
$
199,187.00
$
226,108.00
$
253,810.00
$
289,562.00
Income from
Operation
$
17,754.00
$
10,999.00
$
15,389.00
$
19,582.00
$
22,507.00
Net Profit
$
12,138.00
$
7,524.00
$
10,604.00
$
13,601.00
$
15,809.00
(Annual Reports 2013 to 2017)
6 | P a g e
Document Page
2013-06 2014-06 2015-06 2016-06 2017-06
$-
$50,000.00
$100,000.00
$150,000.00
$200,000.00
$250,000.00
$300,000.00
$350,000.00
Trend Analysis of Various Incomes
Gross Profit
Income from Operation
Net Profit
AUD Million
Looking at the above table and graph it can be said that there sere has deep decline in
the gross profit in year 2014 as compare to year 2013, but there has been gradually increase
in gross in rest of the years. In respect of income from operations and net income it can be
said that there has same trend as in case of gross profit. So it can be said that year 2014 was
not a good year for the company performance point of view as there had been strong decline
in the net income as compare to previous year (Annual Reports 2013 to 2017).
Trend analysis (horizontal analysis and vertical analysis) of the comprehensive income
statement form year 2013 to year 2017
Vertical analysis is also known as common size analysis and horizontal analysis is
also known as time series analysis.
Income Statement of DATA3 Limited
Amount in AUD thousand
Particulars 2013-06 2014-06 2015-06 2016-06 2017-06
7 | P a g e
tabler-icon-diamond-filled.svg

Paraphrase This Document

Need a fresh take? Get an instant paraphrase of this document with our AI Paraphraser
Document Page
Horizontal (Time Series) Trend Analysis
Revenue 100.00% 108.11% 112.90% 127.52% 142.43%
Cost of revenue 100.00% 110.46% 112.19% 127.00% 140.80%
Gross profit 100.00% 101.26% 114.95% 129.03% 147.20%
Sales, General and
administrative 100.00% 105.16% 117.75% 130.89% 149.23%
Operating
income 100.00% 61.95% 86.68% 110.30% 126.77%
Interest Expense
Income before
taxes 100.00% 62.11% 86.96% 111.50% 128.22%
Provision for
income taxes 100.00% 62.39% 86.03% 110.25% 123.60%
Net income 100.00% 61.99% 87.36% 112.05% 130.24%
(Annual Reports 2013 to 2017)
Income Statement of DATA3 Limited
Amount in AUD thousand
Particulars 2013-06 2014-06 2015-06 2016-06 2017-06
Vertical (Common Size) Trend Analysis
Revenue 100.00% 100.00% 100.00% 100.00% 100.00%
Cost of revenue 74.49% 76.11% 74.02% 74.19% 73.63%
Gross profit 25.51% 23.89% 25.98% 25.81% 26.37%
Sales, General
and
23.21% 22.58% 24.21% 23.82% 24.32%
8 | P a g e
Document Page
administrative
Operating
income 2.30% 1.32% 1.77% 1.99% 2.05%
Interest Expense 0.04% 0.02% 0.02% 0.01% 0.01%
Income before
taxes 2.27% 1.30% 1.75% 1.98% 2.04%
Provision for
income taxes 0.69% 0.40% 0.53% 0.60% 0.60%
Other
Net income 1.57% 0.90% 1.22% 1.38% 1.44%
(Annual Reports 2013 to 2017)
Significant changes to the accounting policies while preparing the income statement
As seen in the annual report for years 2016 and 2017, it has been found that there
have not any significant changes while preparing the income statement for both the years.
Data3 Limited has followed the same accounting policies that company is following in
previous year. For example, company has recognized and measured the income recognized at
the fair value of the amount received or yet to be received.
Trend and any item that seems to be different from the industry norms
Data3 limited has been listed on the ASX and it is world famous for providing the
business technology solution in form of Hybrid IT technology. It is leading player in its
industry and has a business plan to out growth of the company in coming years.
As seen from the annual reports there has been no sign that indicates any change in
trend and item differs from the industry norms. It is mandatory for every company to follow
the accounting standards that are applicable on them to promote the harmonization of
9 | P a g e
Document Page
financial reporting. So there seems that all the companies in this industry follow same
accounting policies as defined in the AASB standards.
B: Statement of Financial Position
Analysis of Accounting Equation for past years
Accounting Equation
Amount in AUD million
Years Assets Liabilities Stockholder's Equity Liabilities + Equity
2013 $ 214,842.00 $ 180,968.00 $ 33,874.00 $ 214,842.00
2014 $ 271,786.00 $ 238,164.00 $ 33,874.00 $ 272,038.00
2015 $ 293,656.00 $ 257,283.00 $ 36,373.00 $ 293,656.00
2016 $ 317,840.00 $ 277,214.00 $ 40,626.00 $ 317,840.00
2017 $ 340,071.00 $ 297,316.00 $ 42,755.00 $ 340,071.00
(Annual Reports 2013 to 2017)
Trend analysis (horizontal analysis and vertical analysis) of the Balance sheet statement
form year 2013 to year 2017
Vertical analysis is also known as common size analysis and horizontal analysis is
also known as time series analysis.
Balance Sheet Statement of DATA3 Limited
Amount in AUD thousand
Particulars 2013-06 2014-06 2015-06 2016-06 2017-06
Horizontal (Time Series) Trend Analysis
Assets
Current assets
Cash and cash
100.00% 121.22% 127.71% 119.87% 159.04%
10 | P a g e
tabler-icon-diamond-filled.svg

Paraphrase This Document

Need a fresh take? Get an instant paraphrase of this document with our AI Paraphraser
Document Page
equivalents
Receivables 100.00% 135.95% 142.17% 157.92% 155.89%
Inventories 100.00% 78.16% 121.13% 388.95% 138.61%
Other current assets
Total current assets 100.00% 128.53% 135.29% 145.69% 157.48%
Non-current assets
Net property, plant and
equipment 100.00% 96.35% 103.34% 101.14% 99.01%
Intangible assets 100.00% 107.14% 561.02% 722.69% 764.78%
Deferred income taxes 100.00% 102.44% 32.54% 35.63% 41.00%
Other 100.00% 94.70% 14.85%
Total non-current
assets 100.00% 100.66% 154.55% 176.69% 168.56%
Total assets 100.00% 126.51% 136.68% 147.94% 158.29%
Liabilities and
stockholders' equity
Liabilities
Current liabilities
Accounts payable 100.00% 131.55% 141.92% 145.31% 159.61%
Borrowings 100.00% 108.78% 57.84% 22.59% 43.60%
Current Tax Liabilities 100.00% 44.95% 544.04% 1278.44% 967.43%
11 | P a g e
Document Page
Provisions 100.00% 114.42% 159.34% 162.98% 184.95%
Other current liabilities 100.00% 154.89% 158.52% 268.32% 239.80%
Total current
liabilities 100.00% 132.48% 143.17% 153.22% 164.84%
Non-current liabilities
Borrowings 100.00% 34.72% 0.00% 28.50% 30.92%
Provisions 100.00% 125.13% 161.53% 187.32% 203.03%
Other 100.00% 81.17% 64.12% 277.11% 143.67%
Total non-current
liabilities 100.00% 88.08% 92.07% 151.17% 136.72%
Total liabilities 100.00% 131.61% 142.17% 153.18% 164.29%
Stockholders' equity
Controlled Equity 100.00% 100.00% 100.00% 100.00% 100.00%
Retained earnings 100.00% 100.00% 109.76% 123.32% 130.15%
Non Controlling
Interest 100.00% 148.60%
Total stockholders'
equity 100.00% 100.00% 107.38% 119.93% 126.22%
Total liabilities and
stockholders' equity 100.00% 126.62% 136.68% 147.94% 158.29%
(Annual Reports 2013 to 2017)
12 | P a g e
chevron_up_icon
1 out of 21
circle_padding
hide_on_mobile
zoom_out_icon
[object Object]