Database Analysis and Design for Achieve Scheme Management System
VerifiedAdded on 2023/04/24
|9
|2172
|56
Report
AI Summary
This report presents the database analysis and design for the Achieve Scheme management system, focusing on efficient data storage and retrieval. It begins with an introduction outlining the scope of the project, followed by an Entity Relationship (ER) model that visually represents the database structure. The report emphasizes database normalization, ensuring data integrity and eliminating redundancy by achieving Boyce-Codd Normal Form (BCNF). A detailed database schema is provided, outlining the tables and their attributes. Furthermore, the report includes a research report on data visualization tools, recommending D3.js for its flexibility and ability to create tailored visualizations. The report concludes with a reflection on the importance of database design and the benefits of data visualization in the context of the Achieve Scheme. The document is contributed by a student to be published on the website Desklib. Desklib is a platform which provides all the necessary AI based study tools for students.

COVER PAGE
Paraphrase This Document
Need a fresh take? Get an instant paraphrase of this document with our AI Paraphraser
Contents
Introduction.................................................................................................................................................3
Entity relationship Model............................................................................................................................3
Database Normalization..............................................................................................................................5
Database schema....................................................................................................................................6
Research report...........................................................................................................................................7
Reflection Summary....................................................................................................................................7
References...................................................................................................................................................8
Introduction
This report discusses the database analysis and design of the proposed Achieve Scheme database
management system. An entity relationship diagram is used to show the top down design of the
document and each entity in the entity relationship model is validated to make sure it’s in Boyce-Codd
Normal Form (BCNF). A research of a possible database visualization tool is proposed with justifications
as to why it’s the best tool suited for the proposed database.
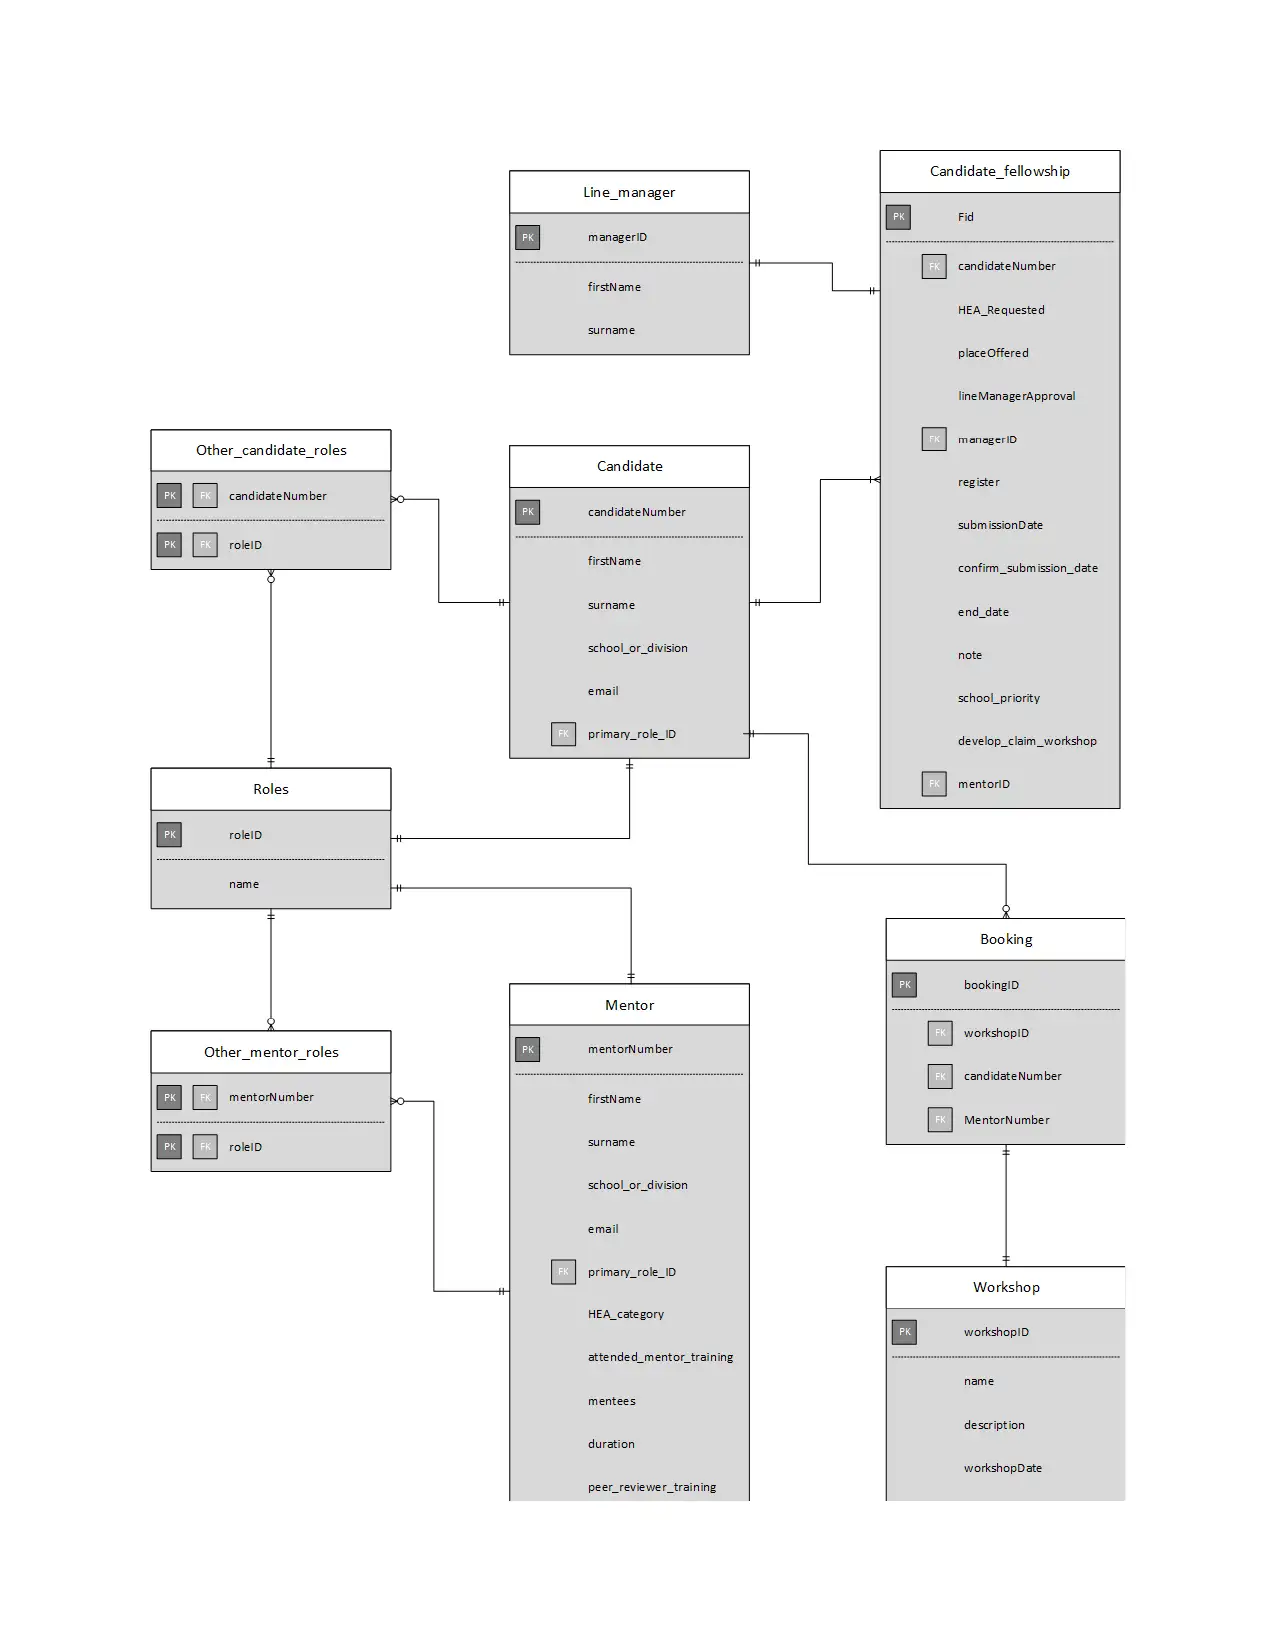
Entity relationship Model
The diagram below shows the ERD of the proposed database.
This report discusses the database analysis and design of the proposed Achieve Scheme database
management system. An entity relationship diagram is used to show the top down design of the
document and each entity in the entity relationship model is validated to make sure it’s in Boyce-Codd
Normal Form (BCNF). A research of a possible database visualization tool is proposed with justifications
as to why it’s the best tool suited for the proposed database.
Entity relationship Model
The diagram below shows the ERD of the proposed database.
⊘ This is a preview!⊘
Do you want full access?
Subscribe today to unlock all pages.
Trusted by 1+ million students worldwide
Paraphrase This Document
Need a fresh take? Get an instant paraphrase of this document with our AI Paraphraser
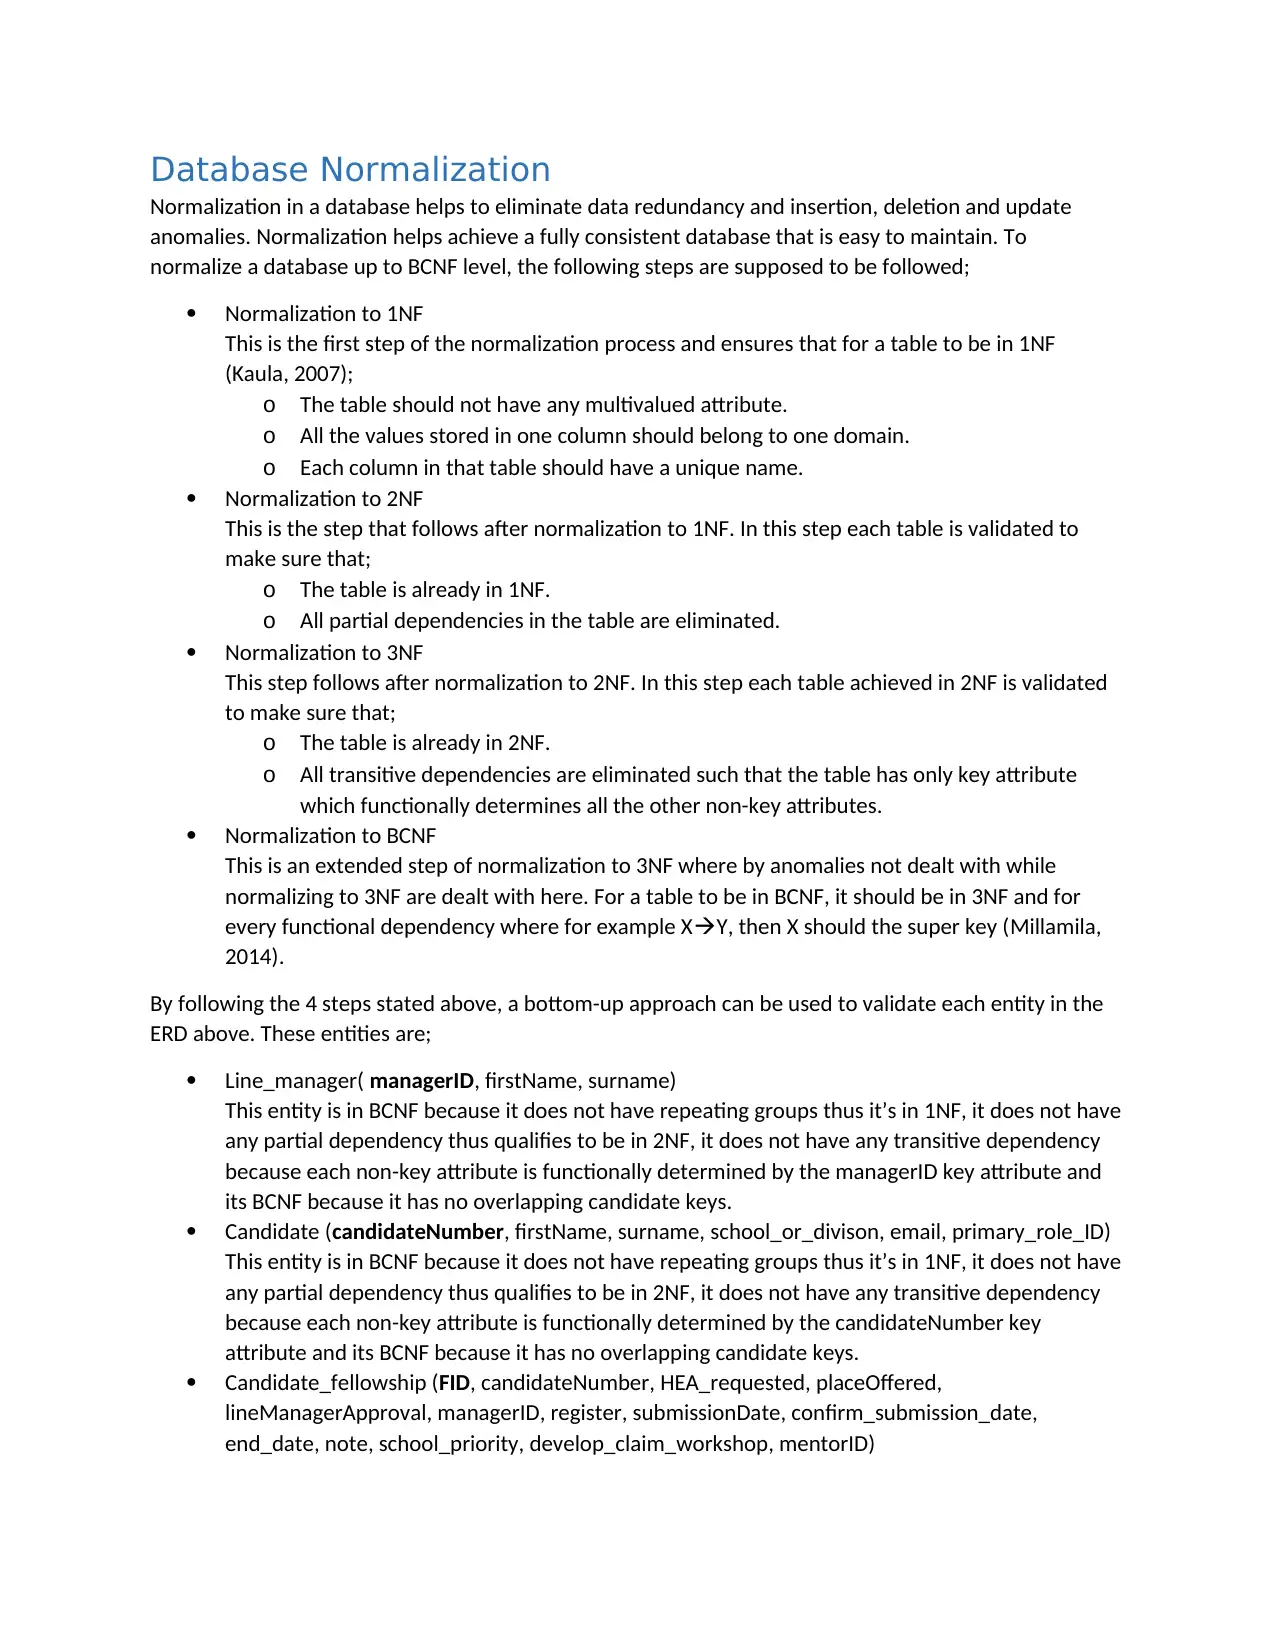
Database Normalization
Normalization in a database helps to eliminate data redundancy and insertion, deletion and update
anomalies. Normalization helps achieve a fully consistent database that is easy to maintain. To
normalize a database up to BCNF level, the following steps are supposed to be followed;
Normalization to 1NF
This is the first step of the normalization process and ensures that for a table to be in 1NF
(Kaula, 2007);
o The table should not have any multivalued attribute.
o All the values stored in one column should belong to one domain.
o Each column in that table should have a unique name.
Normalization to 2NF
This is the step that follows after normalization to 1NF. In this step each table is validated to
make sure that;
o The table is already in 1NF.
o All partial dependencies in the table are eliminated.
Normalization to 3NF
This step follows after normalization to 2NF. In this step each table achieved in 2NF is validated
to make sure that;
o The table is already in 2NF.
o All transitive dependencies are eliminated such that the table has only key attribute
which functionally determines all the other non-key attributes.
Normalization to BCNF
This is an extended step of normalization to 3NF where by anomalies not dealt with while
normalizing to 3NF are dealt with here. For a table to be in BCNF, it should be in 3NF and for
every functional dependency where for example XY, then X should the super key (Millamila,
2014).
By following the 4 steps stated above, a bottom-up approach can be used to validate each entity in the
ERD above. These entities are;
Line_manager( managerID, firstName, surname)
This entity is in BCNF because it does not have repeating groups thus it’s in 1NF, it does not have
any partial dependency thus qualifies to be in 2NF, it does not have any transitive dependency
because each non-key attribute is functionally determined by the managerID key attribute and
its BCNF because it has no overlapping candidate keys.
Candidate (candidateNumber, firstName, surname, school_or_divison, email, primary_role_ID)
This entity is in BCNF because it does not have repeating groups thus it’s in 1NF, it does not have
any partial dependency thus qualifies to be in 2NF, it does not have any transitive dependency
because each non-key attribute is functionally determined by the candidateNumber key
attribute and its BCNF because it has no overlapping candidate keys.
Candidate_fellowship (FID, candidateNumber, HEA_requested, placeOffered,
lineManagerApproval, managerID, register, submissionDate, confirm_submission_date,
end_date, note, school_priority, develop_claim_workshop, mentorID)

This entity is in BCNF because it does not have repeating groups thus it’s in 1NF, it does not have
any partial dependency thus qualifies to be in 2NF, it does not have any transitive dependency
because each non-key attribute is functionally determined by the FID key attribute and its BCNF
because it has no overlapping candidate keys.
Roles (roleID, name)
This entity is in BCNF because it does not have repeating groups thus it’s in 1NF, it does not have
any partial dependency thus qualifies to be in 2NF, it does not have any transitive dependency
because each non-key attribute is functionally determined by the roleID key attribute and its
BCNF because it has no overlapping candidate keys.
Other_candidate_roles ( candidateNumber, roleID)
This entity is in BCNF because it does not have repeating groups thus it’s in 1NF, it does not have
any partial dependency thus qualifies to be in 2NF, it does not have any transitive dependency
because each non-key attribute is functionally determined by the composite primary key
candidateNumber and roleID key attribute and its BCNF because it has no overlapping candidate
keys.
Mentor ( mentorNumber, firstName, surname, school_or_divison, email, primary_role_ID,
HEA_Category, attended_mentor_training, mentees, duration, peer_reviewer_training, active,
notes)
This entity is in BCNF because it does not have repeating groups thus it’s in 1NF, it does not have
any partial dependency thus qualifies to be in 2NF, it does not have any transitive dependency
because each non-key attribute is functionally determined by the mentorNumber key attribute
and its BCNF because it has no overlapping candidate keys.
Workshop ( workshopID, name, description, workshopDate, offered)
This entity is in BCNF because it does not have repeating groups thus it’s in 1NF, it does not have
any partial dependency thus qualifies to be in 2NF, it does not have any transitive dependency
because each non-key attribute is functionally determined by the workshopID key attribute and
its BCNF because it has no overlapping candidate keys.
Booking (BookingID, workshopID, candidateNumber, mentorNumber)
This entity is in BCNF because it does not have repeating groups thus it’s in 1NF, it does not have
any partial dependency thus qualifies to be in 2NF, it does not have any transitive dependency
because each non-key attribute is functionally determined by the bookingID key attribute and its
BCNF because it has no overlapping candidate keys.
Other_mentor_roles (mentorNumber, roleID)
This entity is in BCNF because it does not have repeating groups thus it’s in 1NF, it does not have
any partial dependency thus qualifies to be in 2NF, it does not have any transitive dependency
because each non-key attribute is functionally determined by the composite primary key
mentorNumber and roleID key attribute and its BCNF because it has no overlapping candidate
keys.
Database schema
The final database schema for the proposed database is composed of the following tables;
Line_manager( managerID, firstName, surname)
Candidate (candidateNumber, firstName, surname, school_or_divison, email, primary_role_ID)
any partial dependency thus qualifies to be in 2NF, it does not have any transitive dependency
because each non-key attribute is functionally determined by the FID key attribute and its BCNF
because it has no overlapping candidate keys.
Roles (roleID, name)
This entity is in BCNF because it does not have repeating groups thus it’s in 1NF, it does not have
any partial dependency thus qualifies to be in 2NF, it does not have any transitive dependency
because each non-key attribute is functionally determined by the roleID key attribute and its
BCNF because it has no overlapping candidate keys.
Other_candidate_roles ( candidateNumber, roleID)
This entity is in BCNF because it does not have repeating groups thus it’s in 1NF, it does not have
any partial dependency thus qualifies to be in 2NF, it does not have any transitive dependency
because each non-key attribute is functionally determined by the composite primary key
candidateNumber and roleID key attribute and its BCNF because it has no overlapping candidate
keys.
Mentor ( mentorNumber, firstName, surname, school_or_divison, email, primary_role_ID,
HEA_Category, attended_mentor_training, mentees, duration, peer_reviewer_training, active,
notes)
This entity is in BCNF because it does not have repeating groups thus it’s in 1NF, it does not have
any partial dependency thus qualifies to be in 2NF, it does not have any transitive dependency
because each non-key attribute is functionally determined by the mentorNumber key attribute
and its BCNF because it has no overlapping candidate keys.
Workshop ( workshopID, name, description, workshopDate, offered)
This entity is in BCNF because it does not have repeating groups thus it’s in 1NF, it does not have
any partial dependency thus qualifies to be in 2NF, it does not have any transitive dependency
because each non-key attribute is functionally determined by the workshopID key attribute and
its BCNF because it has no overlapping candidate keys.
Booking (BookingID, workshopID, candidateNumber, mentorNumber)
This entity is in BCNF because it does not have repeating groups thus it’s in 1NF, it does not have
any partial dependency thus qualifies to be in 2NF, it does not have any transitive dependency
because each non-key attribute is functionally determined by the bookingID key attribute and its
BCNF because it has no overlapping candidate keys.
Other_mentor_roles (mentorNumber, roleID)
This entity is in BCNF because it does not have repeating groups thus it’s in 1NF, it does not have
any partial dependency thus qualifies to be in 2NF, it does not have any transitive dependency
because each non-key attribute is functionally determined by the composite primary key
mentorNumber and roleID key attribute and its BCNF because it has no overlapping candidate
keys.
Database schema
The final database schema for the proposed database is composed of the following tables;
Line_manager( managerID, firstName, surname)
Candidate (candidateNumber, firstName, surname, school_or_divison, email, primary_role_ID)
⊘ This is a preview!⊘
Do you want full access?
Subscribe today to unlock all pages.
Trusted by 1+ million students worldwide
Candidate_fellowship (FID, candidateNumber, HEA_requested, placeOffered,
lineManagerApproval, managerID, register, submissionDate, confirm_submission_date,
end_date, note, school_priority, develop_claim_workshop, mentorID)
Roles (roleID, name)
Other_candidate_roles ( candidateNumber, roleID)
Mentor ( mentorNumber, firstName, surname, school_or_divison, email, primary_role_ID,
HEA_Category, attended_mentor_training, mentees, duration, peer_reviewer_training, active,
notes)
Workshop ( workshopID, name, description, workshopDate, offered)
Booking (BookingID, workshopID, candidateNumber, mentorNumber)
Other_mentor_roles (mentorNumber, roleID)
Research report
For data to make more sense, there is need to use visualization tools and dashboards that let the analyst
visualize the data so as to draw conclusions from the patterns identified in the visuals. Choosing a data
visualization tool can depend on a number of factors each of which is supposed to be critically analyzed
during the choosing process. These factors include (Lock, 2016);
The type of data you want to visualize.
The volume of data to be visualized.
The supported data formats by the visualization tool.
Ease of integration of the visualization tool with external systems (Ose.com.au, 2017).
How easy it is to use the tool.
Cost of the tool (Crider, 2017).
There are many visualization tools that can be used for the Scheme System but the best suited tool for
the system is D3.js. D3 is a JavaScript library which is used to manipulate documents on data basis
(Bostock, 2019). It uses HTML, CSS and SVG thus taking advantage of the capabilities of modern web
browsers and does not restrict the user to patented frameworks (Cabotsolutions.com, 2017). D3.js is a
JavaScript library thus it’s easy to use. Because the proposed Scheme system is not going to generate
large volumes of data, D3.js will be able to handle the data.
When the database is implemented and deployed in a server a web application can be built alongside it
to act as the database management system. D3.js will be used on the client side of the web application
where after the data is fetched then D3 is used to visualize the data using DOM elements (Saku, 2013).
This means that a data visualization framework tailored to the Scheme system can be developed. Using
D3 will not bring any purchase costs since its open source. Use of D3 is limited to the ability of the
develop to take advantage of the features that come with modern browsers because D3 is very flexible
and does not limit the developer thus can be integrated seamlessly with the scheme system.
Reflection Summary
For a database to be a success, the database design process must follow all steps required to ensure that
the final database has no data redundancies and stores consistent data. This is because applications
generate large volumes of data thus a well-designed database ensures that the data is manageable and
Paraphrase This Document
Need a fresh take? Get an instant paraphrase of this document with our AI Paraphraser
usable by applications built on top of it. Over time, the data increases in volumes and there is need to
study the data. This is achieved by use of visualization tools and dashboards. By visualizing data, the data
analyst is able to identify patterns from the data visuals all of which are important to the business or
organization. The selection of the visualization tool should be done based on the database and the
volumes of data and that is why a library like D3.js is applicable to the scheme system because of its
flexibility and ease of integration with existing systems.
Conclusion
Scheme system is set to benefit from implementing the database system which will help make work
easier especially when managing the data. Implementing a data visualization framework will reduce the
burden of data analysis thus the data analysis team will be able to study and get insightful patterns from
the data.
References
Bostock, M. (2019). D3.js - Data-Driven Documents. [online] D3js.org. Available at: https://d3js.org/
[Accessed 7 Mar. 2019].
Cabotsolutions.com. (2017). D3.js: the Best Dynamic Platform to Create Mind-Blowing Data
Visualizations. [online] Available at: https://www.cabotsolutions.com/2017/05/d3-js-the-best-dynamic-
platform-to-create-mind-blowing-data-visualizations [Accessed 7 Mar. 2019].
Crider, A. (2017). How to Choose the Right Data Visualization Tools. [online] Clarityinsights.com.
Available at: https://www.clarityinsights.com/blog/choosing-right-data-visualization-tools [Accessed 7
Mar. 2019].
Kaula, R. (2007). Normalizing with Entity Relationship Diagramming. [online] The Data Administration
Newsletter. Available at: http://tdan.com/normalizing-with-entity-relationship-diagramming/4583
[Accessed 7 Mar. 2019].
Lock, M. (2016). Three Key Criteria When Selecting Data Visualization Tools - Aberdeen. [online]
Aberdeen. Available at: https://www.aberdeen.com/big-datapro-essentials/three-key-criteria-when-
selecting-data-visualization-tools/ [Accessed 7 Mar. 2019].
Millamila, M. (2014). Entity Relationship Diagrams and Normalization. [online] prezi. Available at:
https://prezi.com/tunrndt0nin4/entity-relationship-diagrams-and-normalization/ [Accessed 7 Mar.
2019].
Saku, D. (2013). Visually Blog Why D3.js is So Great for Data Visualization | Visually Blog. [online]
Visual.ly. Available at: https://visual.ly/blog/why-d3-js-is-so-great-for-data-visualization/ [Accessed 7
Mar. 2019].
Ose.com.au. (2017). Selecting a Data Visualisation Tool: 10 Key Considerations - OSE. [online] Available
at: https://www.ose.com.au/blog/how-to-select-a-data-visualisation-tool/ [Accessed 7 Mar. 2019].

⊘ This is a preview!⊘
Do you want full access?
Subscribe today to unlock all pages.
Trusted by 1+ million students worldwide
1 out of 9
Related Documents


Your All-in-One AI-Powered Toolkit for Academic Success.
+13062052269
info@desklib.com
Available 24*7 on WhatsApp / Email
![[object Object]](/_next/static/media/star-bottom.7253800d.svg)
Unlock your academic potential
Copyright © 2020–2026 A2Z Services. All Rights Reserved. Developed and managed by ZUCOL.