Database Design Report: MS Access, MySQL, and Pivot Tables

Verified

Added on  2020/10/05

|22
|711
|222
Report
AI Summary
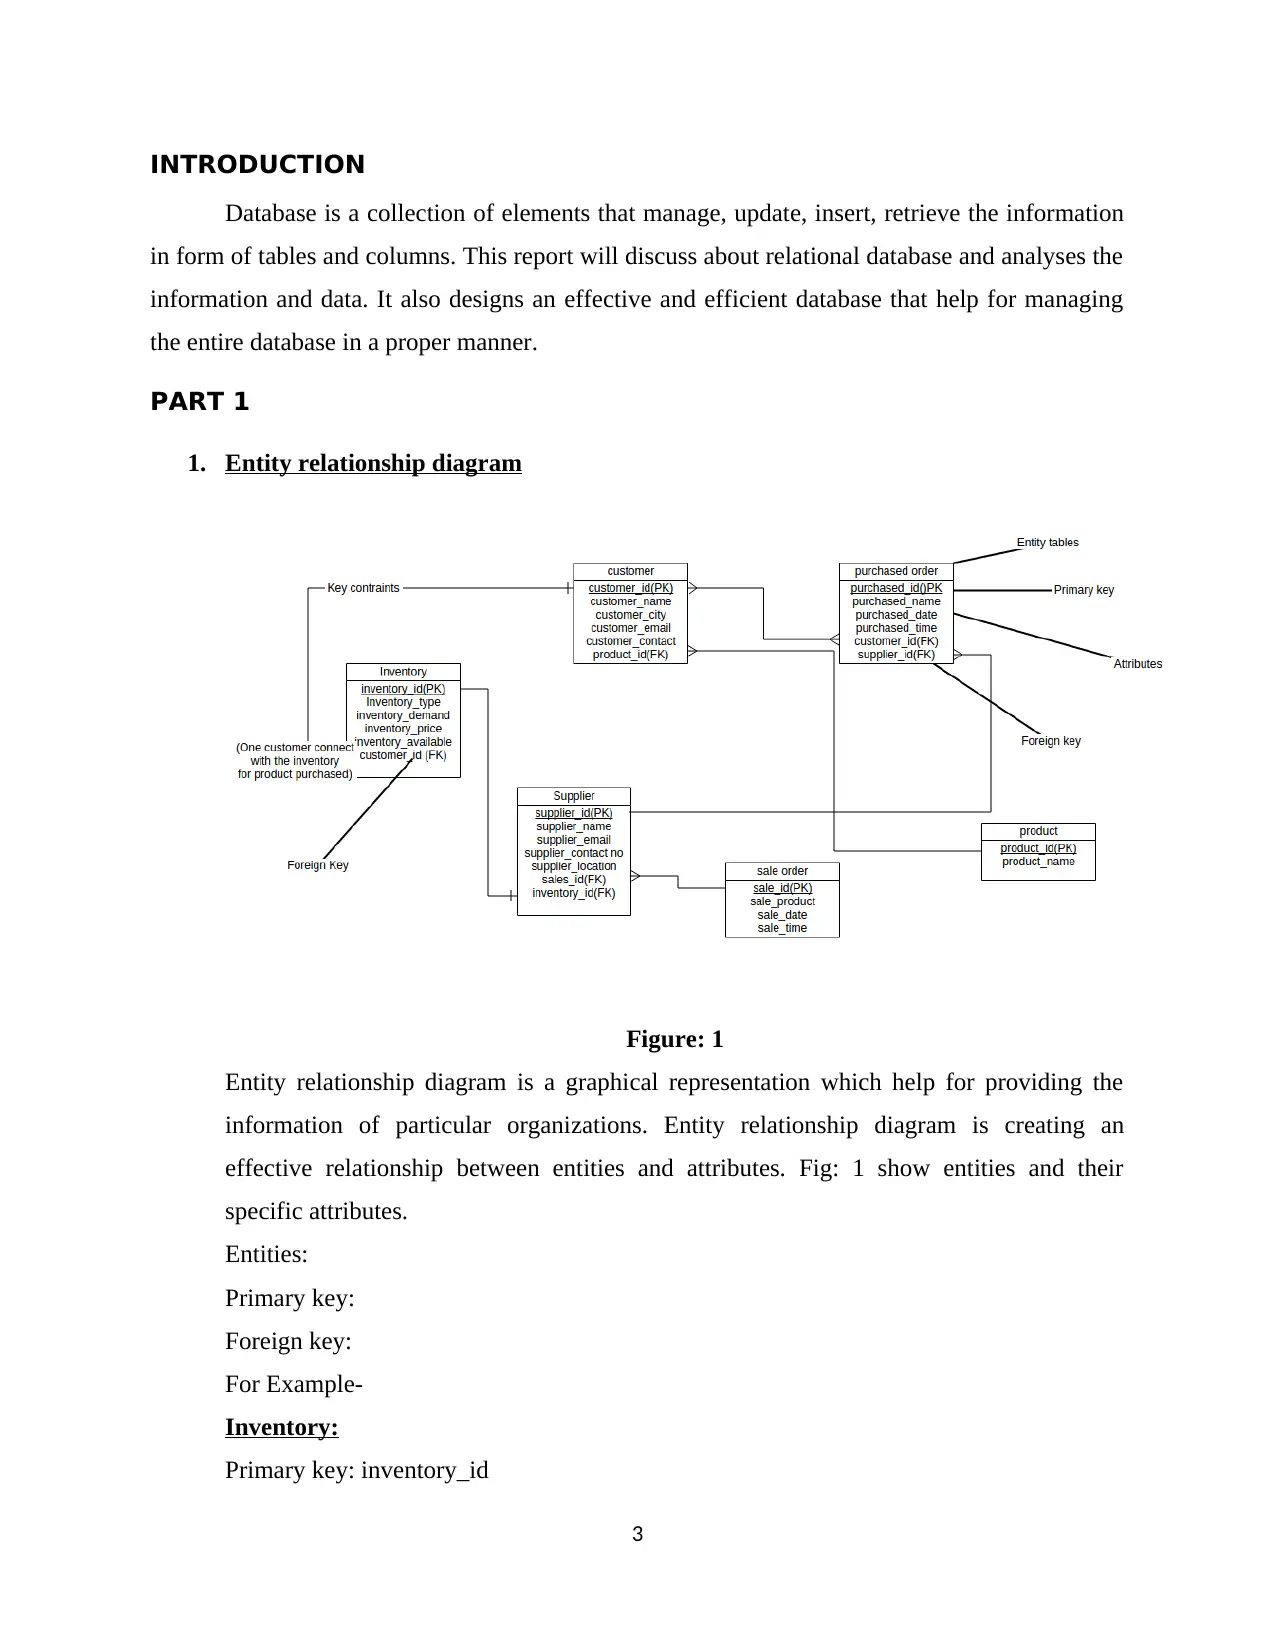
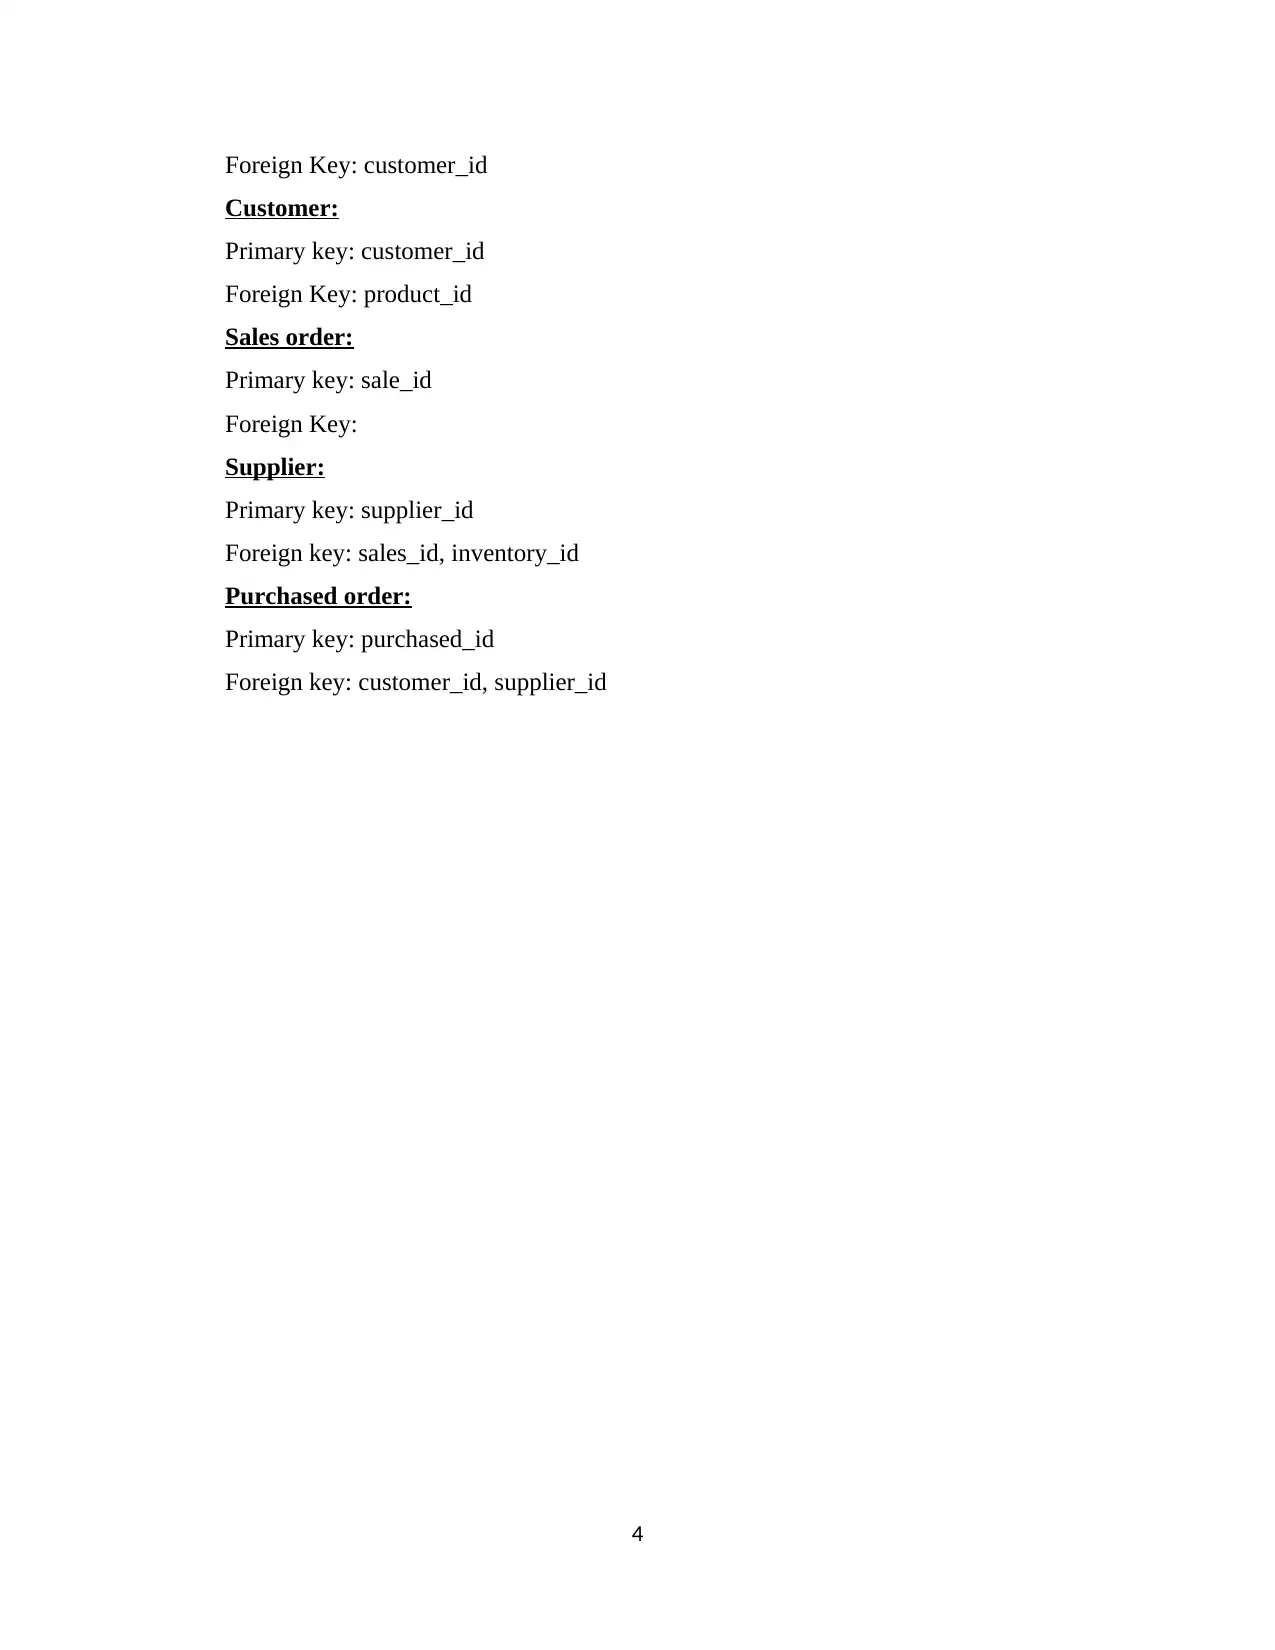
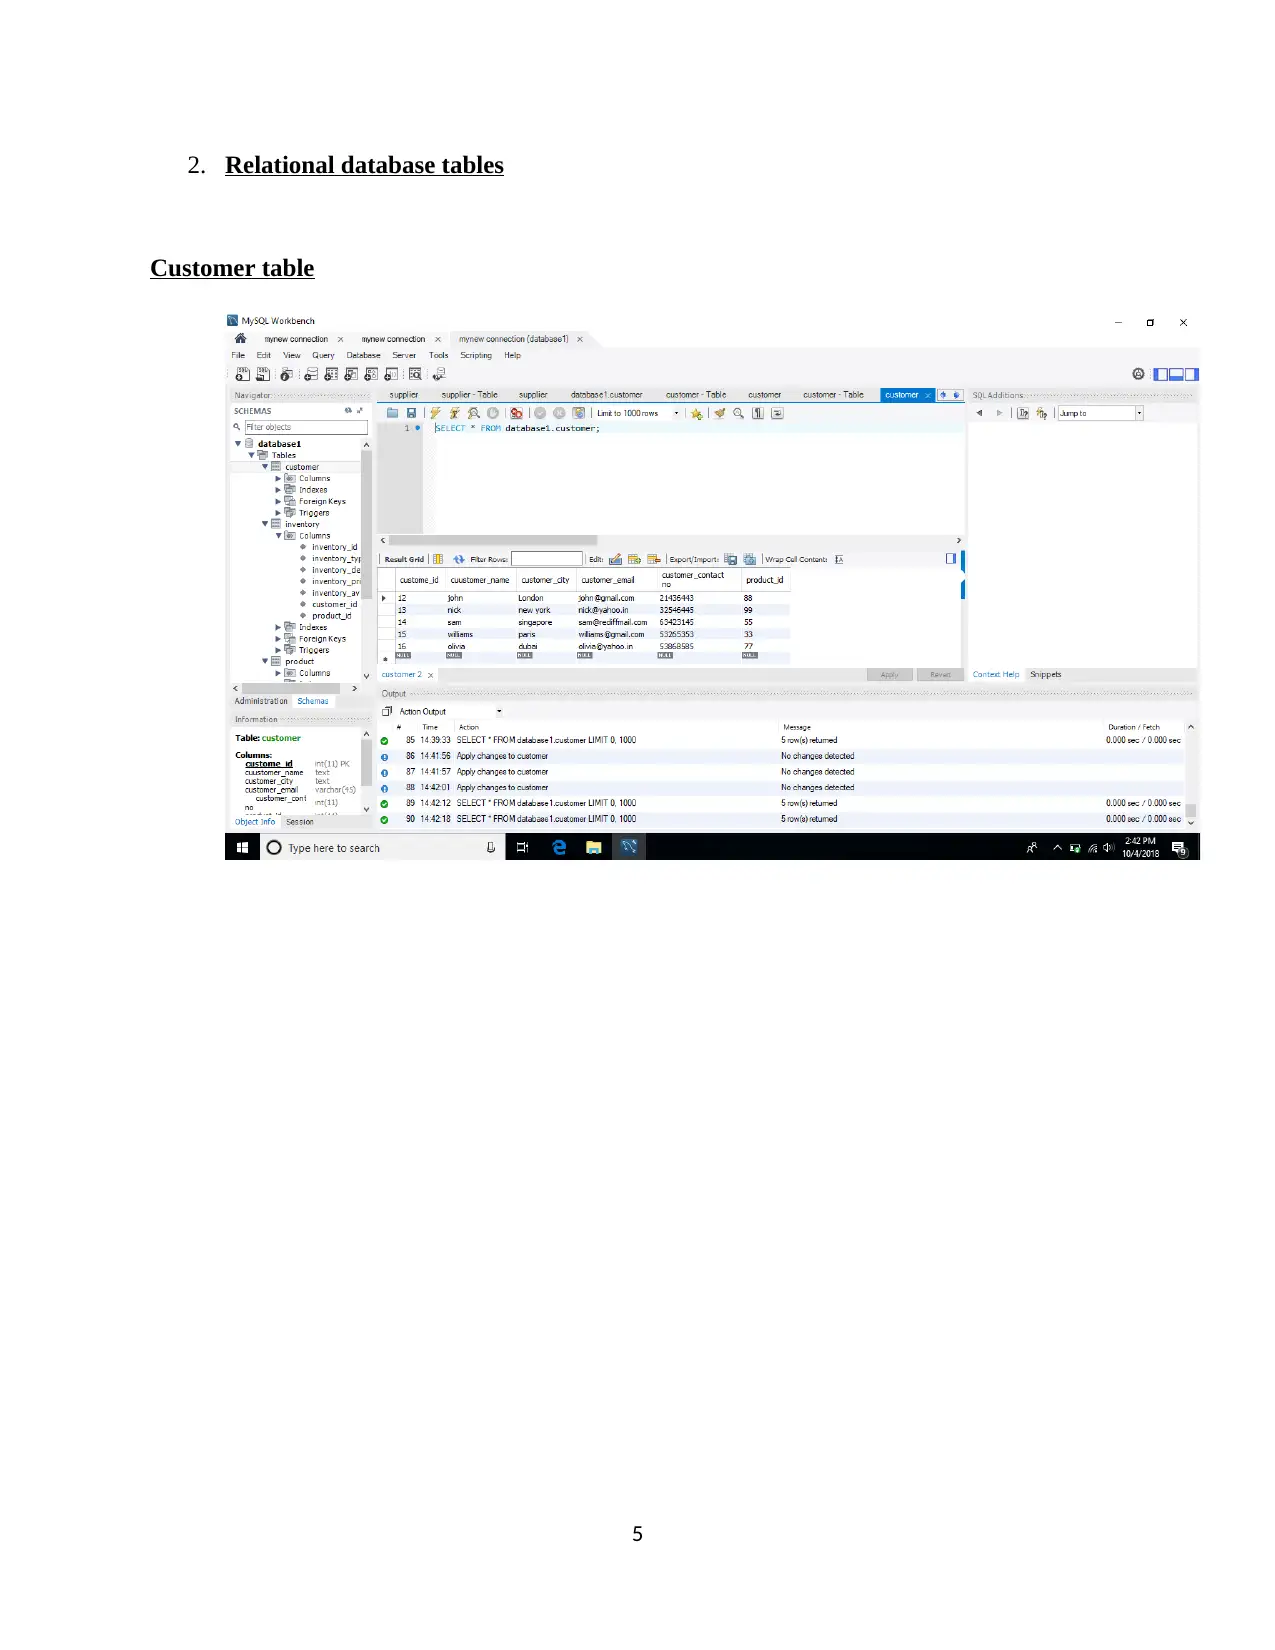
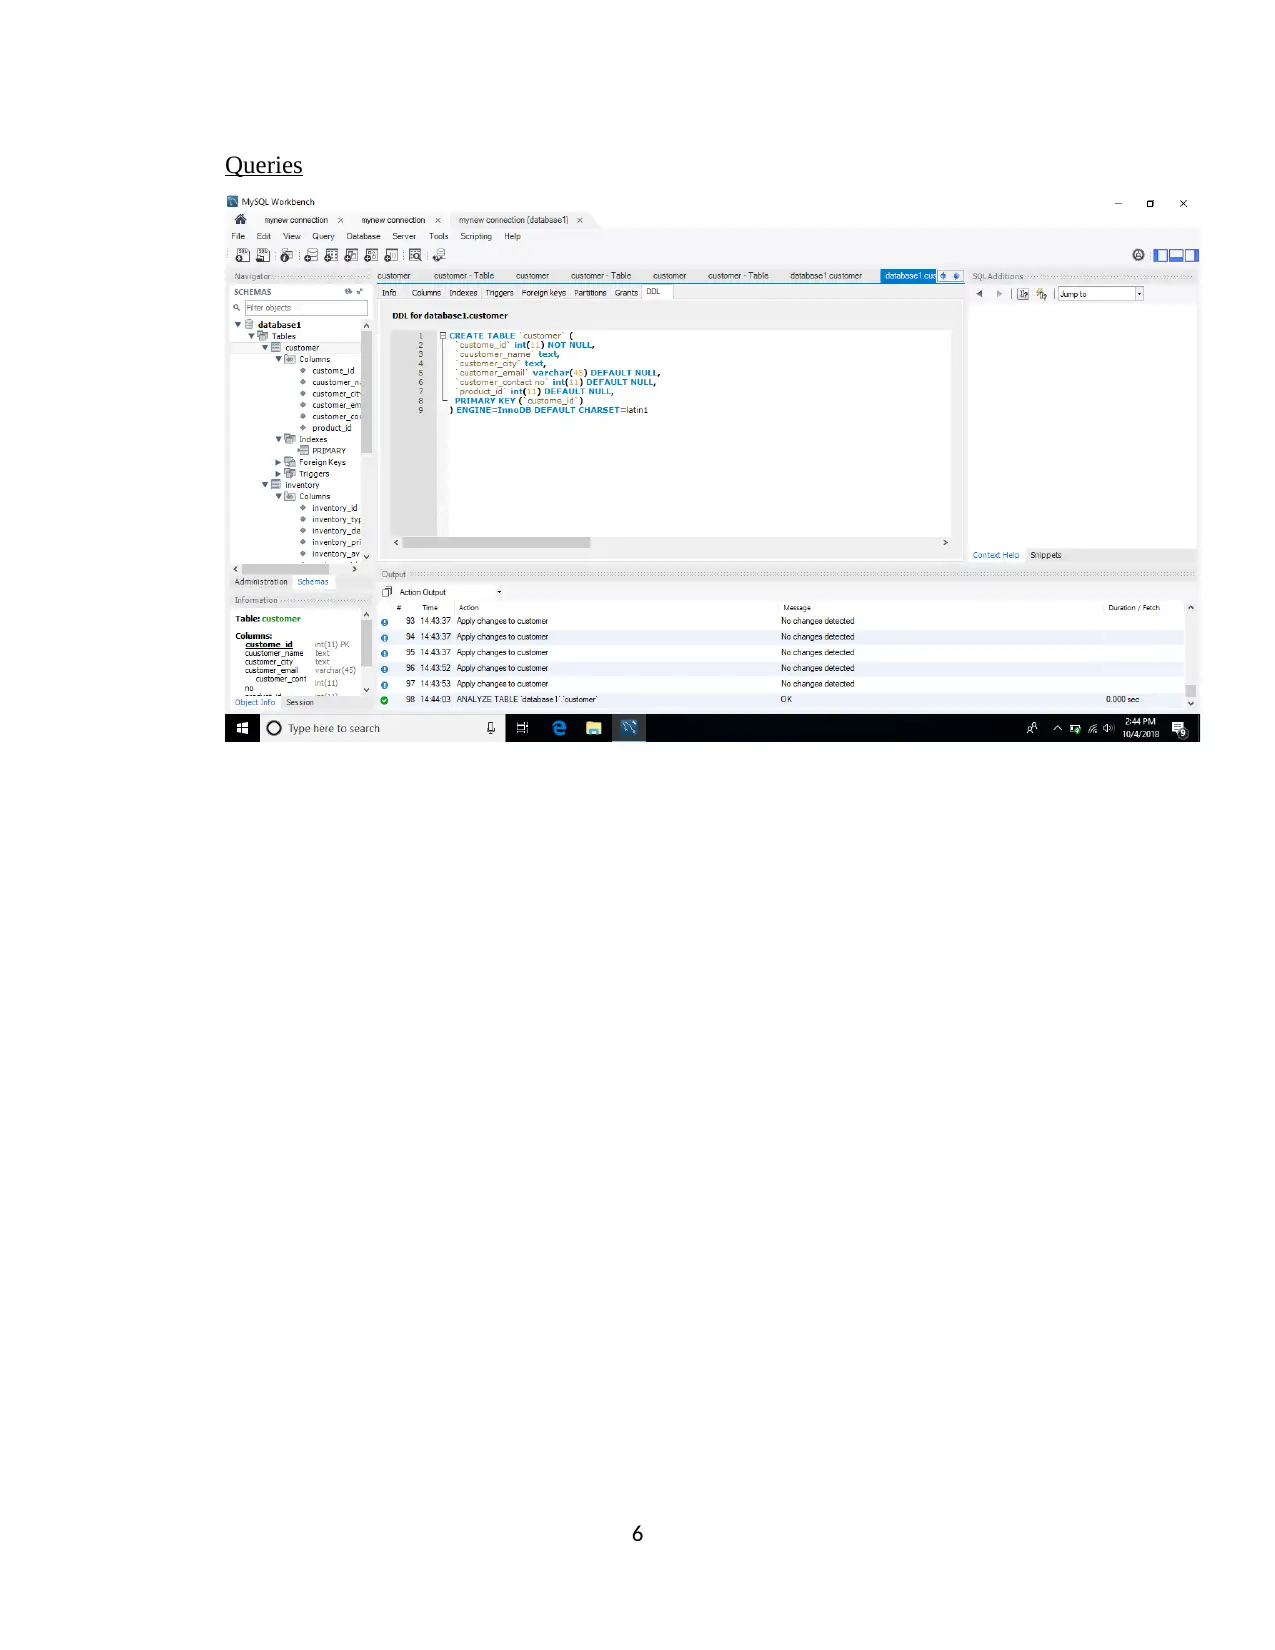
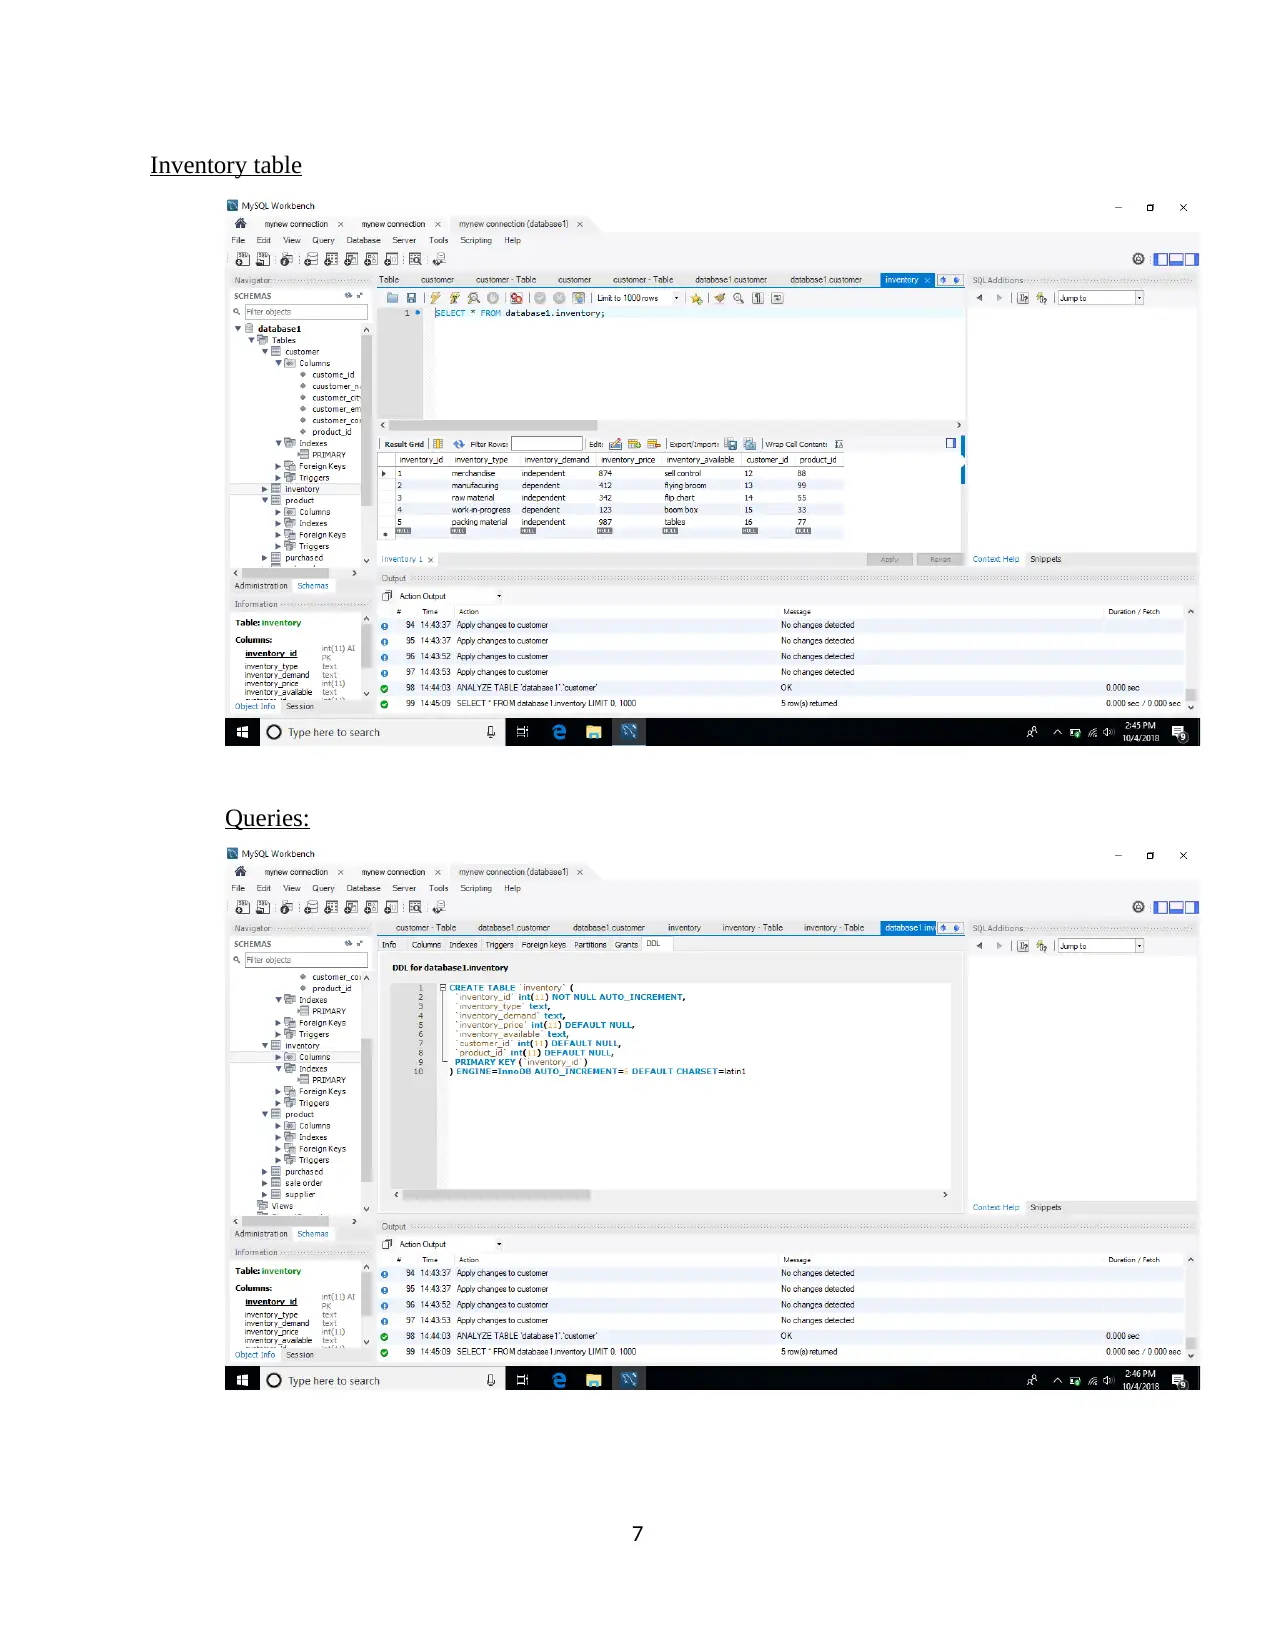
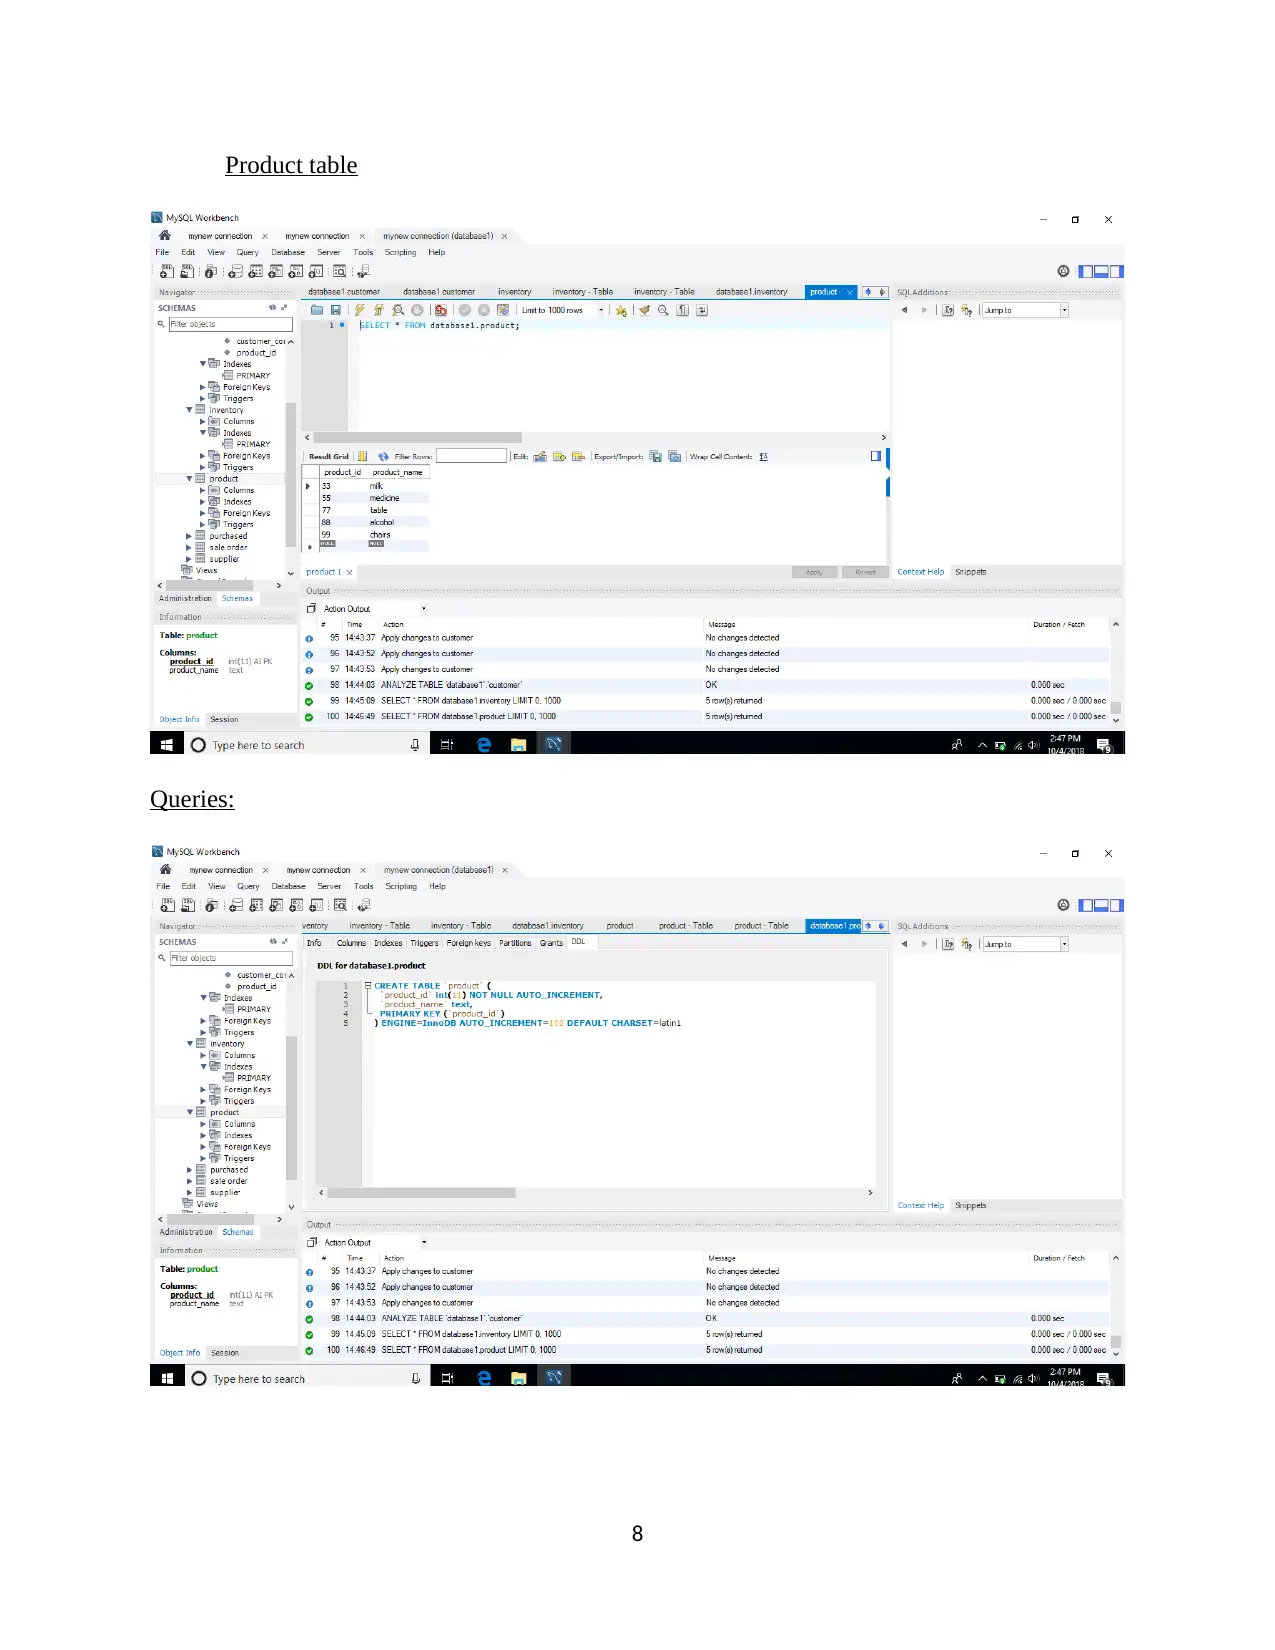
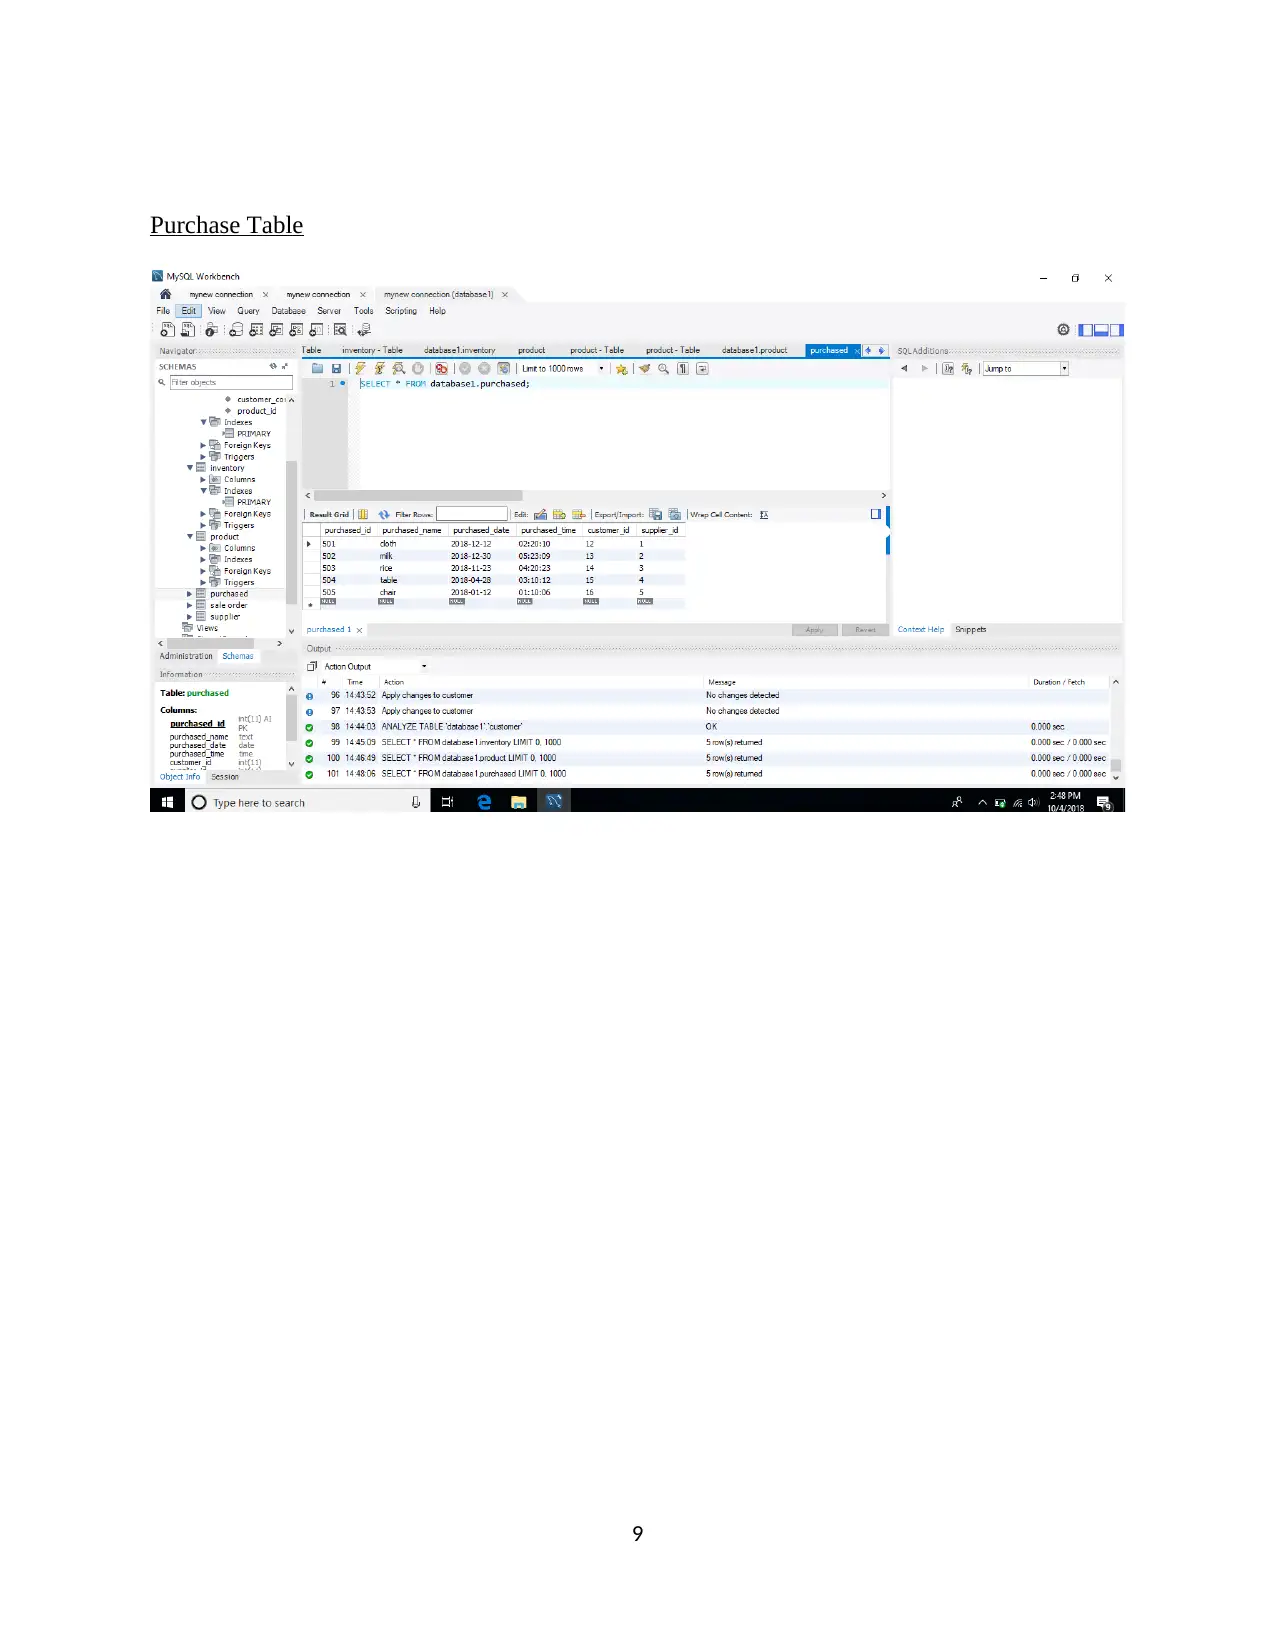
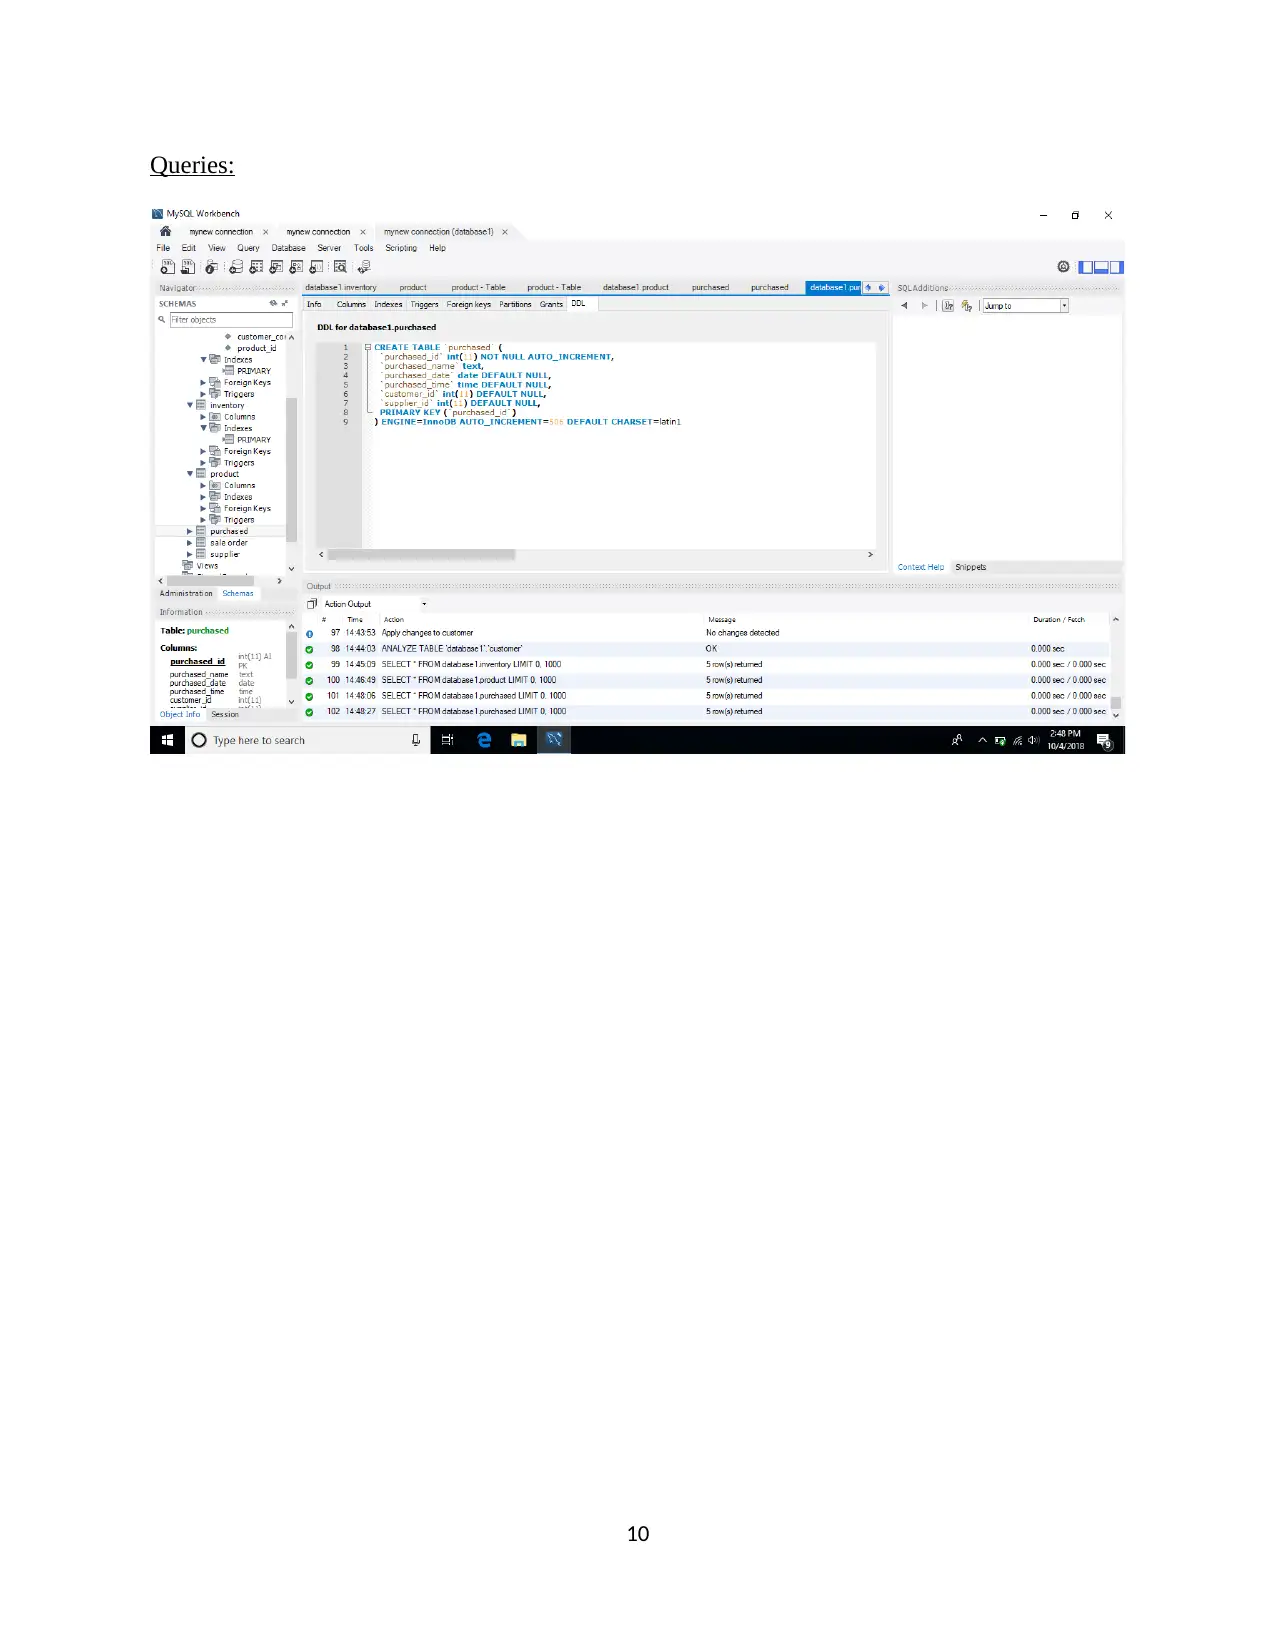
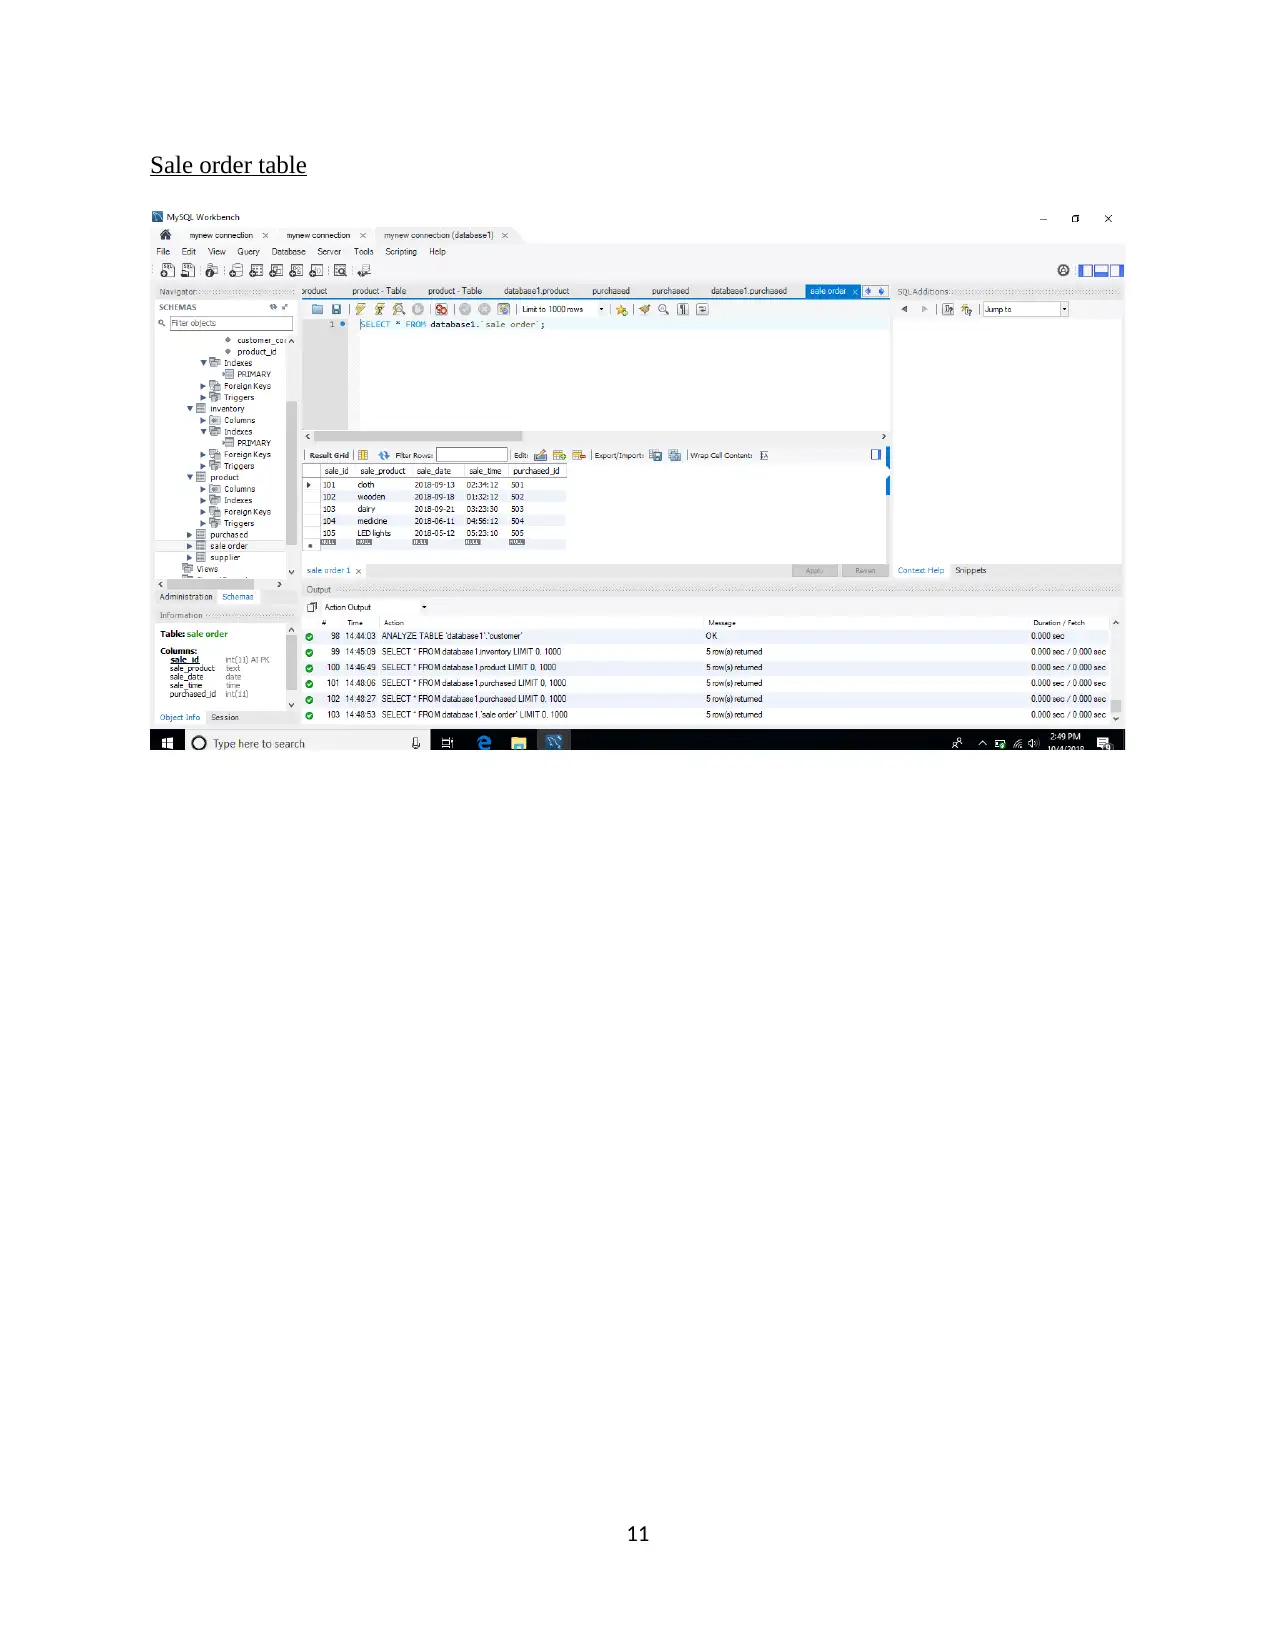
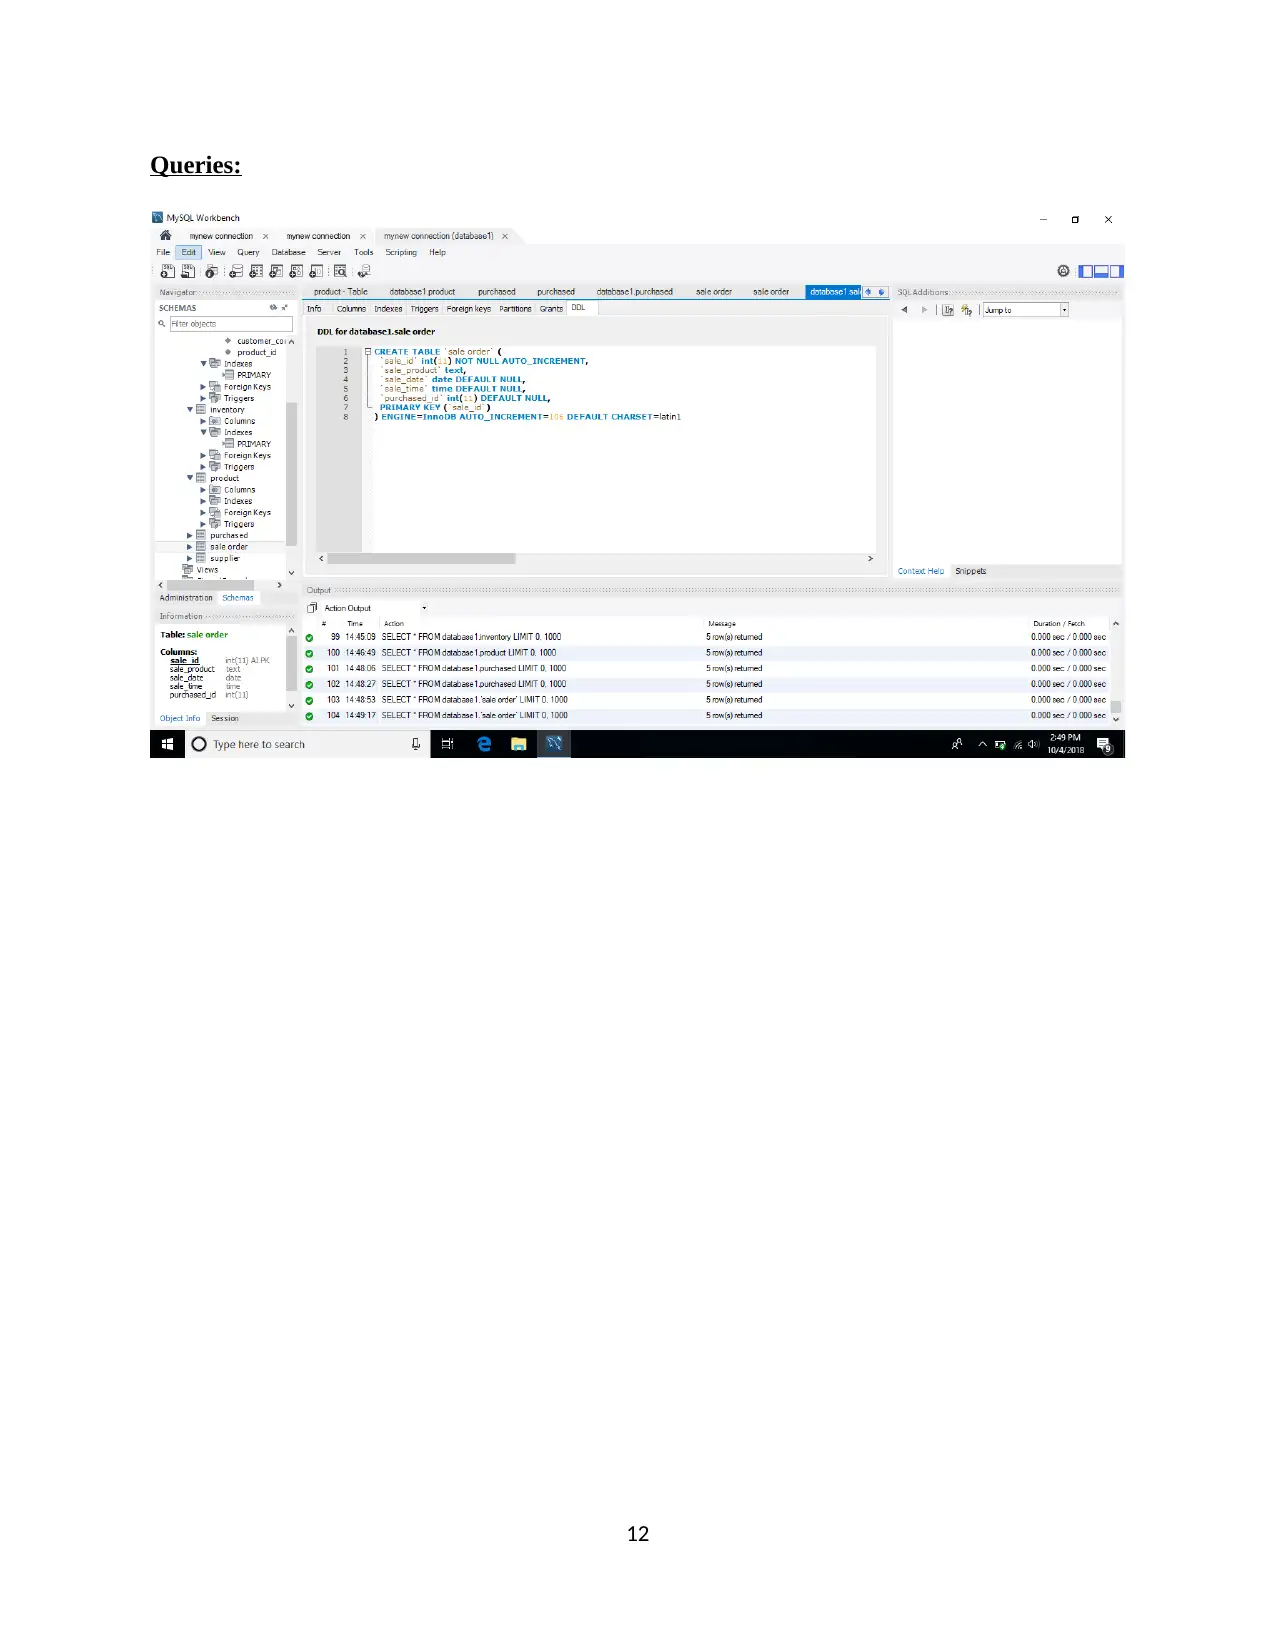
This report delves into the principles of database design, focusing on relational databases, entity-relationship diagrams, and normalization techniques. It explores the use of MS Access and MySQL for database implementation, including the design of tables, primary and foreign keys, and the formulation of database queries. The report also examines the application of pivot tables and charts within Microsoft Excel for data analysis and visualization, using datasets to represent product information, order details, and demographic data. The analysis includes examples of data sorting, aggregation, and the creation of pivot charts to provide insights into various datasets. The report concludes with a successful design of an efficient database system and an analysis of pivot tables and charts by using Microsoft Excel.
tabler-icon-diamond-filled.svg

Contribute Materials

Your contribution can guide someone’s learning journey. Share your documents today.
Document Page
Database design in MS Access and MYSQL
1
tabler-icon-diamond-filled.svg

Secure Best Marks with AI Grader

Need help grading? Try our AI Grader for instant feedback on your assignments.
Document Page
TABLE OF CONTENTS
INTRODUCTION…………………………………………………………….………4
PART 1……………………………………………………………………………...…4
PART 2……………………………………………………………………….……….11
CONCLUSION…………………………………………………………………….…15
2
Document Page
INTRODUCTION
Database is a collection of elements that manage, update, insert, retrieve the information
in form of tables and columns. This report will discuss about relational database and analyses the
information and data. It also designs an effective and efficient database that help for managing
the entire database in a proper manner.
PART 1
1. Entity relationship diagram
Figure: 1
Entity relationship diagram is a graphical representation which help for providing the
information of particular organizations. Entity relationship diagram is creating an
effective relationship between entities and attributes. Fig: 1 show entities and their
specific attributes.
Entities:
Primary key:
Foreign key:
For Example-
Inventory:
Primary key: inventory_id
3
Document Page
Foreign Key: customer_id
Customer:
Primary key: customer_id
Foreign Key: product_id
Sales order:
Primary key: sale_id
Foreign Key:
Supplier:
Primary key: supplier_id
Foreign key: sales_id, inventory_id
Purchased order:
Primary key: purchased_id
Foreign key: customer_id, supplier_id
4
tabler-icon-diamond-filled.svg

Secure Best Marks with AI Grader

Need help grading? Try our AI Grader for instant feedback on your assignments.
Document Page
2. Relational database tables
Customer table
5
Document Page
Queries
6
Document Page
Inventory table
Queries:
7
tabler-icon-diamond-filled.svg

Paraphrase This Document

Need a fresh take? Get an instant paraphrase of this document with our AI Paraphraser
Document Page
Product table
Queries:
8
Document Page
Purchase Table
9
Document Page
Queries:
10
tabler-icon-diamond-filled.svg

Secure Best Marks with AI Grader

Need help grading? Try our AI Grader for instant feedback on your assignments.
Document Page
Sale order table
11
Document Page
Queries:
12
Document Page
Supplier table
Queries
13
tabler-icon-diamond-filled.svg

Paraphrase This Document

Need a fresh take? Get an instant paraphrase of this document with our AI Paraphraser
Document Page
3. Normalization:
Normalization is a technique and process which help in identifying the relationship between two
tables. It also determines the data dependence and reduces redundancy in database table.
3NF (Normal Form)- this normal form will have data dependencies between table and it also
reduces tables into single forms.
1NF (Normal Form)- this normalization form will contain single value and unique identifiers. On
the other hand, it will contain only atomic values and each attributes contains single values.
2NF (Normal Form)- In 2nd normal forms, all non-key attributes are dependent on primary key.
For Example-
Both table contains the information of product in customer table and product tables. This
relationship exists in 2 normal forms.
14
Document Page
Forms: -
Both the forms are linked with each other that contains information of sales and purchase order.
15
Document Page
PART 2
Figure :2.1
By using excel, it can create data and analyze the needs and requirements of organization. The
information of company would be mentioned in form of pivot table that represents product
information and order details.
This figure will show the pivot table options to create an effective pivot table in effective
manner.
16
tabler-icon-diamond-filled.svg

Secure Best Marks with AI Grader

Need help grading? Try our AI Grader for instant feedback on your assignments.
Document Page
Figure: 2.2
These are data of organization which store the information of areas and their code, people age of
male and female. It is also known as large data set that contain large amount of information in it.
Figure: 2.3
17
Document Page
This figure shows to calculate the total number of male and female leaving in Australia and there
are different number of city situated in Australia.
Figure: 2.4
This figure represents the sum of people under the age between 16 to 74. Pivot chart is
representing data in the form of graphs.
18
Document Page
Figure: 2.5
These are another dataset that contain the information of Australian application number, entities,
country, postcode and id etc. All the information representing in excel sheet.
19
tabler-icon-diamond-filled.svg

Paraphrase This Document

Need a fresh take? Get an instant paraphrase of this document with our AI Paraphraser
Document Page
Figure: 2.6
This figure is representing the data of Australian application number of particular country and
also provide the total count of application in Australian.
20
Document Page
There are different country name and also have specific application id of particular subject.
In this figure, select the specific country code and identify the sum of ipad_id of particular
country. In this way, it can sort the data in proper manner.
21
Document Page
These are pivot data that could be arranged in the form of table to analyze range of particular
dataset. The data in the organization for managing their products and order details in an effective
manner.
URL of data set:
https://data.london.gov.uk/dataset/census-2001-key-statistics-10-hours-worked
CONCLUSION
As per report, it will be successful design of an efficient database system and also
analyzing the pivot table and chart by using Microsoft excel.
22
chevron_up_icon
1 out of 22
circle_padding
hide_on_mobile
zoom_out_icon
logo.png

Your All-in-One AI-Powered Toolkit for Academic Success.

Available 24*7 on WhatsApp / Email

[object Object]