Database Design Report: Planning, ERD, and Normalization

Verified

Added on  2019/11/26

|16
|1938
|339
Report
AI Summary
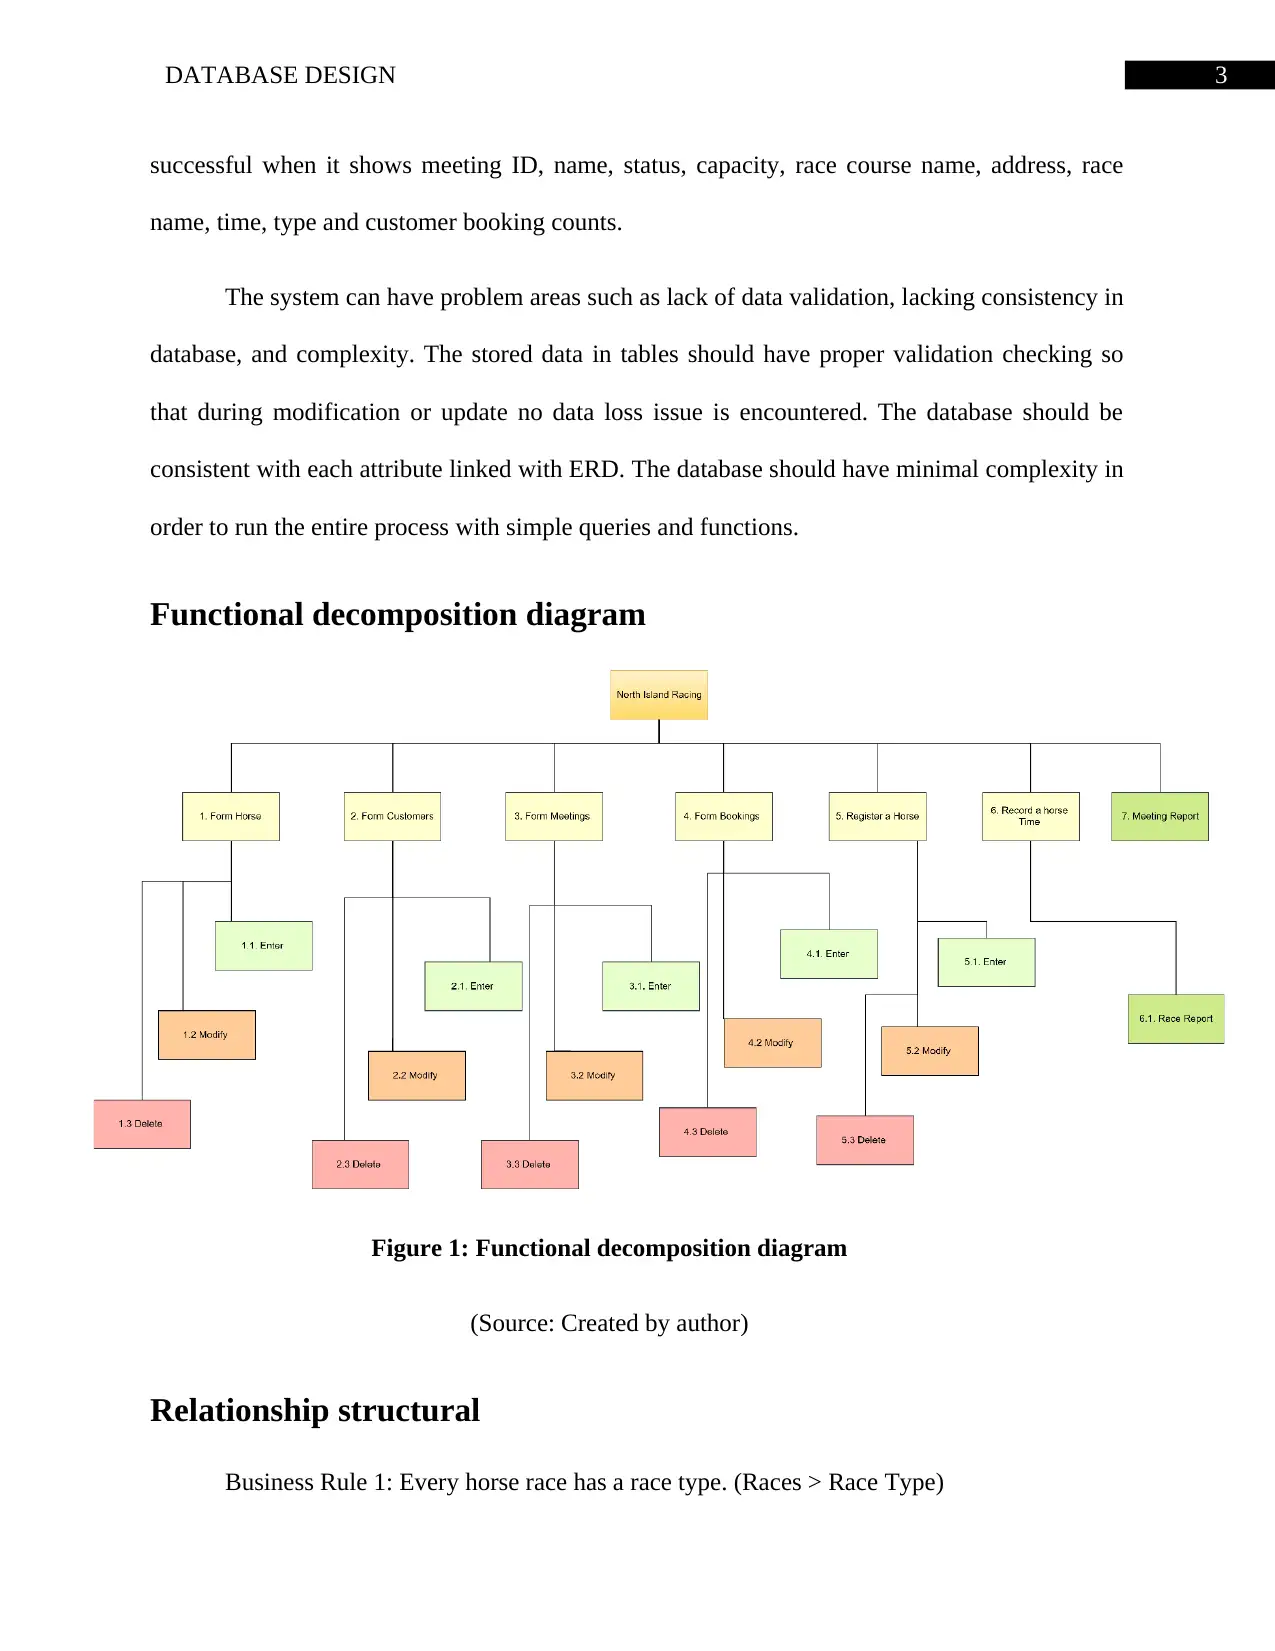
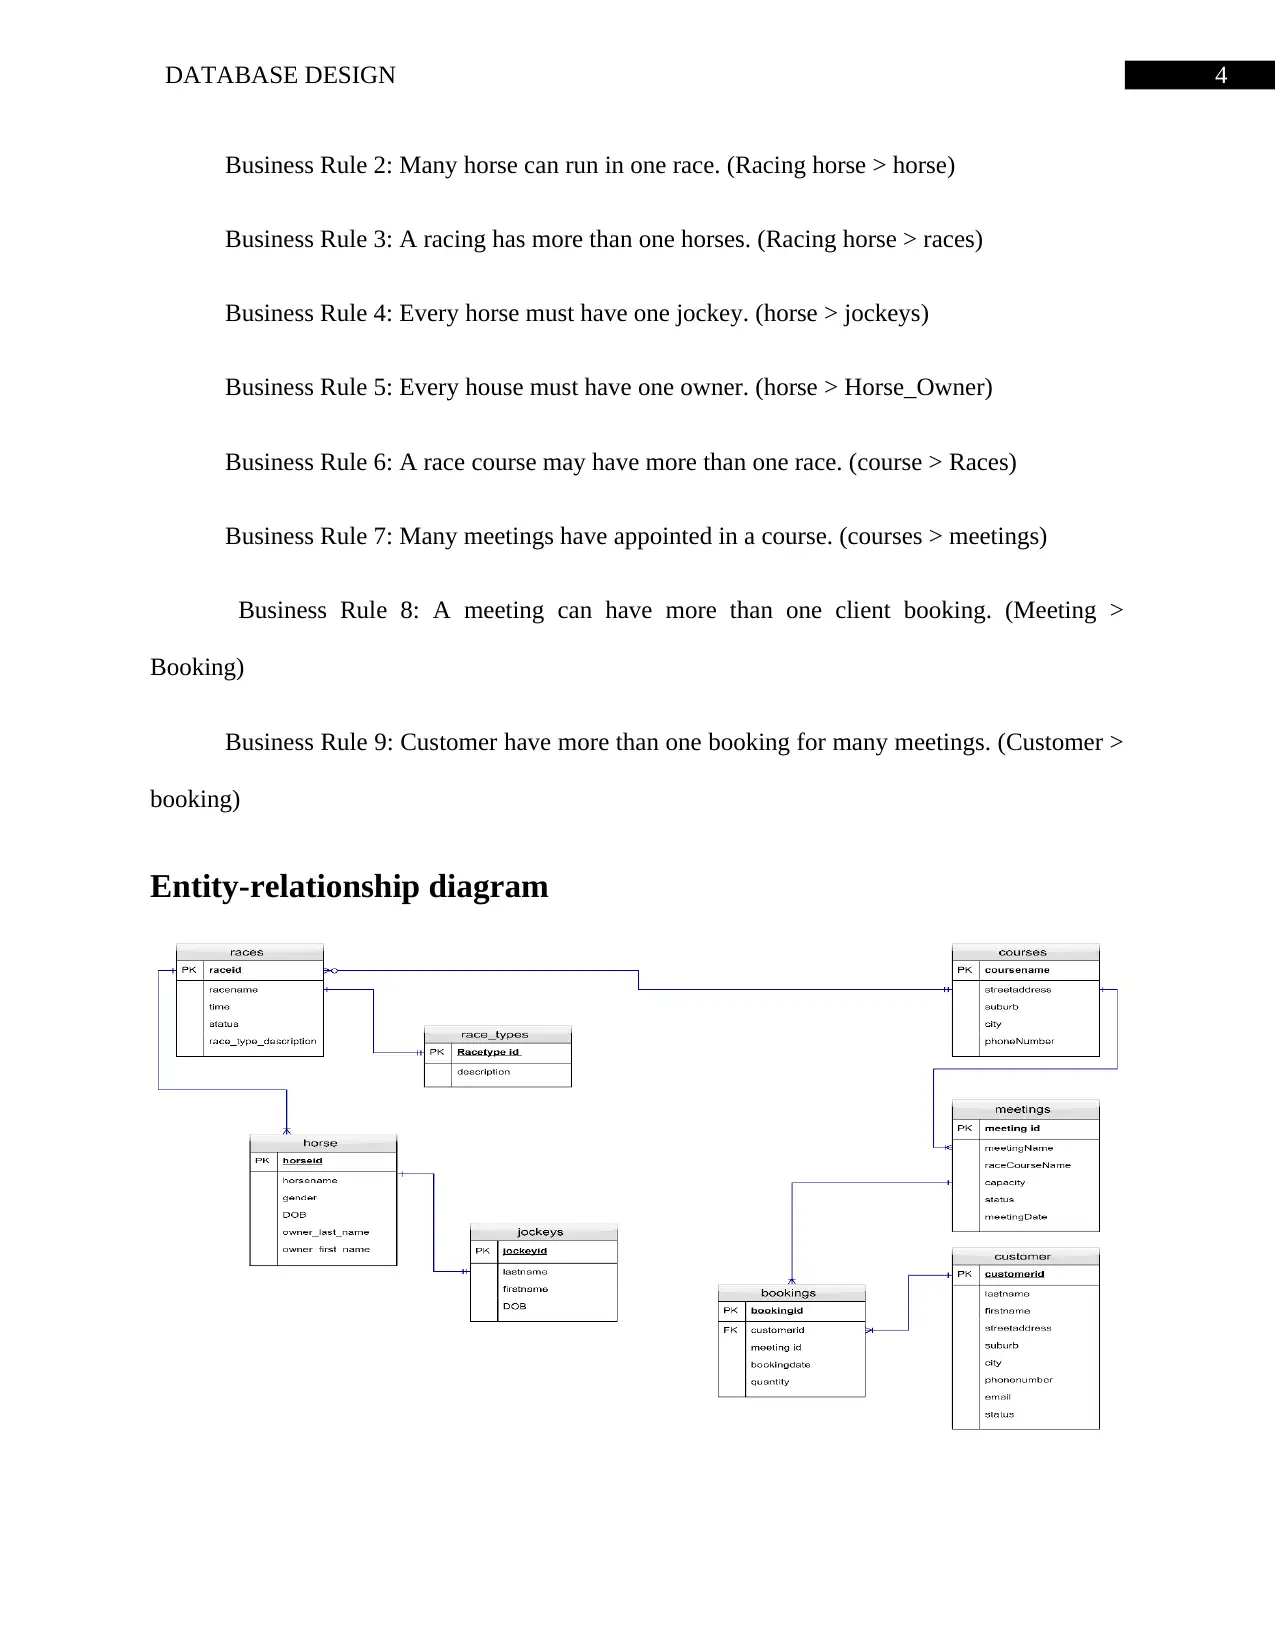
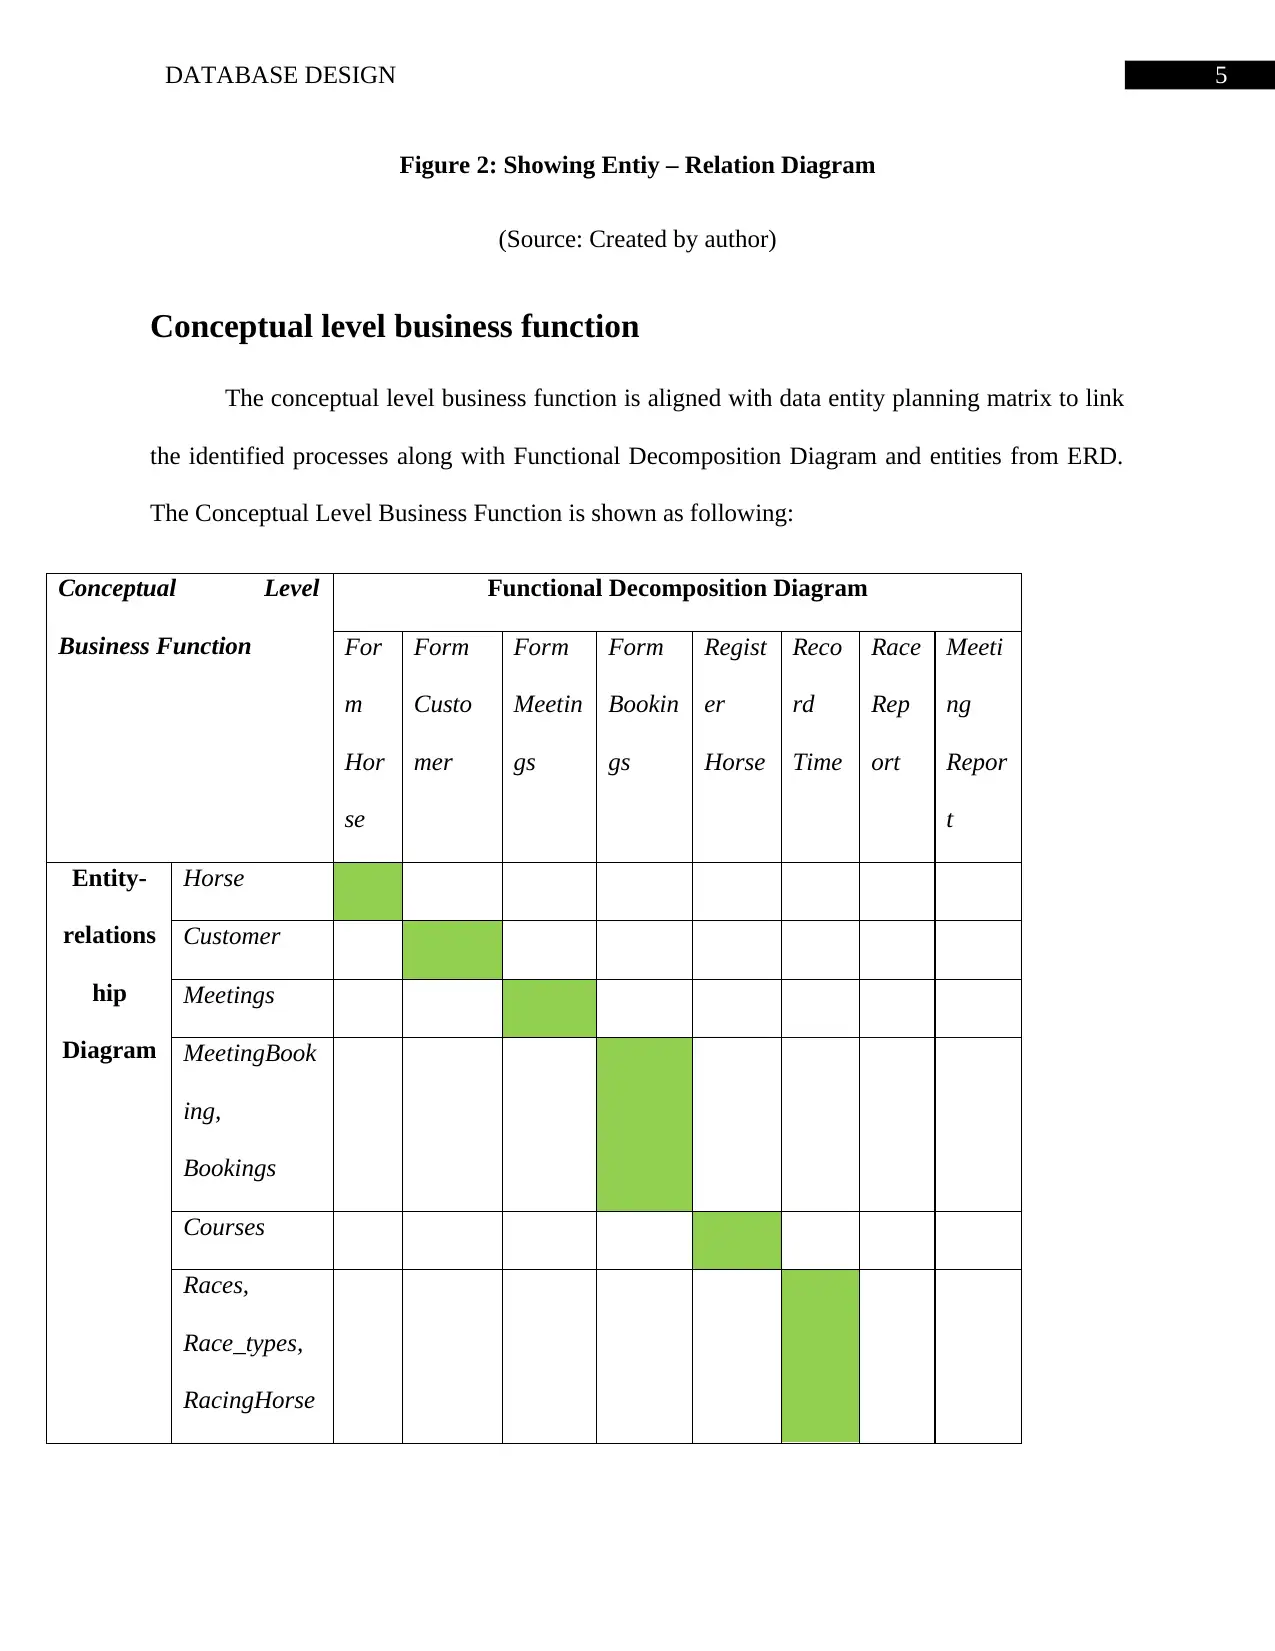
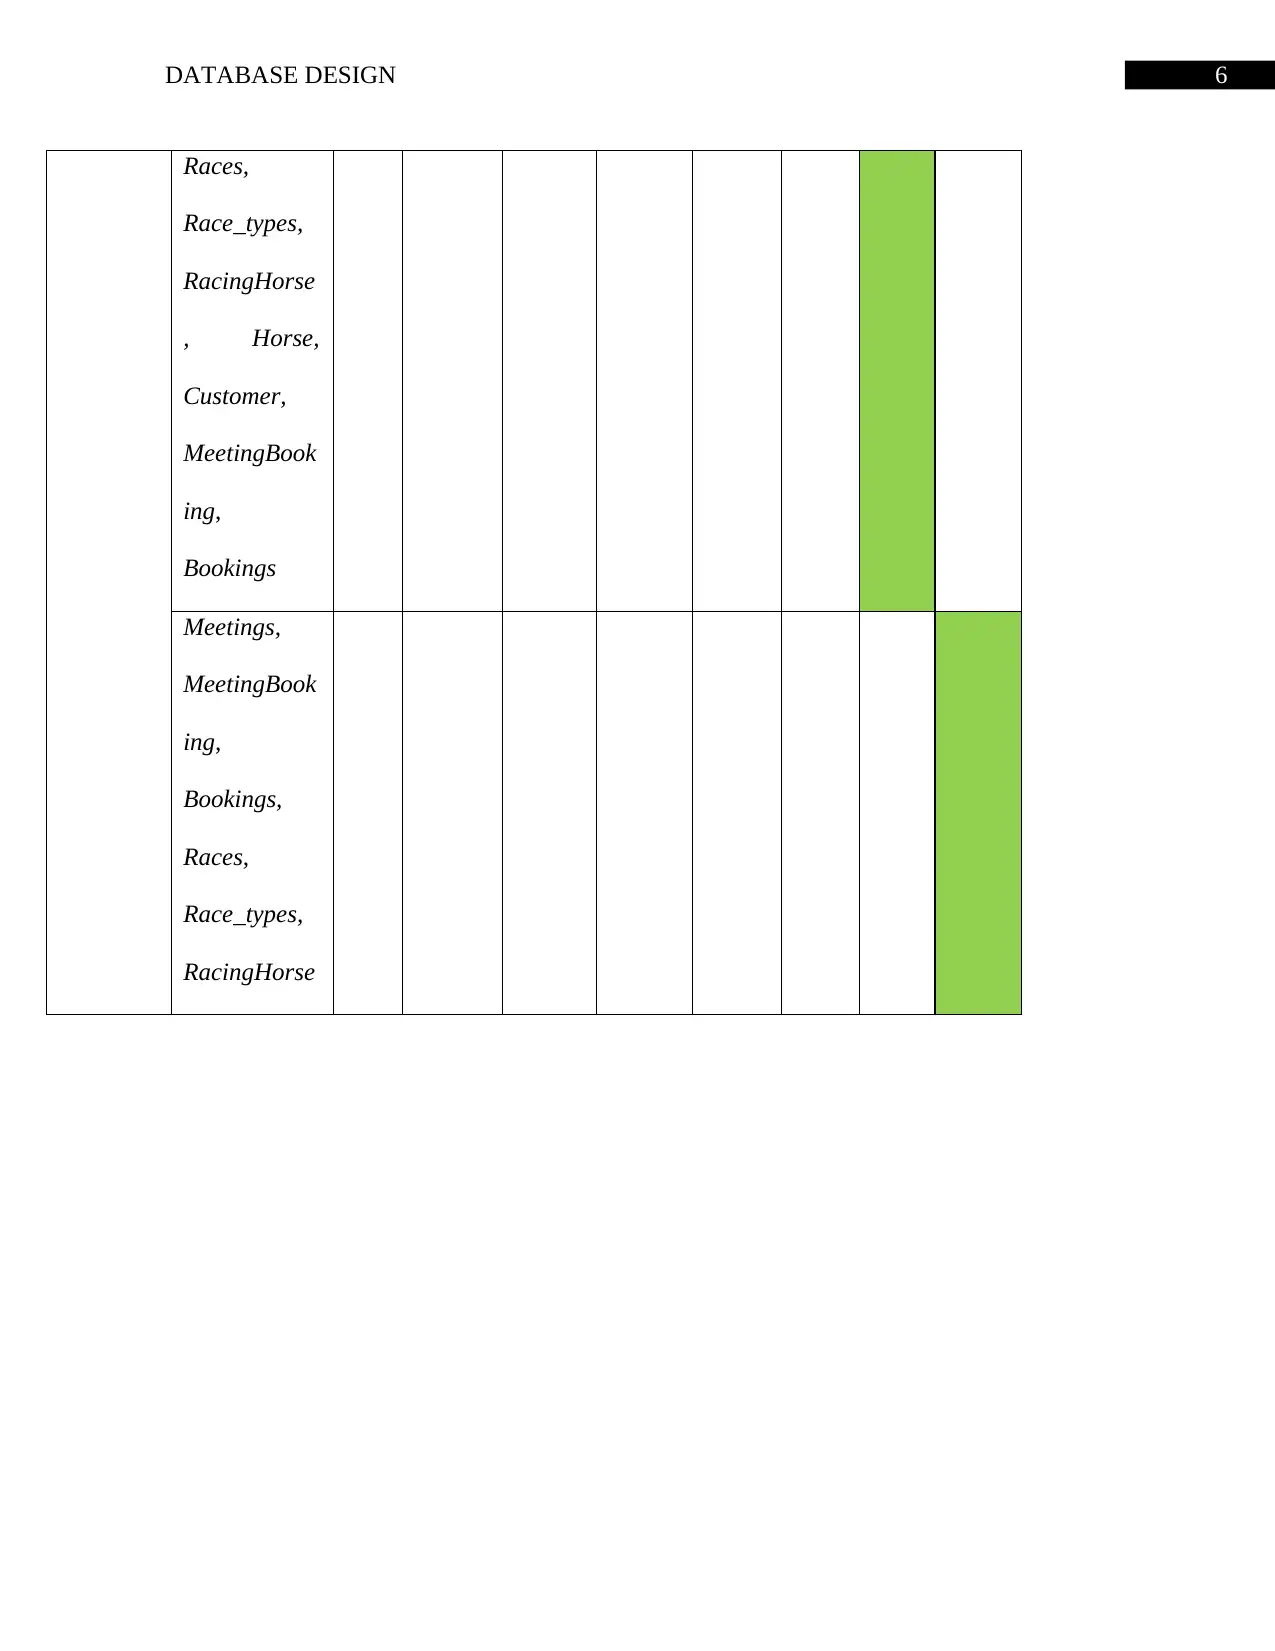
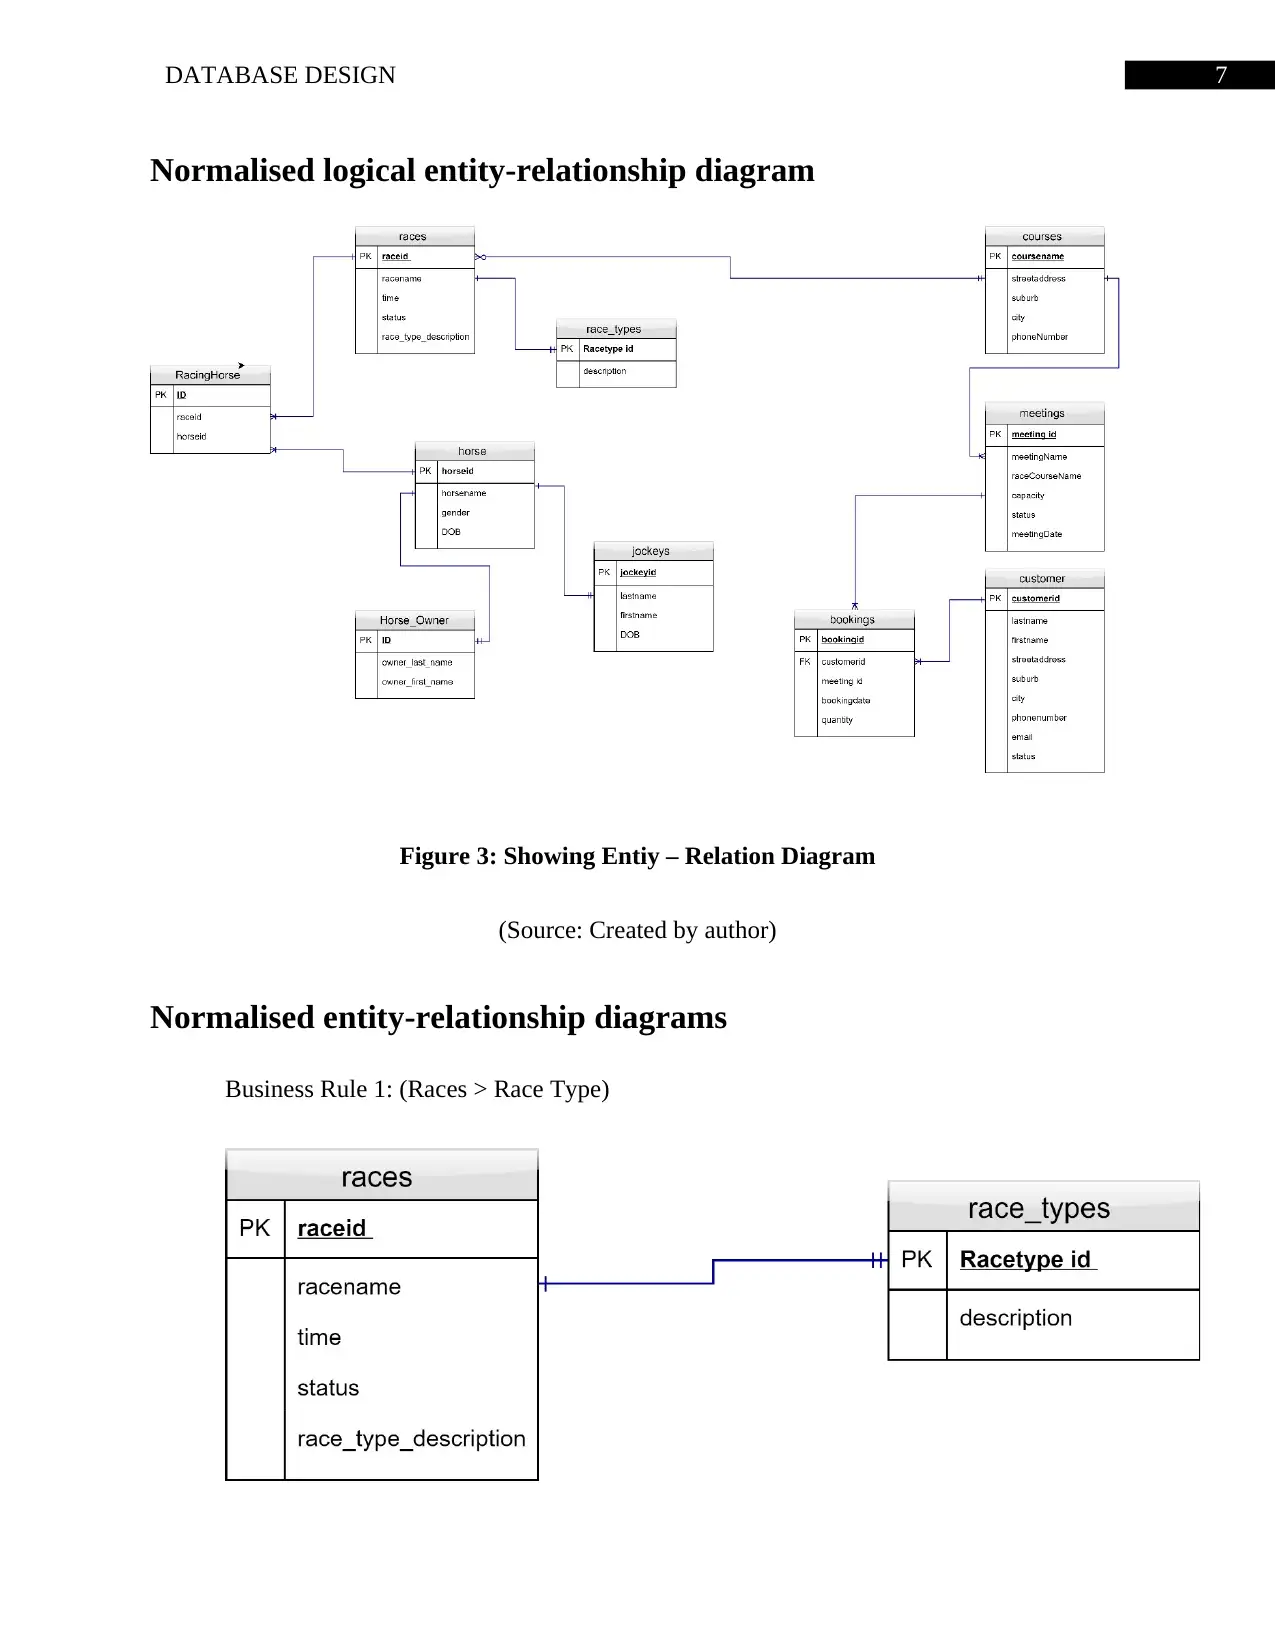
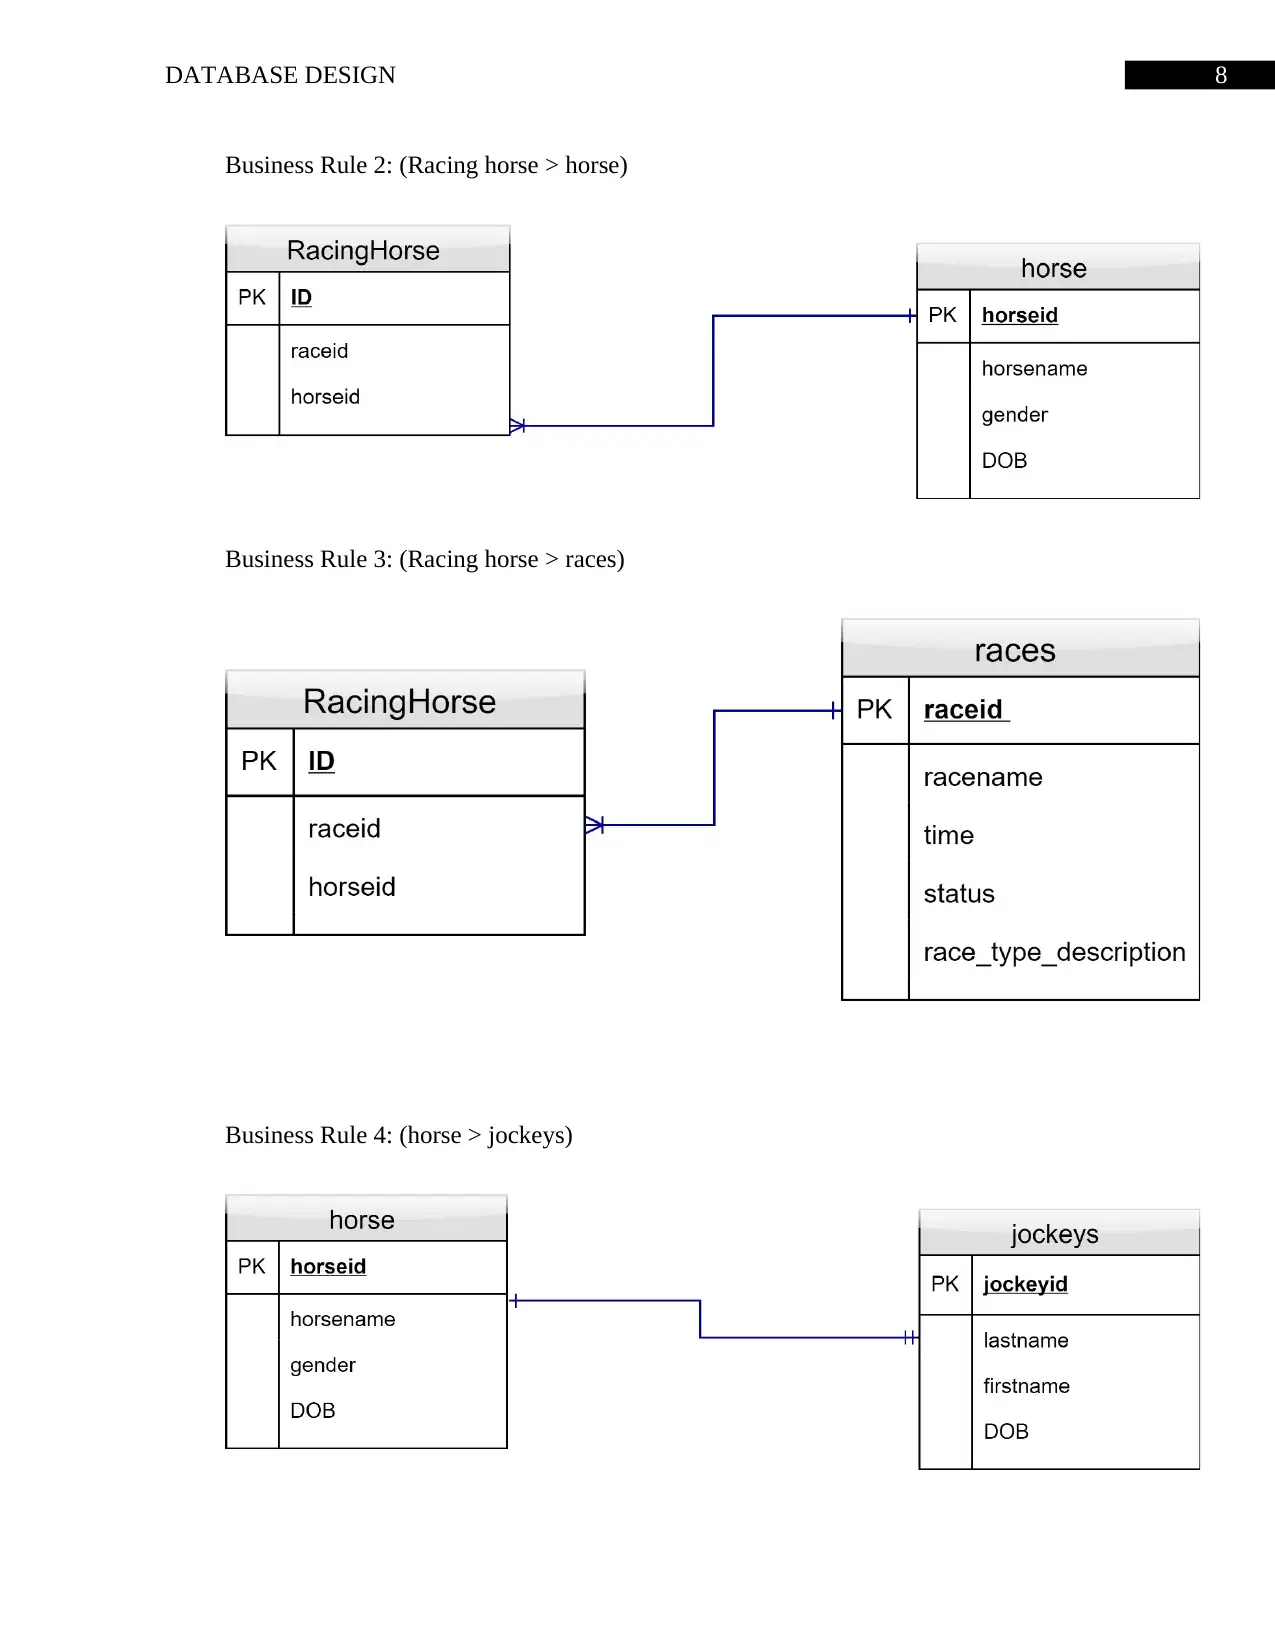
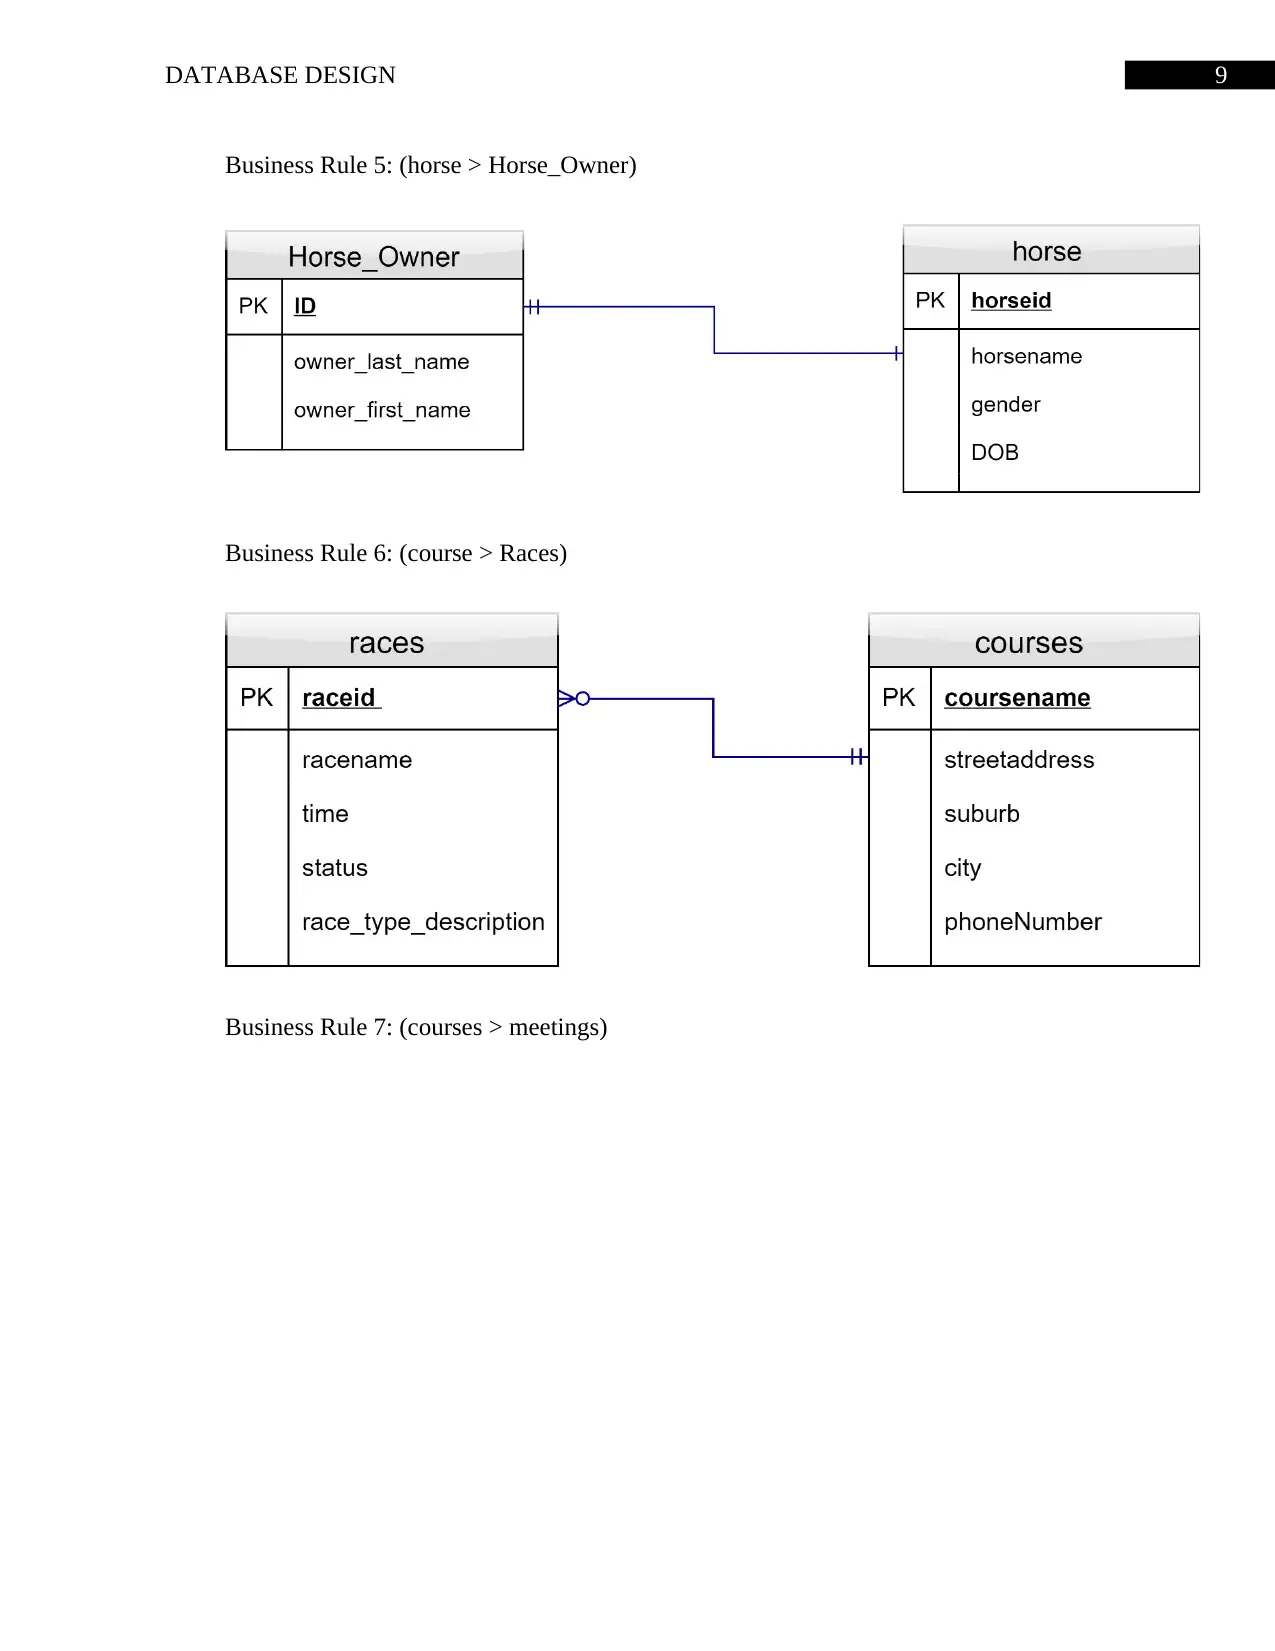
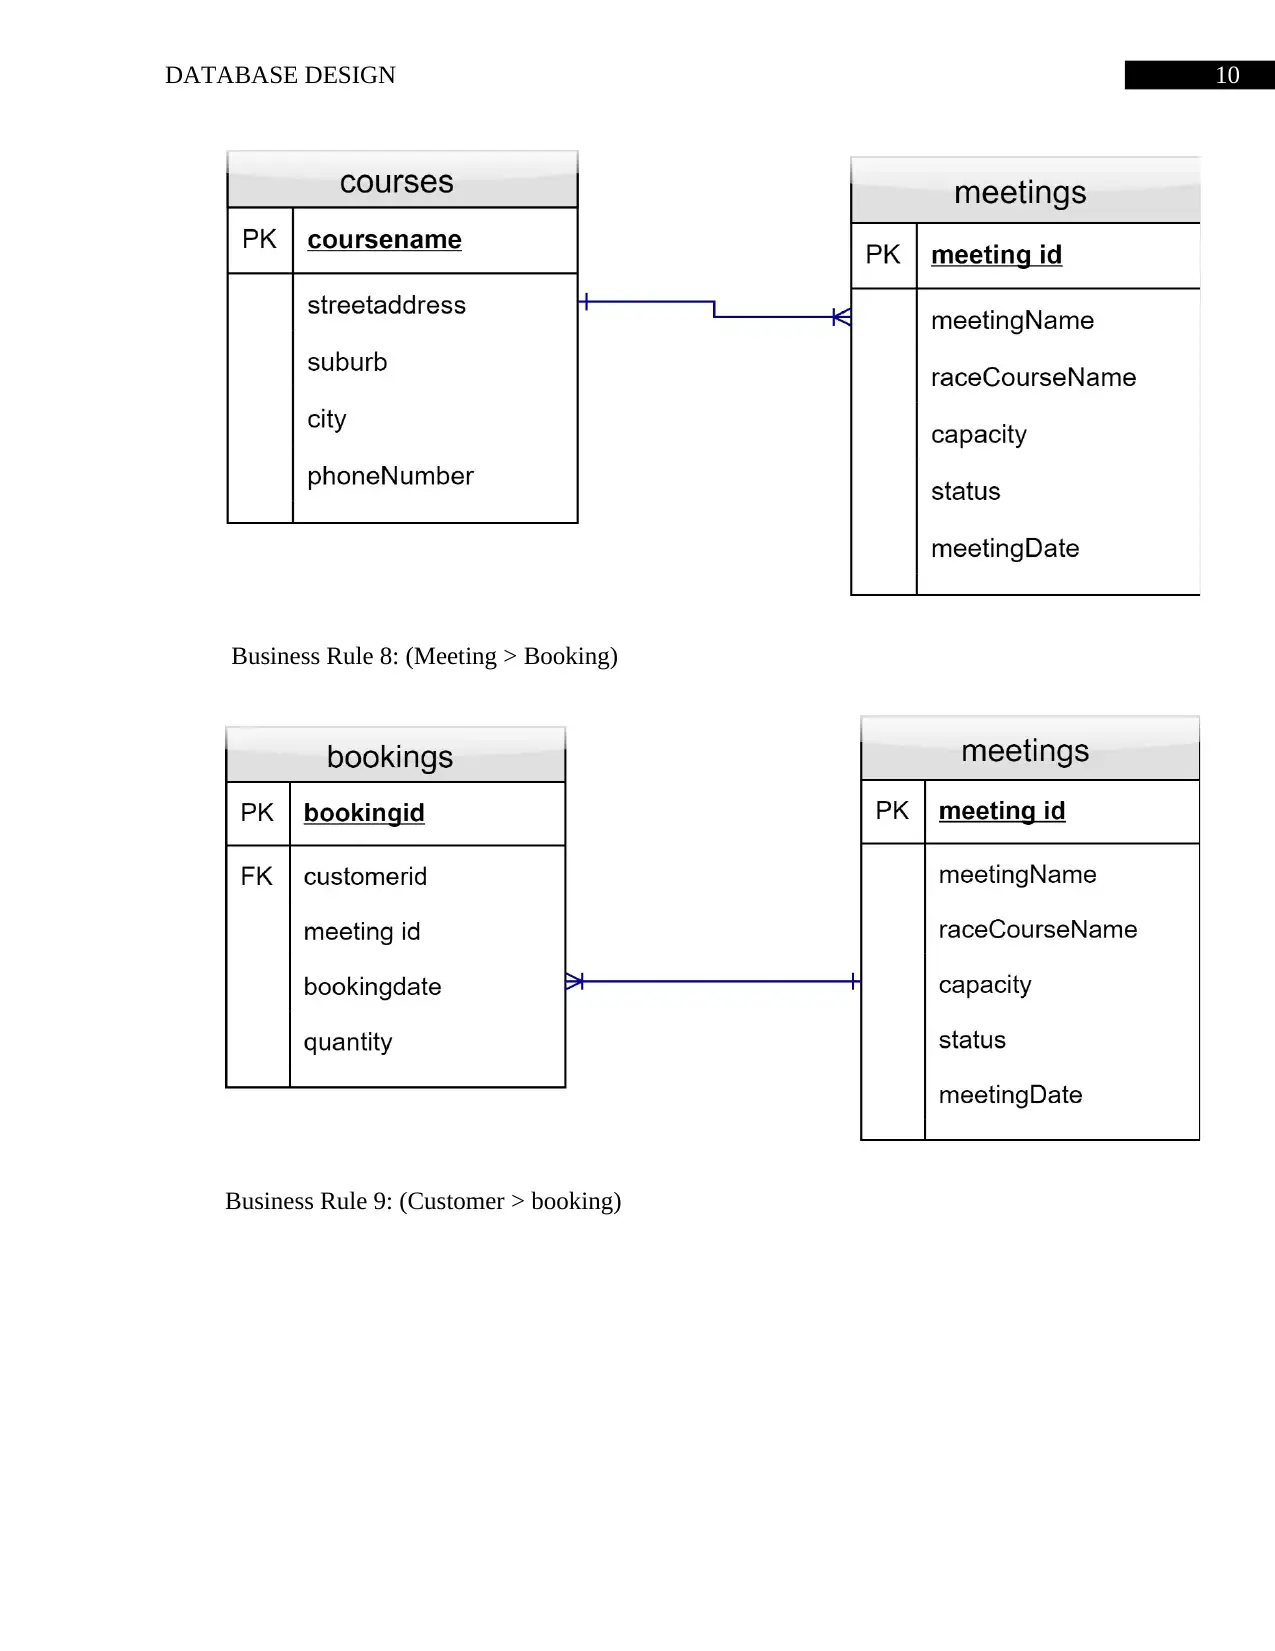
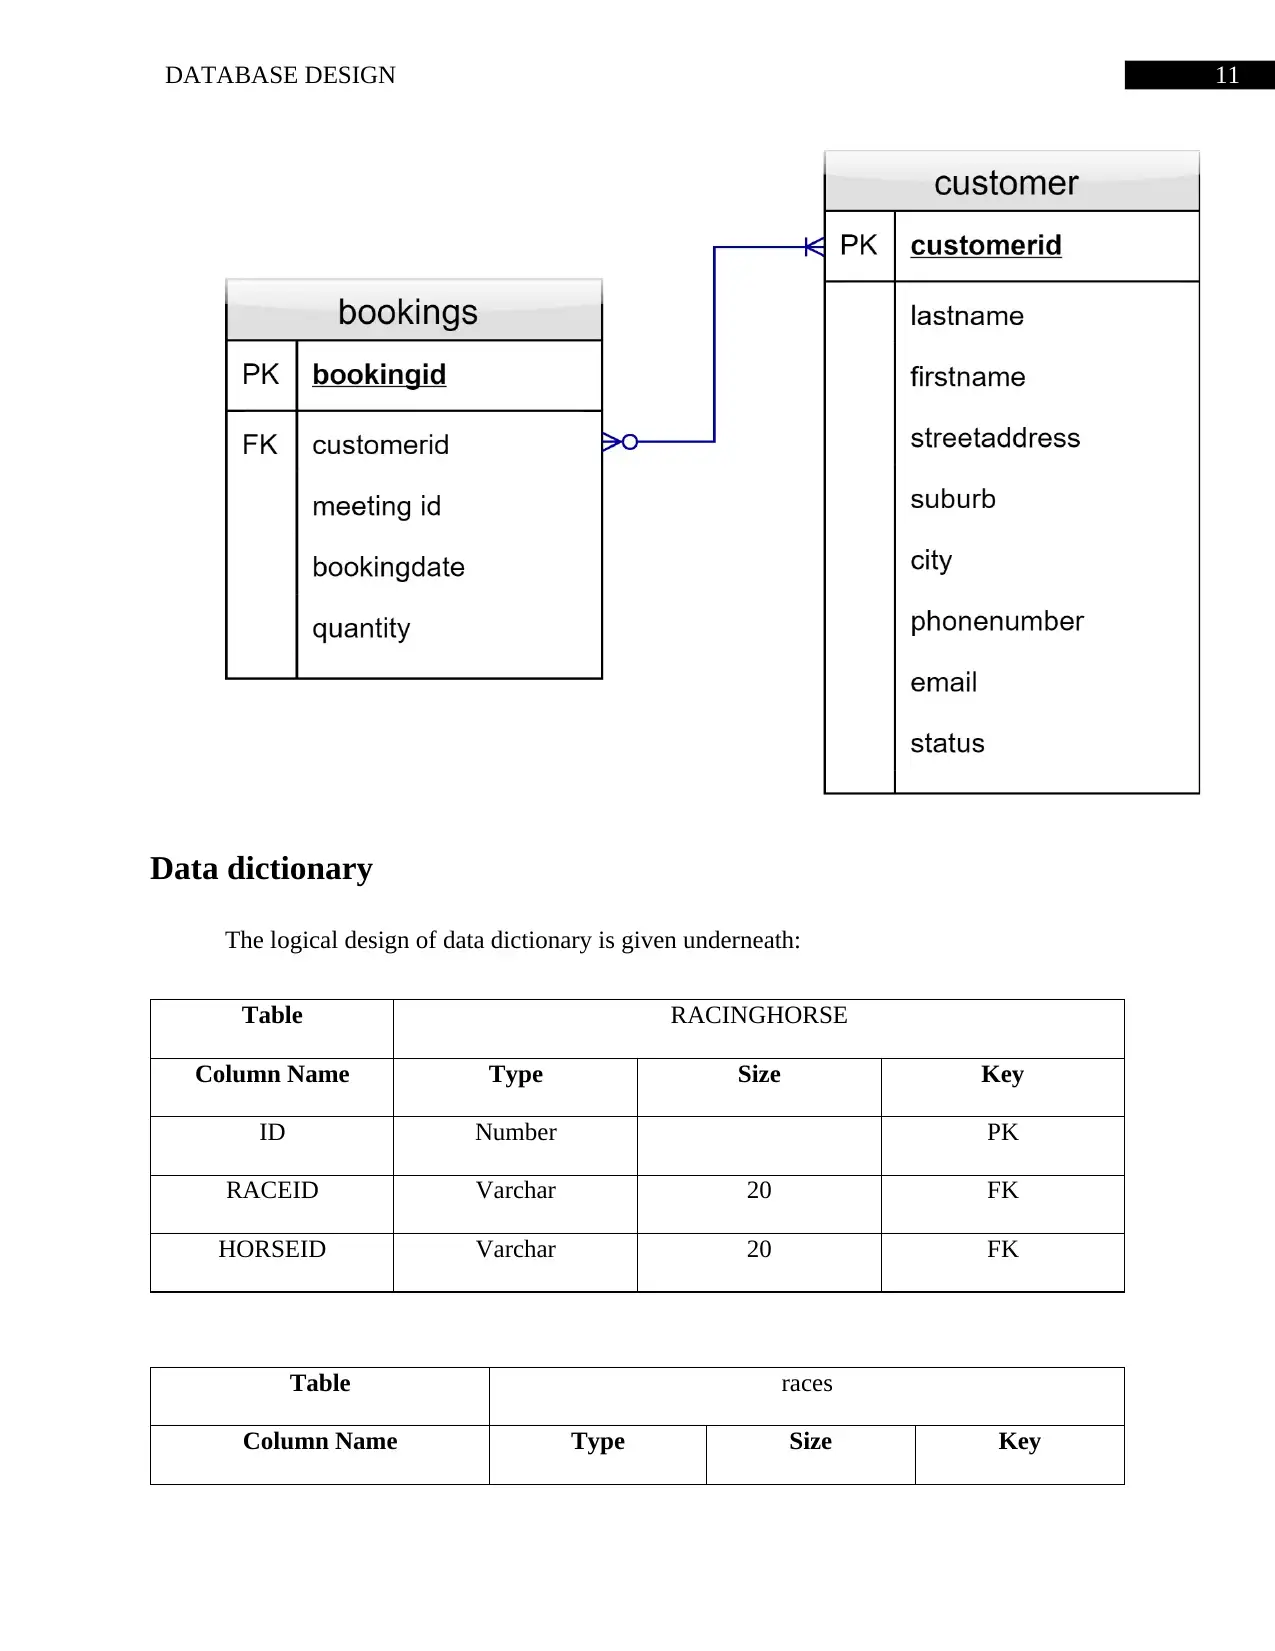
This report details a database design project, starting with strategic planning factors that outline organizational goals and success conditions. It includes a functional decomposition diagram to visualize processes and business rules that define relationships between entities. An entity-relationship diagram (ERD) is presented to illustrate the database structure, followed by a conceptual level business function aligned with the ERD and functional decomposition diagram. The report then moves on to a normalized logical entity-relationship diagram and normalized entity-relationship diagrams. A comprehensive data dictionary provides details on table structures and attributes. The project concludes with a bibliography of referenced sources.
Document Page
Running Head: DATABASE DESIGN
Database Design
[Name of the student]
[Name of the University]
tabler-icon-diamond-filled.svg

Paraphrase This Document

Need a fresh take? Get an instant paraphrase of this document with our AI Paraphraser
Document Page
1DATABASE DESIGN
Table of Contents
Introduction......................................................................................................................................2
Strategic planning factors................................................................................................................2
Functional decomposition diagram..................................................................................................3
Relationship structural.....................................................................................................................3
Entity-relationship diagram.............................................................................................................4
Conceptual level business function.................................................................................................5
Normalised logical entity-relationship diagram..............................................................................6
Normalised entity-relationship diagrams.........................................................................................7
Data dictionary...............................................................................................................................10
Conclusion.....................................................................................................................................14
Bibliography..................................................................................................................................15
Document Page
2DATABASE DESIGN
Introduction
The report is aimed to provide a planning section with discussing factors, relationship
structures, ERD diagram, and conceptual level function model. The strategic planning devises
these parts into the report for depicting how planning and entity-relationship diagram shows
alignment of strategy with conceptual diagram. Furthermore, a logical diagram is prepared in the
report formulated from the ERD diagram.
Strategic planning factors
This section obtains organizational initiatives and goals for demonstrating the conceptual
and logical diagram. The organizational goals are included in the planning as following:
1. To standardize the races and meetings in North Island Racing administration
operation
2. To prepare databases with including specific attributes so that designed forms can be
used for manipulating data regarding horses, customers, bookings, and meetings
3. To streamline the entire booking and racing business with modify, update, operate
race data, horse data, and meeting data
The success factors in the operation are identified as consistency in database, retrieval of
data with appropriate constraints and operating with the retrieved data. For forms, the success
conditions are error-free operation with horse data, customer data, and booking data. Horses
should be registered into race and horse time should be recorded with the forms. Race report’s
success conditions are flawless output showing race ID, race name, race types, meeting name
and data, horse name, horse time, jockey name, and owner name. Meeting report will be
Document Page
3DATABASE DESIGN
successful when it shows meeting ID, name, status, capacity, race course name, address, race
name, time, type and customer booking counts.
The system can have problem areas such as lack of data validation, lacking consistency in
database, and complexity. The stored data in tables should have proper validation checking so
that during modification or update no data loss issue is encountered. The database should be
consistent with each attribute linked with ERD. The database should have minimal complexity in
order to run the entire process with simple queries and functions.
Functional decomposition diagram
Figure 1: Functional decomposition diagram
(Source: Created by author)
Relationship structural
Business Rule 1: Every horse race has a race type. (Races > Race Type)
tabler-icon-diamond-filled.svg

Paraphrase This Document

Need a fresh take? Get an instant paraphrase of this document with our AI Paraphraser
Document Page
4DATABASE DESIGN
Business Rule 2: Many horse can run in one race. (Racing horse > horse)
Business Rule 3: A racing has more than one horses. (Racing horse > races)
Business Rule 4: Every horse must have one jockey. (horse > jockeys)
Business Rule 5: Every house must have one owner. (horse > Horse_Owner)
Business Rule 6: A race course may have more than one race. (course > Races)
Business Rule 7: Many meetings have appointed in a course. (courses > meetings)
Business Rule 8: A meeting can have more than one client booking. (Meeting >
Booking)
Business Rule 9: Customer have more than one booking for many meetings. (Customer >
booking)
Entity-relationship diagram
Document Page
5DATABASE DESIGN
Figure 2: Showing Entiy – Relation Diagram
(Source: Created by author)
Conceptual level business function
The conceptual level business function is aligned with data entity planning matrix to link
the identified processes along with Functional Decomposition Diagram and entities from ERD.
The Conceptual Level Business Function is shown as following:
Conceptual Level
Business Function
Functional Decomposition Diagram
For
m
Hor
se
Form
Custo
mer
Form
Meetin
gs
Form
Bookin
gs
Regist
er
Horse
Reco
rd
Time
Race
Rep
ort
Meeti
ng
Repor
t
Entity-
relations
hip
Diagram
Horse
Customer
Meetings
MeetingBook
ing,
Bookings
Courses
Races,
Race_types,
RacingHorse
Document Page
6DATABASE DESIGN
Races,
Race_types,
RacingHorse
, Horse,
Customer,
MeetingBook
ing,
Bookings
Meetings,
MeetingBook
ing,
Bookings,
Races,
Race_types,
RacingHorse
tabler-icon-diamond-filled.svg

Paraphrase This Document

Need a fresh take? Get an instant paraphrase of this document with our AI Paraphraser
Document Page
7DATABASE DESIGN
Normalised logical entity-relationship diagram
Figure 3: Showing Entiy – Relation Diagram
(Source: Created by author)
Normalised entity-relationship diagrams
Business Rule 1: (Races > Race Type)
Document Page
8DATABASE DESIGN
Business Rule 2: (Racing horse > horse)
Business Rule 3: (Racing horse > races)
Business Rule 4: (horse > jockeys)
Document Page
9DATABASE DESIGN
Business Rule 5: (horse > Horse_Owner)
Business Rule 6: (course > Races)
Business Rule 7: (courses > meetings)
tabler-icon-diamond-filled.svg

Paraphrase This Document

Need a fresh take? Get an instant paraphrase of this document with our AI Paraphraser
Document Page
10DATABASE DESIGN
Business Rule 8: (Meeting > Booking)
Business Rule 9: (Customer > booking)
Document Page
11DATABASE DESIGN
Data dictionary
The logical design of data dictionary is given underneath:
Table RACINGHORSE
Column Name Type Size Key
ID Number PK
RACEID Varchar 20 FK
HORSEID Varchar 20 FK
Table races
Column Name Type Size Key
chevron_up_icon
1 out of 16
circle_padding
hide_on_mobile
zoom_out_icon
[object Object]