Database Design 1: ER Model, Relational Schema, and CRISP-DM
VerifiedAdded on 2023/01/05
|10
|1672
|51
Report
AI Summary
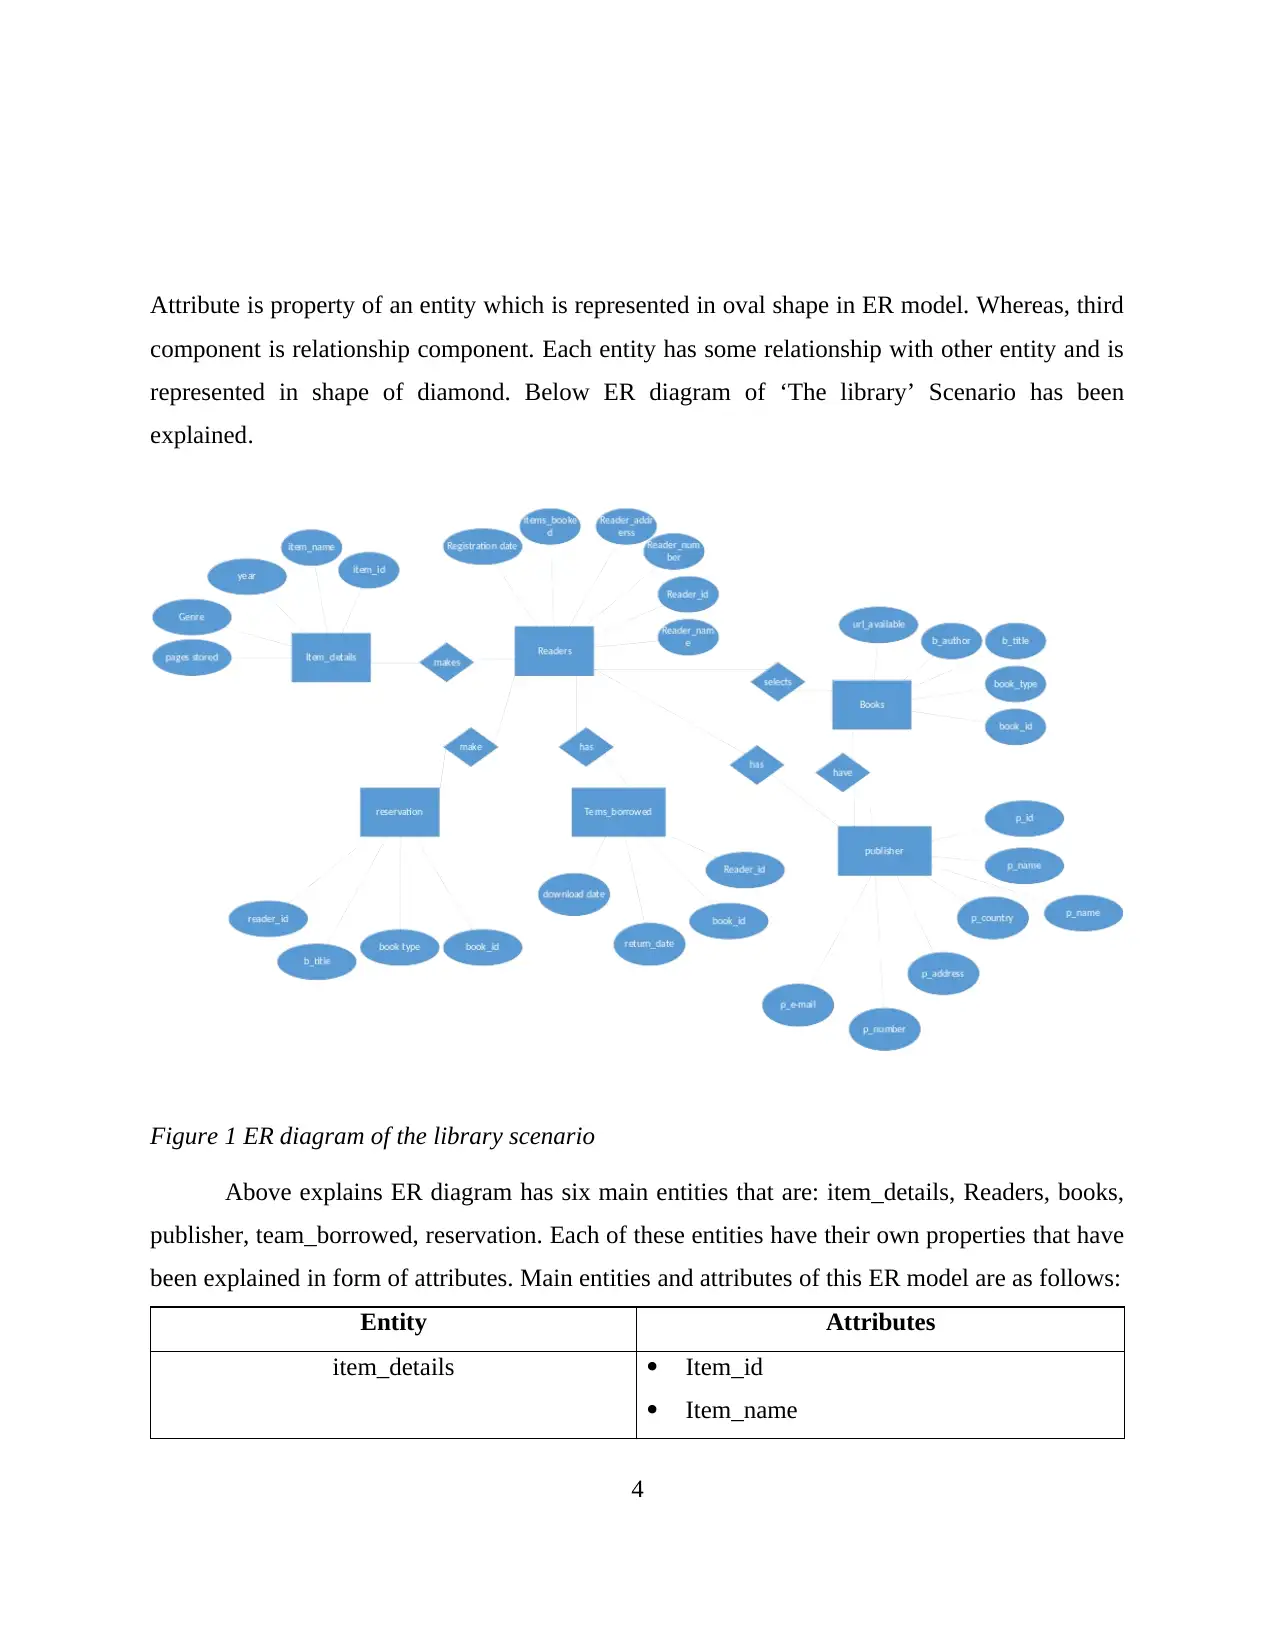
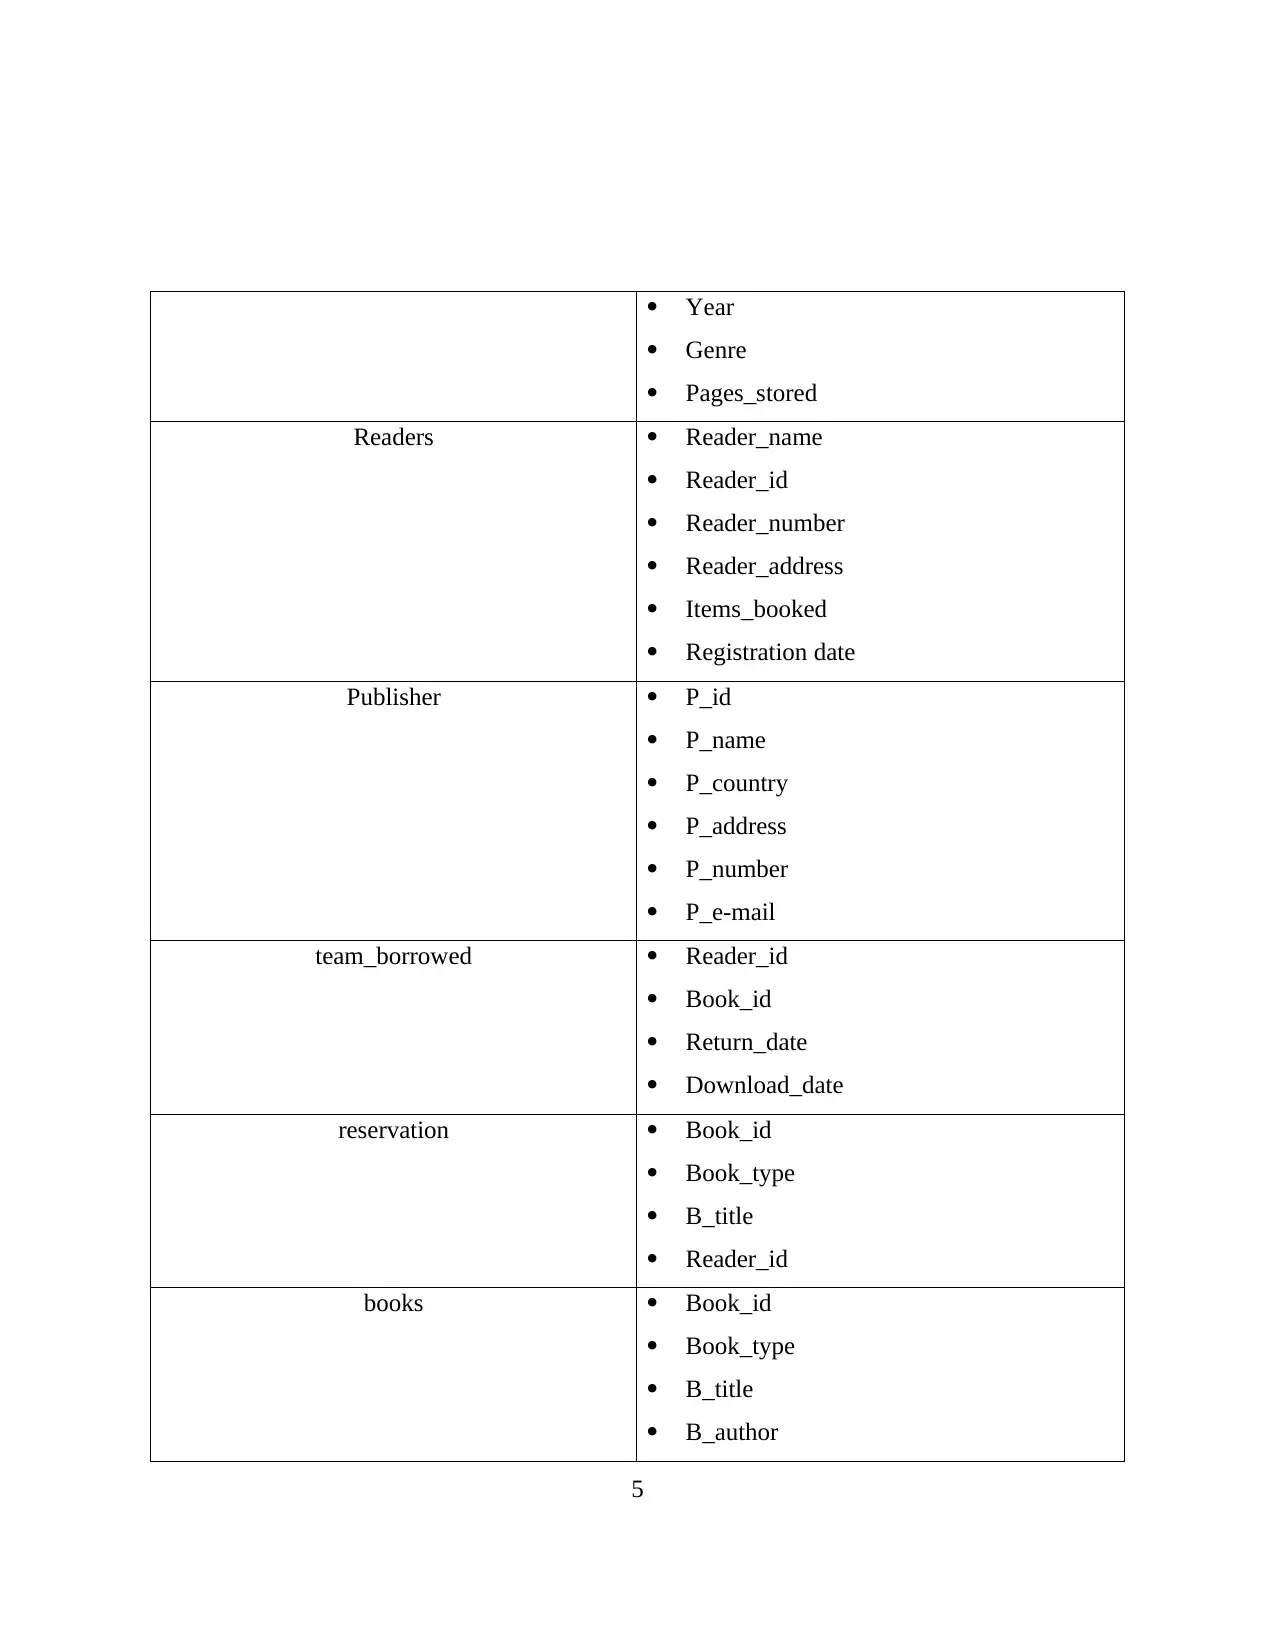
This report presents a comprehensive solution to a database design assignment. It begins with an introduction to databases and their importance, followed by a detailed explanation of Entity-Relationship (ER) diagrams and their components, using a library scenario as an example. The report then tr...
Read More
Contribute Materials
Your contribution can guide someone’s learning journey. Share your
documents today.

Database Design
1
1
Secure Best Marks with AI Grader
Need help grading? Try our AI Grader for instant feedback on your assignments.

Contents
INTRODUCTION...........................................................................................................................3
TASK 1............................................................................................................................................3
TASK 2............................................................................................................................................7
CONCLUSION..............................................................................................................................19
REFERENCES..............................................................................................................................20
2

INTRODUCTION
Database is a kind of organized set of or collection of data that has been accessed or stored
electronically within a system. It helps in storing complex data and information in an organized
manner using formal design and different kinds of modelling techniques. A database is
controlled by database management system and use structured query language for writing and
querying data (Jo and et. al., 2016). There are various kinds of databases that can be used by
organizations for development of database and strong data or information in a systematic and
arranged manner. In order to store information or data into database it is important to develop
design of database so that data is organized in an appropriate manner within database. But before
this, it is important to identify requirements of database for business and for this, data modelling
is required to be focused upon. In order to develop a data model, Entity- relationship model a
relational schema can be developed that helps in developing an appropriate model of database so
that all the needs and requirements of business can be fulfilled. This assignment will lay
emphasis upon development of entity relationship diagram as per the information given in ‘The
library’ scenario. Then this entity relationship model will be translated to Relational Schema.
Other than this, in this assignment, business understanding, data understanding, Data
Preparation, Modelling, Evaluation and Deployment will be focused upon.
TASK 1
ER Diagram or an entity relationship model is a high- level data model which is mostly used for
defining data elements and relationship for a particular system. It helps in development of a
conceptual design of database. It can also be said that it helps in development of a design view
which is simple and easy to be understood. It can also be said that ER model is a blueprint of a
database that can be used further for implementation of database (Wang and et. al., 2019). An ER
model consist of three main components that together helps in developing a proper and accurate
ER model. Three main components of ER model are: Entity: attributes, and relationship. Entity
is a data component or an entity which is represented as a rectangle in ER diagram. Each entity
has one or another kind of relationship with each other. Another component is Attribute.
3

Attribute is property of an entity which is represented in oval shape in ER model. Whereas, third
component is relationship component. Each entity has some relationship with other entity and is
represented in shape of diamond. Below ER diagram of ‘The library’ Scenario has been
explained.
Figure 1 ER diagram of the library scenario
Above explains ER diagram has six main entities that are: item_details, Readers, books,
publisher, team_borrowed, reservation. Each of these entities have their own properties that have
been explained in form of attributes. Main entities and attributes of this ER model are as follows:
Entity Attributes
item_details Item_id
Item_name
4
Secure Best Marks with AI Grader
Need help grading? Try our AI Grader for instant feedback on your assignments.

Year
Genre
Pages_stored
Readers Reader_name
Reader_id
Reader_number
Reader_address
Items_booked
Registration date
Publisher P_id
P_name
P_country
P_address
P_number
P_e-mail
team_borrowed Reader_id
Book_id
Return_date
Download_date
reservation Book_id
Book_type
B_title
Reader_id
books Book_id
Book_type
B_title
B_author
5

url_available
B. Relational Schema
Figure 2 Relationships
Relational Schema is basically define the design, structure of relation, consist of different
relation name, set of attributes, column name. Each and every attribute have been associated with
specific domain (Nathan and et.al., 2019).
In ERD model, it has been representing the relationship between one or more database
tables. Each and every table contain a primary key. Afterwards, it will be representing into
foreign key into another tables (Date, 2019). Thus, it has been developing relationship between
database tables in proper manner.
For Example- Relationship between reader and publisher, reader id is representing into
publisher as foreign key in which make a relation between each other. This type of relation has
6

shown in the form of relational schema. It would be developing as relational schema between
one or more database tables.
TASK 2
Task 2 A Business understanding
The main objective of this project is to enhance understanding of data modelling. Ways
in which data is analysed, and used for predictive modelling. This project also helps in
understanding ways in which a database can be used for creation of predictive models. Main
requirements of this project is to develop ER model and relational schema in order to enhance
knowledge and understanding of database and data models (Huber and et. al., 2019). This project
helps in understanding ways in which needs and requirements of business can be fulfilled with
the help of data analytics. In order to achieve this, model CRISP-DM methodology has been
used. CRISP-DM methodology stands for cross industry process for data mining. This
methodology helps in providing structured approach for planning a data mining project. It is a
well- proven and robust methodology which is being used nowadays in a proper and effective
manner. It is one of the most commonly used methodology which is used in data mining today.
This process has helped in creating a shape for data mining projects. This project consist of six
main steps of conceiving a data mining project. Business understanding is the first stage (Schäfer
and et. al., 2018). In this stage main goals and objectives of the project are explained in a detailed
manner. This stage helps the developers to get a brief idea of data of business model in a detailed
manner. In this project European Soccer database has been analysed in order to extract relevant
and predictable data. This European Soccer database consist of 7 main tables. All the main tables
with details of rows and column is given below. Using CRISP-DM methodology this data will be
analysed for identification predictable results.
Next stage is Data Understanding details of acquitted data listed in the project resources
is explained and identified in a detailed manner (Wiemer, Drowatzky and Ihlenfeldt, 2019). In
this all the details related to data understanding is explained whether there is usage of multiple
data sources or not. In this data collection report is generated with detailed analysis of data.
7
Paraphrase This Document
Need a fresh take? Get an instant paraphrase of this document with our AI Paraphraser

Third and further stage is Data Preparation and Modelling. In third stage of data
preparation, analysis of current data is done so that data can be cleaned for further usage with the
help of ETL usage. Them modelling of this data is done though machine learning. Lastly, fifth
and six in which evaluation of results is done so that best results can be identified (Espitia and
Montilla, 2018). In this different kind of modelling techniques are used for evaluation of results
in an accurate manner like decision building tree, neural network and many more. Finally, these
results are analyzed and evaluated so that predictions can be done accordingly. Using this
methodology evaluation of European Soccer dataset will be done.
Task 2 Data exploration
It is one of the main stages of CRISP-DM methodology in which acquitted data is listed
in project resources (Espitia and Montilla, 2018). At this stage loading of data is done which is
extremely important to be understood for enhancing one’s own knowledge of data. At this stage
data from different sources is collected and stored together. At this stage description of data is
given in a better and appropriate manner. Below table helps in providing detailed description of
data in an appropriate manner. Below table helps in understanding that there are seven main
tables in this database. Characteristics of these data and data sources have also been explained in
this in a proper and accurate manner like identification of missing values and many more. Detail
description of this data has been explained with different kinds of tables and graphs. Below table
helps in explaining number of tables present in European Soccer database.
8

Figure 3 Details of tables of European Soccer database
Below tables will help in explaining properties of each of these tables in a proper and detailed
manner with graph if required
Country table: this table consist of two main columns that are id and names and all of them
consist of 11 valid values and none of them mismatched or are missing.
For example: Characteristics of name are
League table: this table consist of three main columns that are id, country_id and names and
all of them consist of 11 valid values and none of them mismatched or are missing.
For example: characteristics of country_id are
9

Match table: this table consist of 10 main columns that are id, country_id, league_id, season
stage, date, match_api_id, home_team_api_id, away_team_api_id, and home team goals and
all of them consist of 300 rows and all of them have valid values and none of them
mismatched or are missing.
For example: characteristics of match_api_id are
10
stage, date, match_api_id, home_team_api_id, away_team_api_id, and home team goals and
all of them consist of 300 rows and all of them have valid values and none of them
mismatched or are missing.
For example: characteristics of match_api_id are
10
1 out of 10
Related Documents

Your All-in-One AI-Powered Toolkit for Academic Success.
+13062052269
info@desklib.com
Available 24*7 on WhatsApp / Email
Unlock your academic potential
© 2024 | Zucol Services PVT LTD | All rights reserved.