BAF1045: DBS Bank Financial Performance and Investment Report
VerifiedAdded on 2021/04/21
|26
|4348
|424
Report
AI Summary
This report provides a comprehensive analysis of DBS Bank's financial performance, covering its history, market position, and financial ratios. The report includes an evaluation of DBS Bank's financial performance using DuPont analysis, comparing its return on equity (ROE) with peer banks like UOB and OCBC. It examines key financial metrics such as revenue, net profit, asset turnover, and profit margins to assess the bank's efficiency and profitability. The analysis also delves into the current issues facing the banking industry and their potential impact on DBS Bank's future earnings. The report utilizes figures and tables to illustrate the bank's performance and market share, highlighting its strengths and weaknesses. Overall, the report aims to provide insights into DBS Bank's financial health and investment potential.
BAF1045 INVESTMENT
TABLE OF CONTENT
TABLE OF CONTENT
Paraphrase This Document
Need a fresh take? Get an instant paraphrase of this document with our AI Paraphraser
S
Executive Summary...................................................................................................................1
Company Background............................................................................................................1
Evaluation of Company’s History..........................................................................................3
Financial Performance of the company..................................................................................5
Perform ROE of DBS Bank using DuPont ROE approach including peer group comparison
................................................................................................................................................9
Analysing current issues facing by the company in Banking Industry................................16
Explain the impact of the issues on the company’s future earnings.....................................17

TABLE OF FIGURES
Figure 1 Share Prices................................................................................................................1
Figure 2 Shareholders of DBS bank..........................................................................................3
Figure 3 Share Price history......................................................................................................5
⊘ This is a preview!⊘
Do you want full access?
Subscribe today to unlock all pages.
Trusted by 1+ million students worldwide
EXECUTIVE SUMMARY
Current report will emphasize on portraying the character of DBS Bank in the terms
of its performing and non-performing assets revealed in front of the external users. History of
the company is publicized in this assignment to highlight its ability in coping with various
changes takes places in its business throughout its business tenure.
Financial performance of the bank is measured through DuPont analysis in which
strengths and weaknesses of the company comes in a bigger picture in comparison with its
competitors operating in a similar market.
Financial and non-financial structure of the company is discussed in a report to make
judgments about the increasing or declining performance of the company. Banking
regulations act as a benchmarking tool in evaluating the success or failure of an entity. An
entity operates their business in the presence of several other competitors such as UOB and
OCBC banks.
Company Background
MARKET PROFILE
Figure 1 Share Prices
1
Paraphrase This Document
Need a fresh take? Get an instant paraphrase of this document with our AI Paraphraser
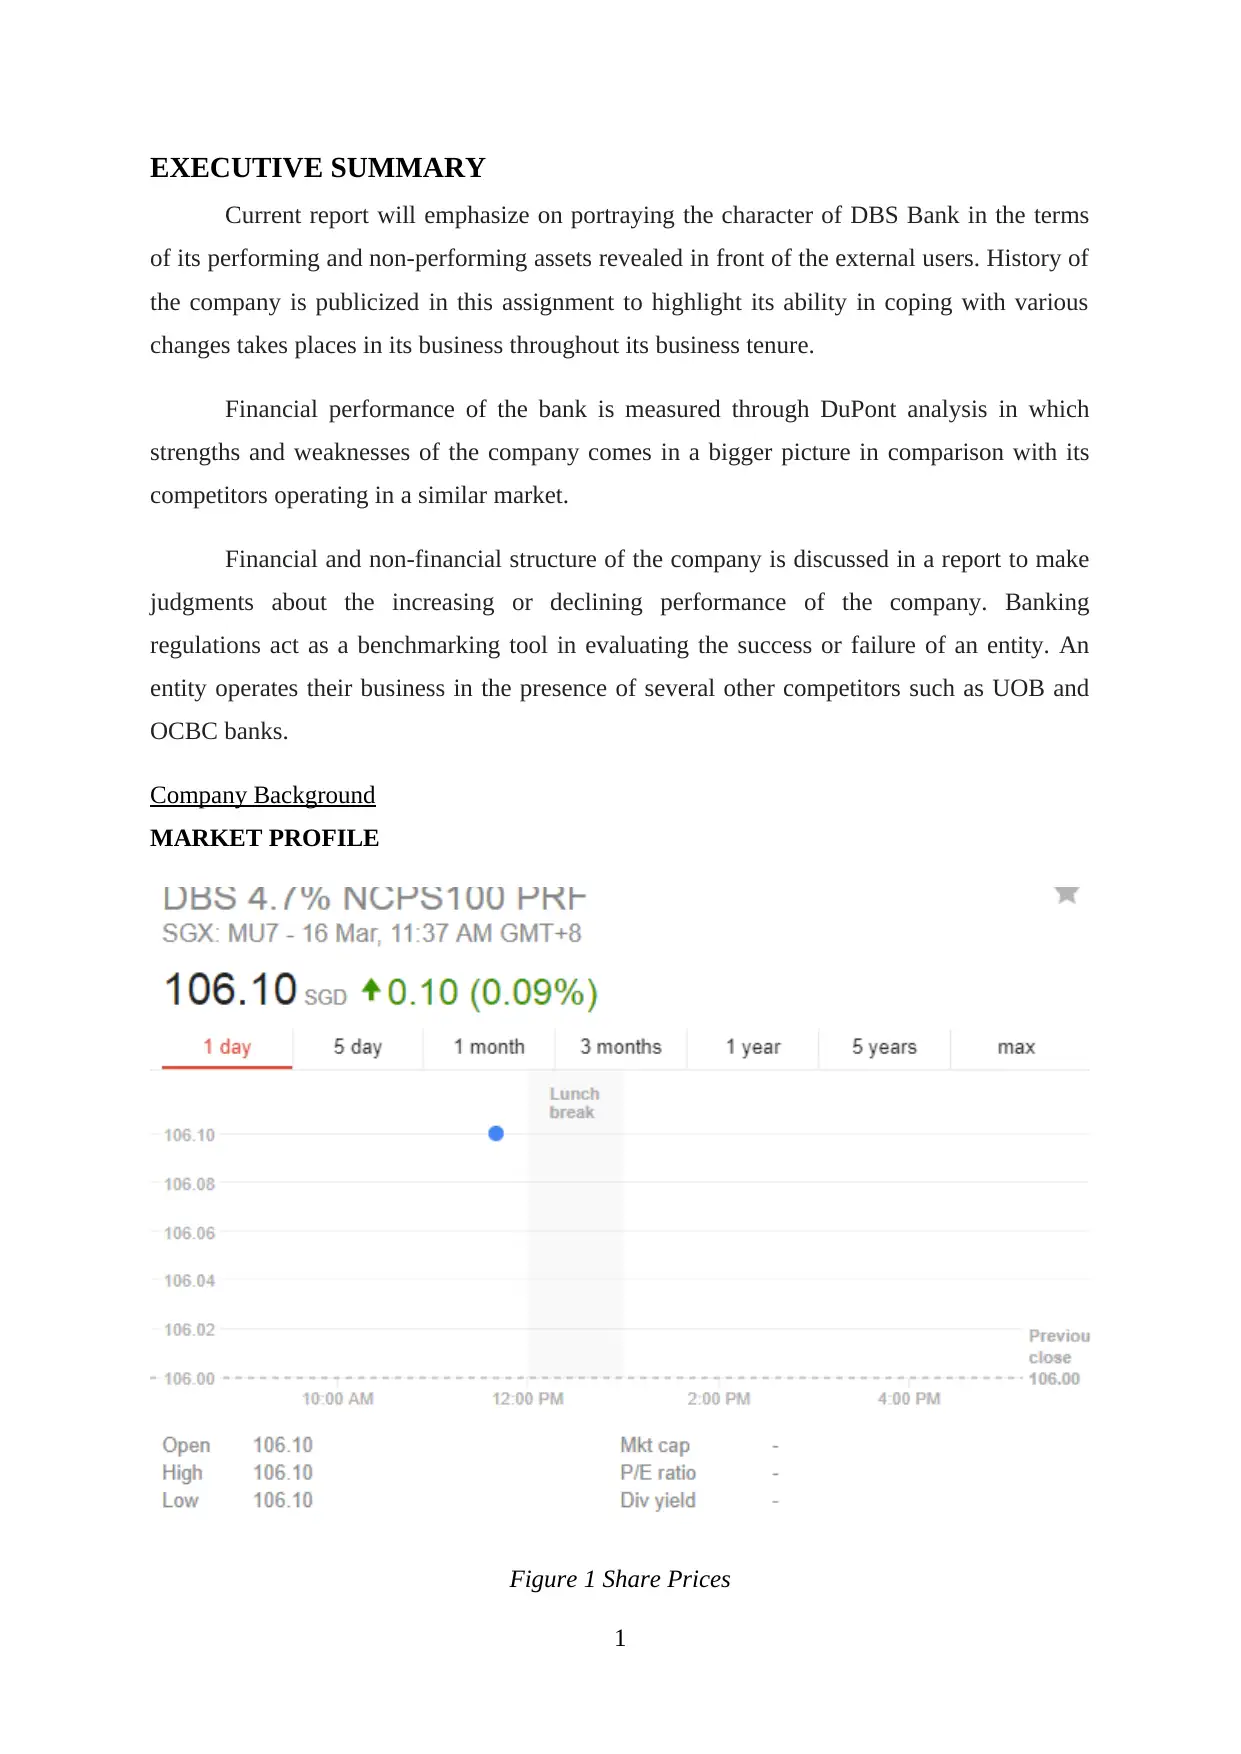
(Source: DBS group holdings Ltd share price history, 2017)
DBS Bank is a renowned company in a Singapore also recognise as ‘The
development bank of Singapore Limited’ is a transnational banking entity. This corporation
deals in offering various kinds of financial services such as personal banking and corporate
banking option to cater all the needs of its customers.
DBS Bank is a public Ltd Company listed under Singapore stock exchange with
SGX: D05 stock index in the banking industry. Entities strive hard to achieve all its goals
before its competitions to overcome the existing market competition in this particular
industry.
DBS Bank UOB OCBC
0
200
400
600
800
1000
1200
Revenue of 2016
Revenue of 2016
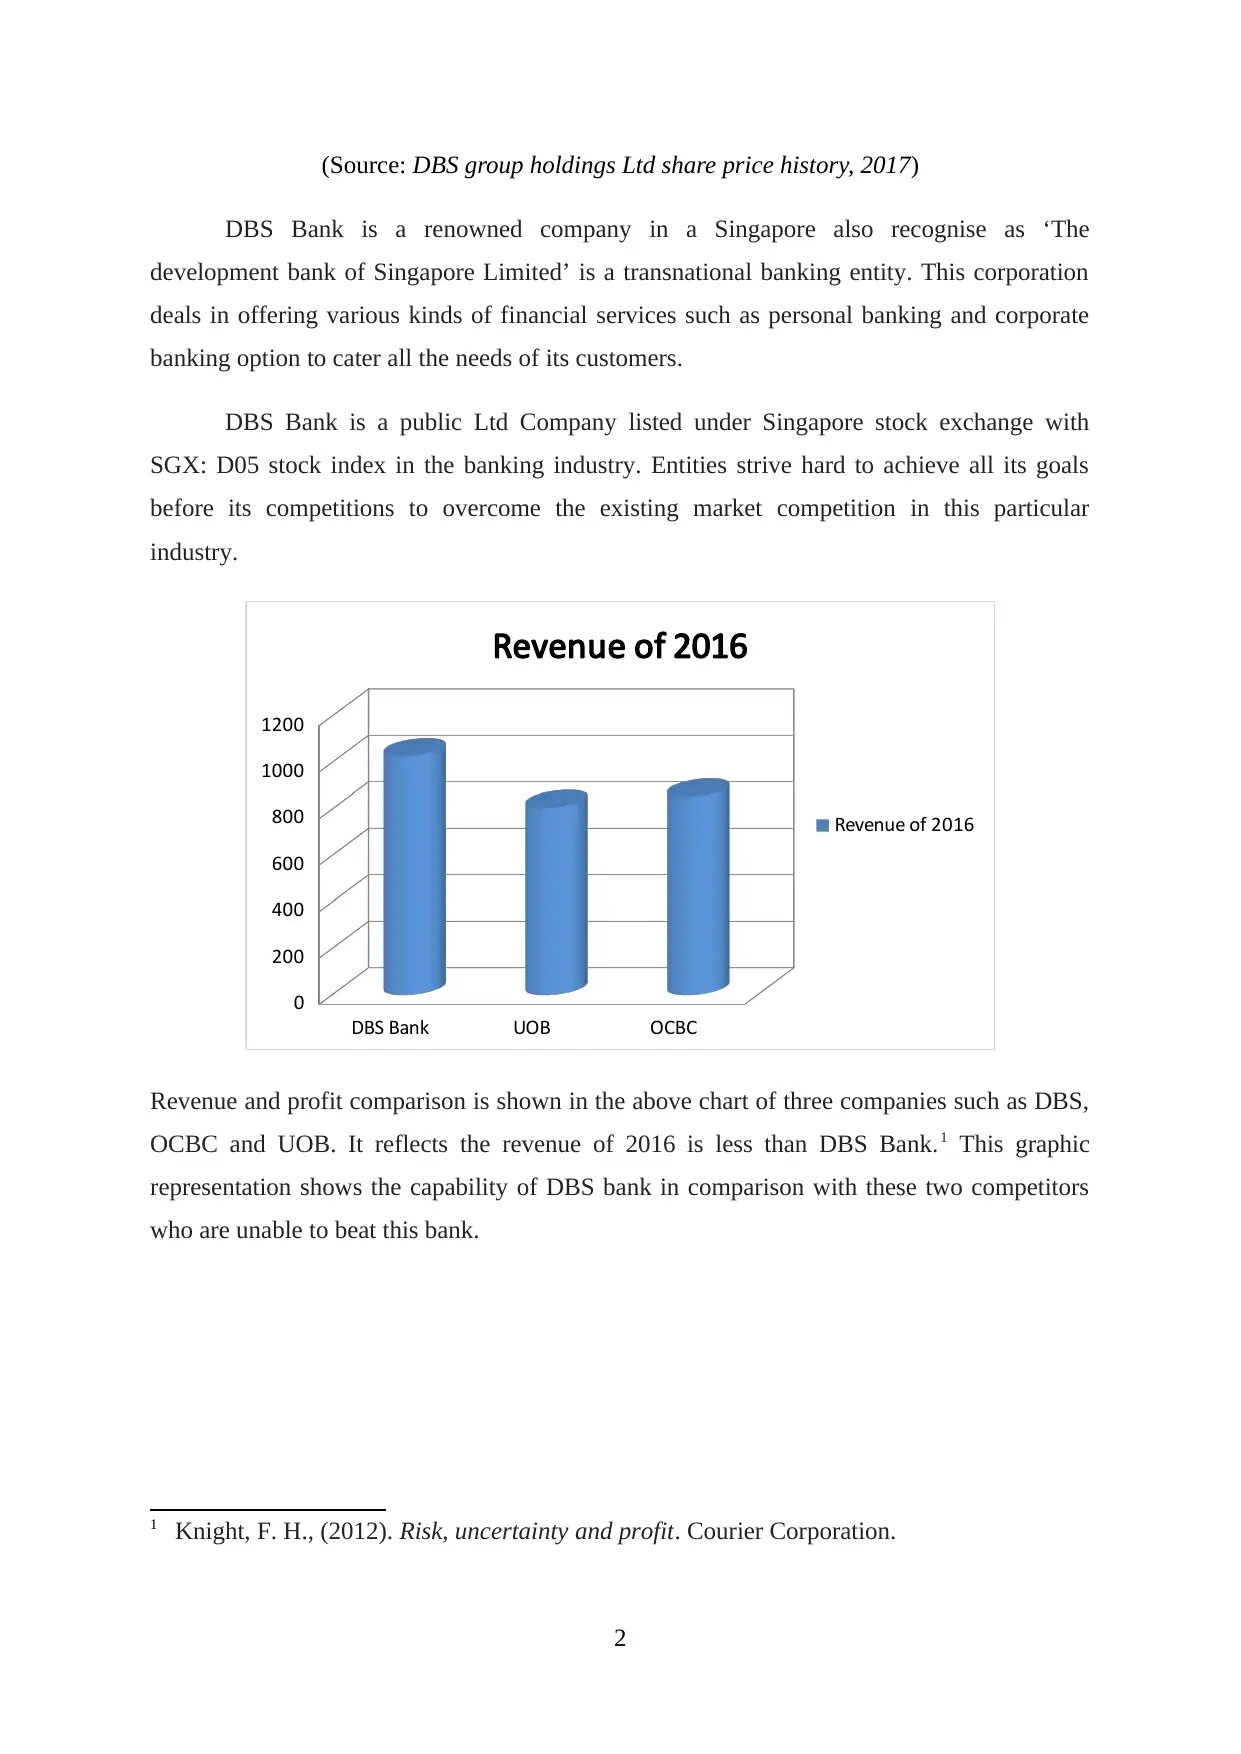
Revenue and profit comparison is shown in the above chart of three companies such as DBS,
OCBC and UOB. It reflects the revenue of 2016 is less than DBS Bank.1 This graphic
representation shows the capability of DBS bank in comparison with these two competitors
who are unable to beat this bank.
1 Knight, F. H., (2012). Risk, uncertainty and profit. Courier Corporation.
2
DBS Bank is a renowned company in a Singapore also recognise as ‘The
development bank of Singapore Limited’ is a transnational banking entity. This corporation
deals in offering various kinds of financial services such as personal banking and corporate
banking option to cater all the needs of its customers.
DBS Bank is a public Ltd Company listed under Singapore stock exchange with
SGX: D05 stock index in the banking industry. Entities strive hard to achieve all its goals
before its competitions to overcome the existing market competition in this particular
industry.
DBS Bank UOB OCBC
0
200
400
600
800
1000
1200
Revenue of 2016
Revenue of 2016
Revenue and profit comparison is shown in the above chart of three companies such as DBS,
OCBC and UOB. It reflects the revenue of 2016 is less than DBS Bank.1 This graphic
representation shows the capability of DBS bank in comparison with these two competitors
who are unable to beat this bank.
1 Knight, F. H., (2012). Risk, uncertainty and profit. Courier Corporation.
2
Singapore Malaysia Overseas
0
20
40
60
80
100
120
Location of shareholders
Location of shareholders
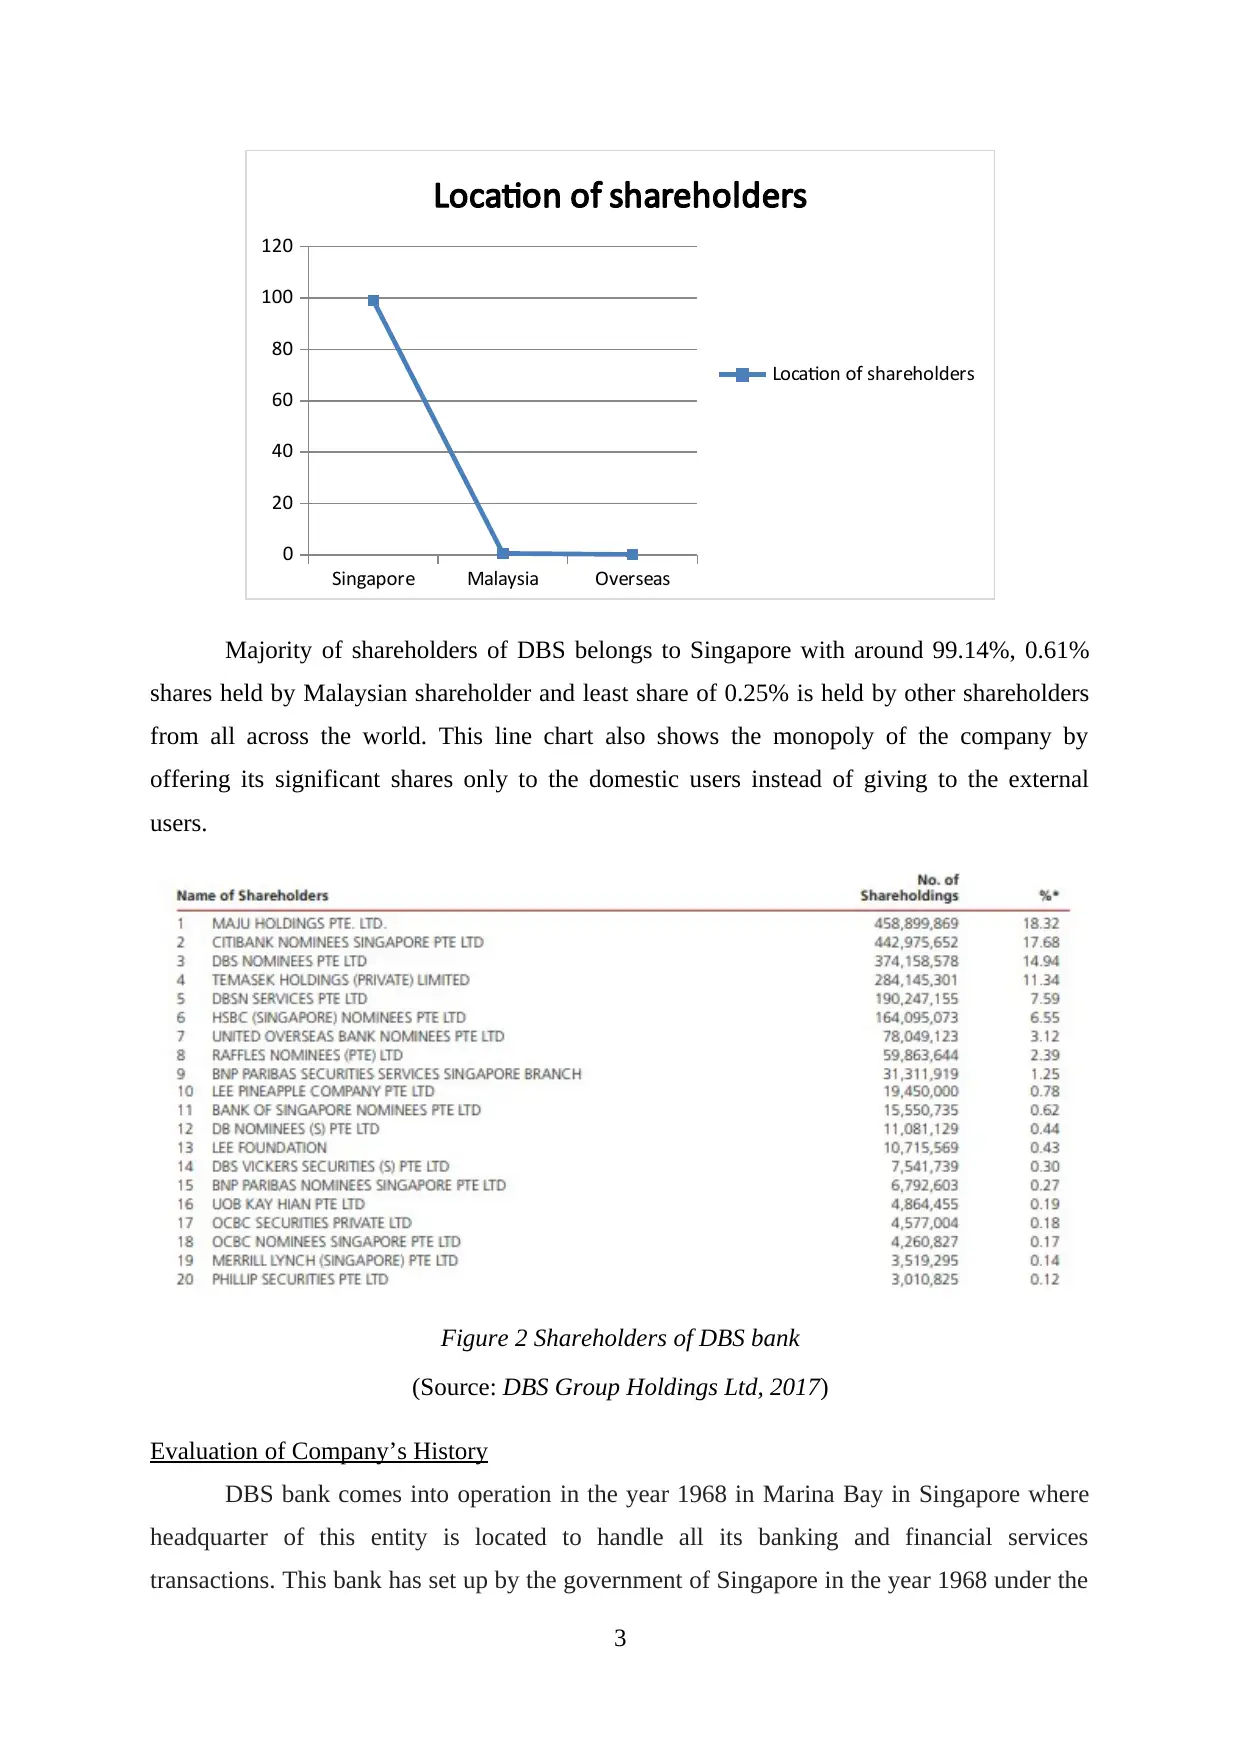
Majority of shareholders of DBS belongs to Singapore with around 99.14%, 0.61%
shares held by Malaysian shareholder and least share of 0.25% is held by other shareholders
from all across the world. This line chart also shows the monopoly of the company by
offering its significant shares only to the domestic users instead of giving to the external
users.
Figure 2 Shareholders of DBS bank
(Source: DBS Group Holdings Ltd, 2017)
Evaluation of Company’s History
DBS bank comes into operation in the year 1968 in Marina Bay in Singapore where
headquarter of this entity is located to handle all its banking and financial services
transactions. This bank has set up by the government of Singapore in the year 1968 under the
3
0
20
40
60
80
100
120
Location of shareholders
Location of shareholders
Majority of shareholders of DBS belongs to Singapore with around 99.14%, 0.61%
shares held by Malaysian shareholder and least share of 0.25% is held by other shareholders
from all across the world. This line chart also shows the monopoly of the company by
offering its significant shares only to the domestic users instead of giving to the external
users.
Figure 2 Shareholders of DBS bank
(Source: DBS Group Holdings Ltd, 2017)
Evaluation of Company’s History
DBS bank comes into operation in the year 1968 in Marina Bay in Singapore where
headquarter of this entity is located to handle all its banking and financial services
transactions. This bank has set up by the government of Singapore in the year 1968 under the
3
⊘ This is a preview!⊘
Do you want full access?
Subscribe today to unlock all pages.
Trusted by 1+ million students worldwide
special act to take command over industrial financing activities of an entity. This entity’s
name has revised in July 2003 by making some changes in its business operations. Firm’s
motive is to capture the large base of the customer base as well as higher market share in the
external entity. DBS banking entity has experience of 50 years since 1968 by serving
different areas such as East Asia and South East Asia.
Various Products of this entity includes Retail banking, corporate banking,
investment banking, mortgage loans, private banking, wealth management, credit cards,
finance, and insurance.2 All these products of the bank get successful due to the higher
number of employees working under this firm. The company is handling 22194 personnel
satisfied with the perks offered by DBS bank helps in uplifting the business process of this
enterprise in a lesser time period.
The main aim of this entity is to help of all the manufacturing industries who
are sick units as this bank gives financial assistance in upgrading its business units within
Singapore. To offer new services to its customers, DBS bank acquired post office savings
bank in the year 1877 to provide a facility for depositing cash through a machine. This
facility launched by this bank to offer hassle-free services to all its users to conveniently use
the banking services.
2 Kharatyan, Davit, José Lopes, and Alcina Nunes. "Determinants of return on equity:
evidence from NASDAQ 100." XXVII Jornadas Hispano-Lusas Gestión Científica(2017).
4
Paraphrase This Document
Need a fresh take? Get an instant paraphrase of this document with our AI Paraphraser
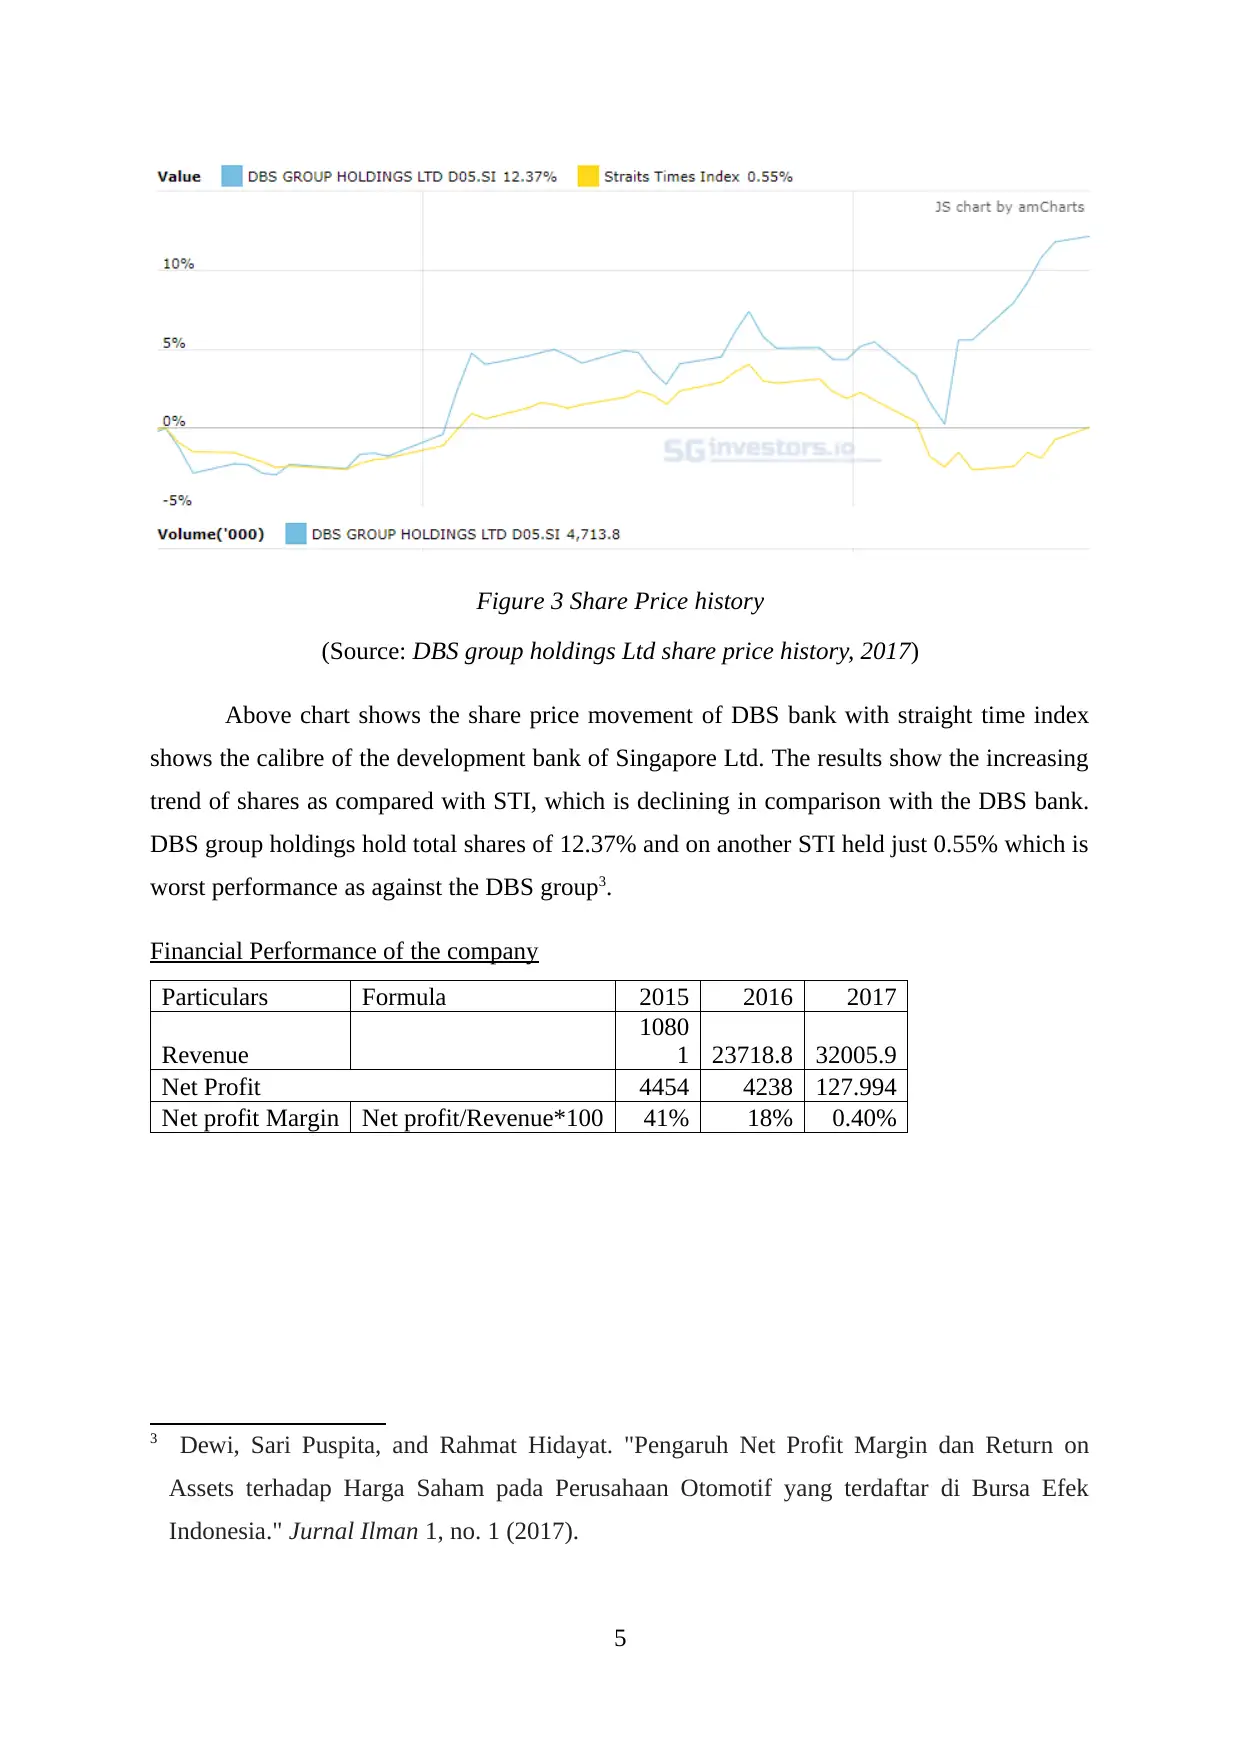
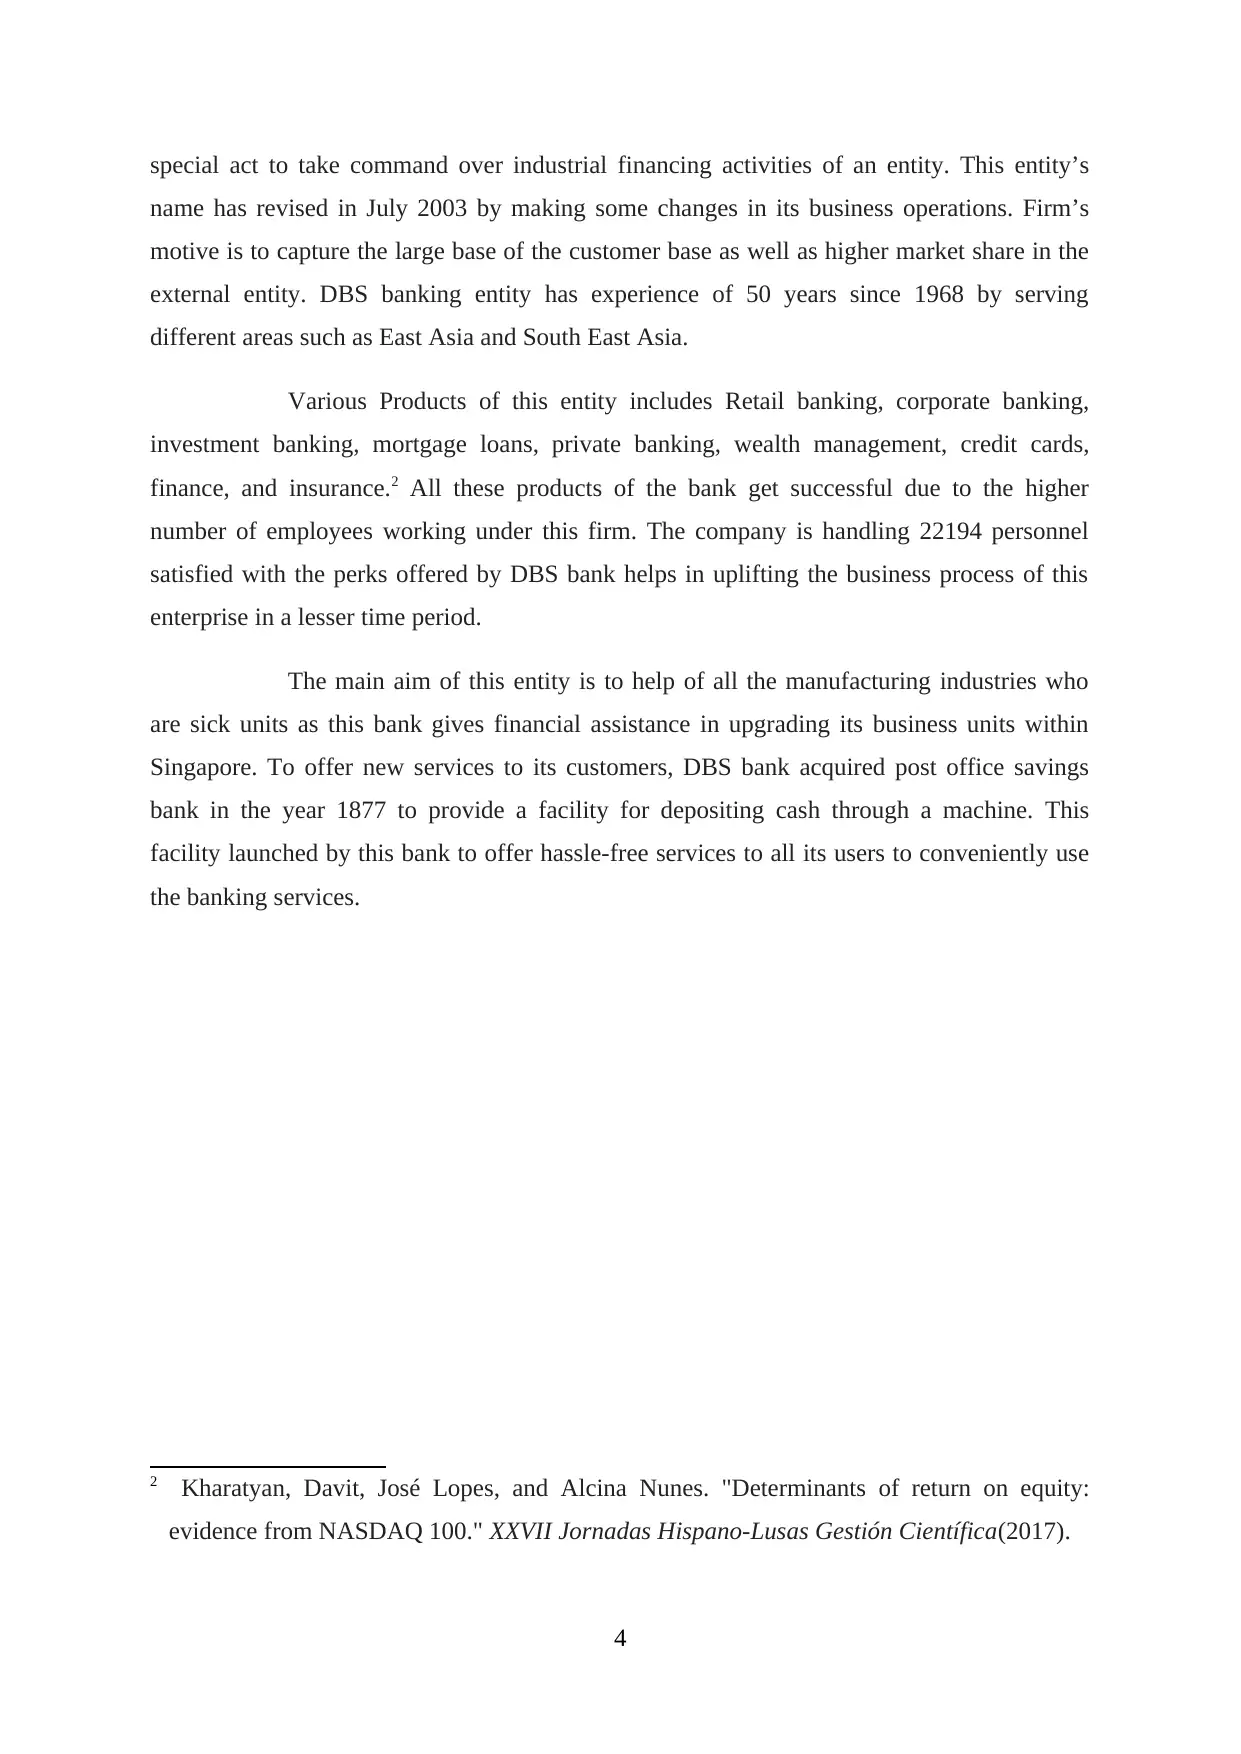
Figure 3 Share Price history
(Source: DBS group holdings Ltd share price history, 2017)
Above chart shows the share price movement of DBS bank with straight time index
shows the calibre of the development bank of Singapore Ltd. The results show the increasing
trend of shares as compared with STI, which is declining in comparison with the DBS bank.
DBS group holdings hold total shares of 12.37% and on another STI held just 0.55% which is
worst performance as against the DBS group3.
Financial Performance of the company
Particulars Formula 2015 2016 2017
Revenue
1080
1 23718.8 32005.9
Net Profit 4454 4238 127.994
Net profit Margin Net profit/Revenue*100 41% 18% 0.40%
3 Dewi, Sari Puspita, and Rahmat Hidayat. "Pengaruh Net Profit Margin dan Return on
Assets terhadap Harga Saham pada Perusahaan Otomotif yang terdaftar di Bursa Efek
Indonesia." Jurnal Ilman 1, no. 1 (2017).
5
2015 2016 2017
0%
5%
10%
15%
20%
25%
30%
35%
40%
45%
Net profit Margin
Net profit Margin
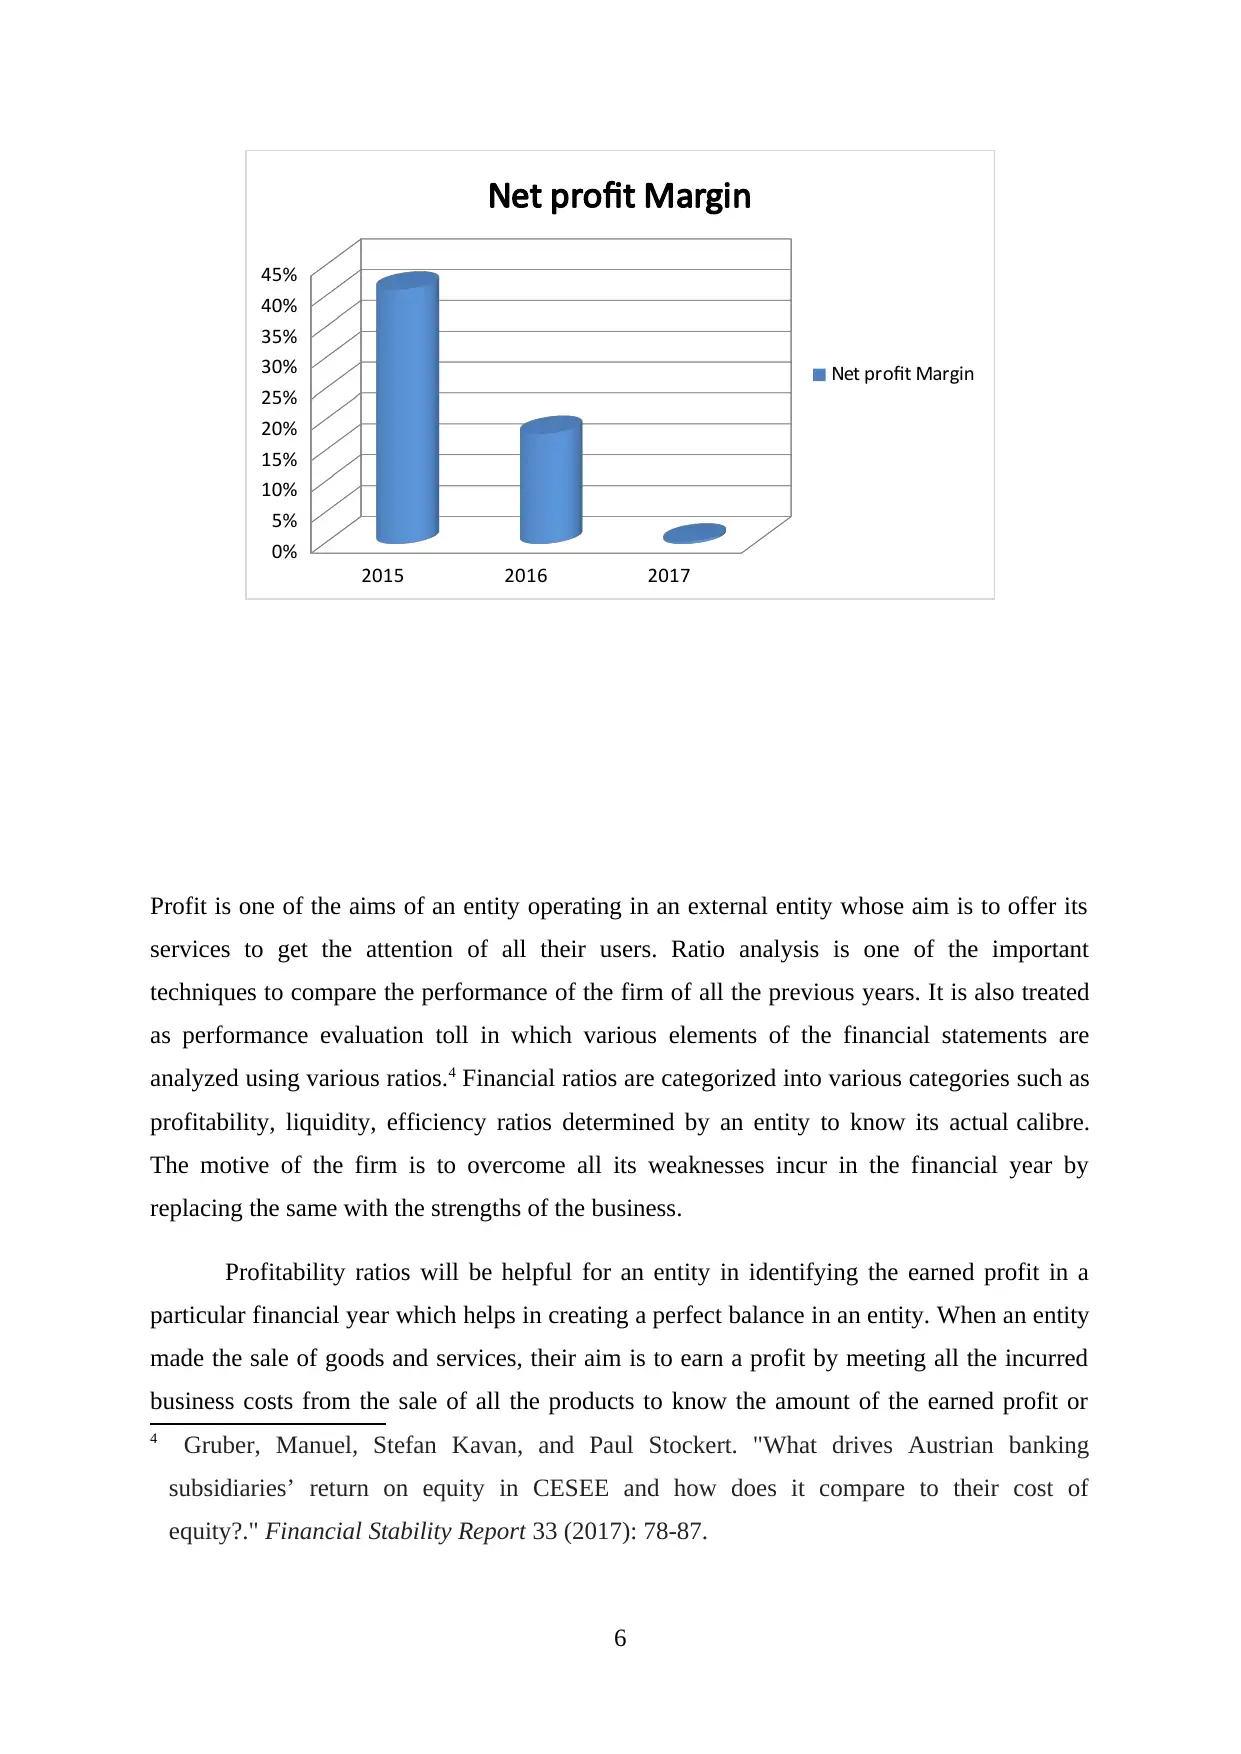
Profit is one of the aims of an entity operating in an external entity whose aim is to offer its
services to get the attention of all their users. Ratio analysis is one of the important
techniques to compare the performance of the firm of all the previous years. It is also treated
as performance evaluation toll in which various elements of the financial statements are
analyzed using various ratios.4 Financial ratios are categorized into various categories such as
profitability, liquidity, efficiency ratios determined by an entity to know its actual calibre.
The motive of the firm is to overcome all its weaknesses incur in the financial year by
replacing the same with the strengths of the business.
Profitability ratios will be helpful for an entity in identifying the earned profit in a
particular financial year which helps in creating a perfect balance in an entity. When an entity
made the sale of goods and services, their aim is to earn a profit by meeting all the incurred
business costs from the sale of all the products to know the amount of the earned profit or
4 Gruber, Manuel, Stefan Kavan, and Paul Stockert. "What drives Austrian banking
subsidiaries’ return on equity in CESEE and how does it compare to their cost of
equity?." Financial Stability Report 33 (2017): 78-87.
6
0%
5%
10%
15%
20%
25%
30%
35%
40%
45%
Net profit Margin
Net profit Margin
Profit is one of the aims of an entity operating in an external entity whose aim is to offer its
services to get the attention of all their users. Ratio analysis is one of the important
techniques to compare the performance of the firm of all the previous years. It is also treated
as performance evaluation toll in which various elements of the financial statements are
analyzed using various ratios.4 Financial ratios are categorized into various categories such as
profitability, liquidity, efficiency ratios determined by an entity to know its actual calibre.
The motive of the firm is to overcome all its weaknesses incur in the financial year by
replacing the same with the strengths of the business.
Profitability ratios will be helpful for an entity in identifying the earned profit in a
particular financial year which helps in creating a perfect balance in an entity. When an entity
made the sale of goods and services, their aim is to earn a profit by meeting all the incurred
business costs from the sale of all the products to know the amount of the earned profit or
4 Gruber, Manuel, Stefan Kavan, and Paul Stockert. "What drives Austrian banking
subsidiaries’ return on equity in CESEE and how does it compare to their cost of
equity?." Financial Stability Report 33 (2017): 78-87.
6
⊘ This is a preview!⊘
Do you want full access?
Subscribe today to unlock all pages.
Trusted by 1+ million students worldwide
loss suffered by the business. Role of a finance manager is to increase the wealth of all their
shareholders of the business as shareholder invests their precious money in an entity for a
specific period.5
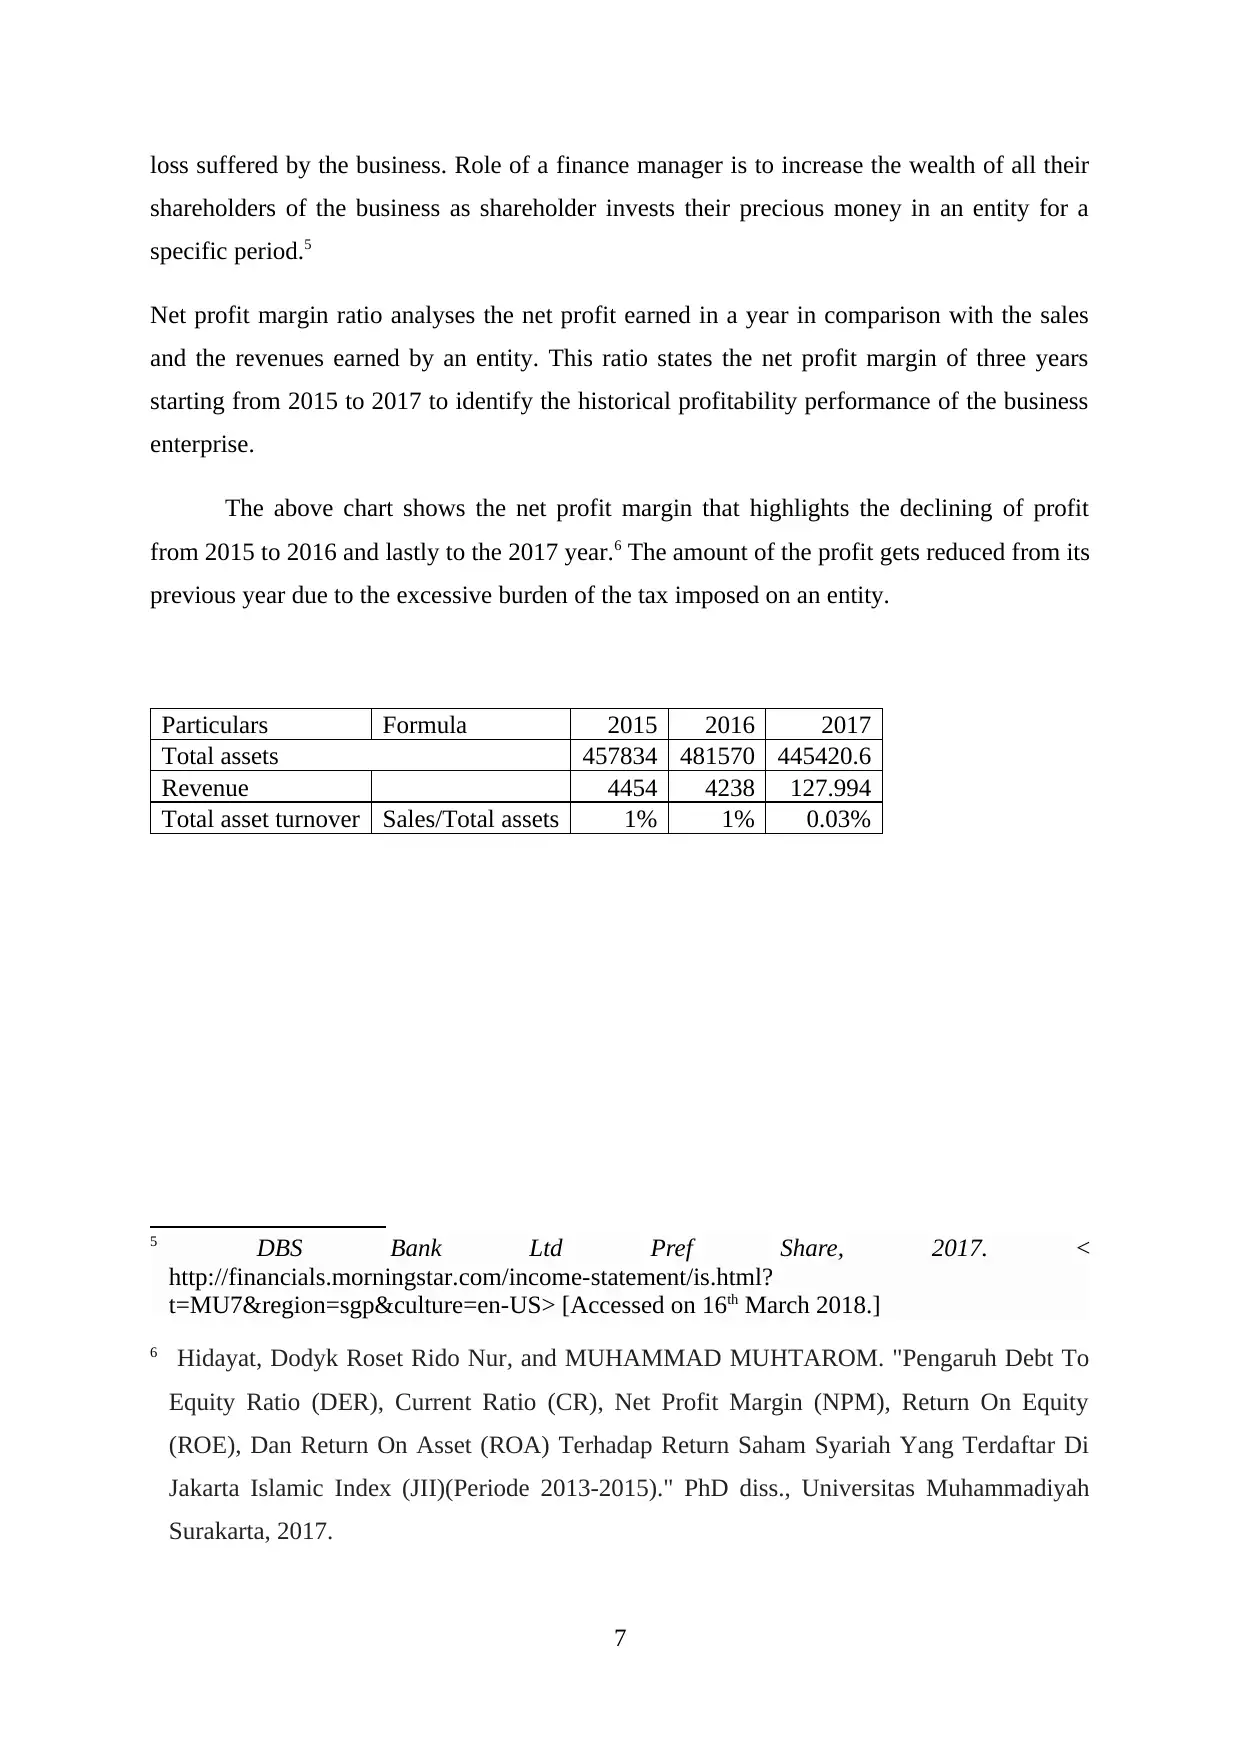
Net profit margin ratio analyses the net profit earned in a year in comparison with the sales
and the revenues earned by an entity. This ratio states the net profit margin of three years
starting from 2015 to 2017 to identify the historical profitability performance of the business
enterprise.
The above chart shows the net profit margin that highlights the declining of profit
from 2015 to 2016 and lastly to the 2017 year.6 The amount of the profit gets reduced from its
previous year due to the excessive burden of the tax imposed on an entity.
Particulars Formula 2015 2016 2017
Total assets 457834 481570 445420.6
Revenue 4454 4238 127.994
Total asset turnover Sales/Total assets 1% 1% 0.03%
5 DBS Bank Ltd Pref Share, 2017. <
http://financials.morningstar.com/income-statement/is.html?
t=MU7®ion=sgp&culture=en-US> [Accessed on 16th March 2018.]
6 Hidayat, Dodyk Roset Rido Nur, and MUHAMMAD MUHTAROM. "Pengaruh Debt To
Equity Ratio (DER), Current Ratio (CR), Net Profit Margin (NPM), Return On Equity
(ROE), Dan Return On Asset (ROA) Terhadap Return Saham Syariah Yang Terdaftar Di
Jakarta Islamic Index (JII)(Periode 2013-2015)." PhD diss., Universitas Muhammadiyah
Surakarta, 2017.
7
shareholders of the business as shareholder invests their precious money in an entity for a
specific period.5
Net profit margin ratio analyses the net profit earned in a year in comparison with the sales
and the revenues earned by an entity. This ratio states the net profit margin of three years
starting from 2015 to 2017 to identify the historical profitability performance of the business
enterprise.
The above chart shows the net profit margin that highlights the declining of profit
from 2015 to 2016 and lastly to the 2017 year.6 The amount of the profit gets reduced from its
previous year due to the excessive burden of the tax imposed on an entity.
Particulars Formula 2015 2016 2017
Total assets 457834 481570 445420.6
Revenue 4454 4238 127.994
Total asset turnover Sales/Total assets 1% 1% 0.03%
5 DBS Bank Ltd Pref Share, 2017. <
http://financials.morningstar.com/income-statement/is.html?
t=MU7®ion=sgp&culture=en-US> [Accessed on 16th March 2018.]
6 Hidayat, Dodyk Roset Rido Nur, and MUHAMMAD MUHTAROM. "Pengaruh Debt To
Equity Ratio (DER), Current Ratio (CR), Net Profit Margin (NPM), Return On Equity
(ROE), Dan Return On Asset (ROA) Terhadap Return Saham Syariah Yang Terdaftar Di
Jakarta Islamic Index (JII)(Periode 2013-2015)." PhD diss., Universitas Muhammadiyah
Surakarta, 2017.
7
Paraphrase This Document
Need a fresh take? Get an instant paraphrase of this document with our AI Paraphraser
2015 2016 2017
0%
1%
1%
Total asset turnover
Total asset turnover
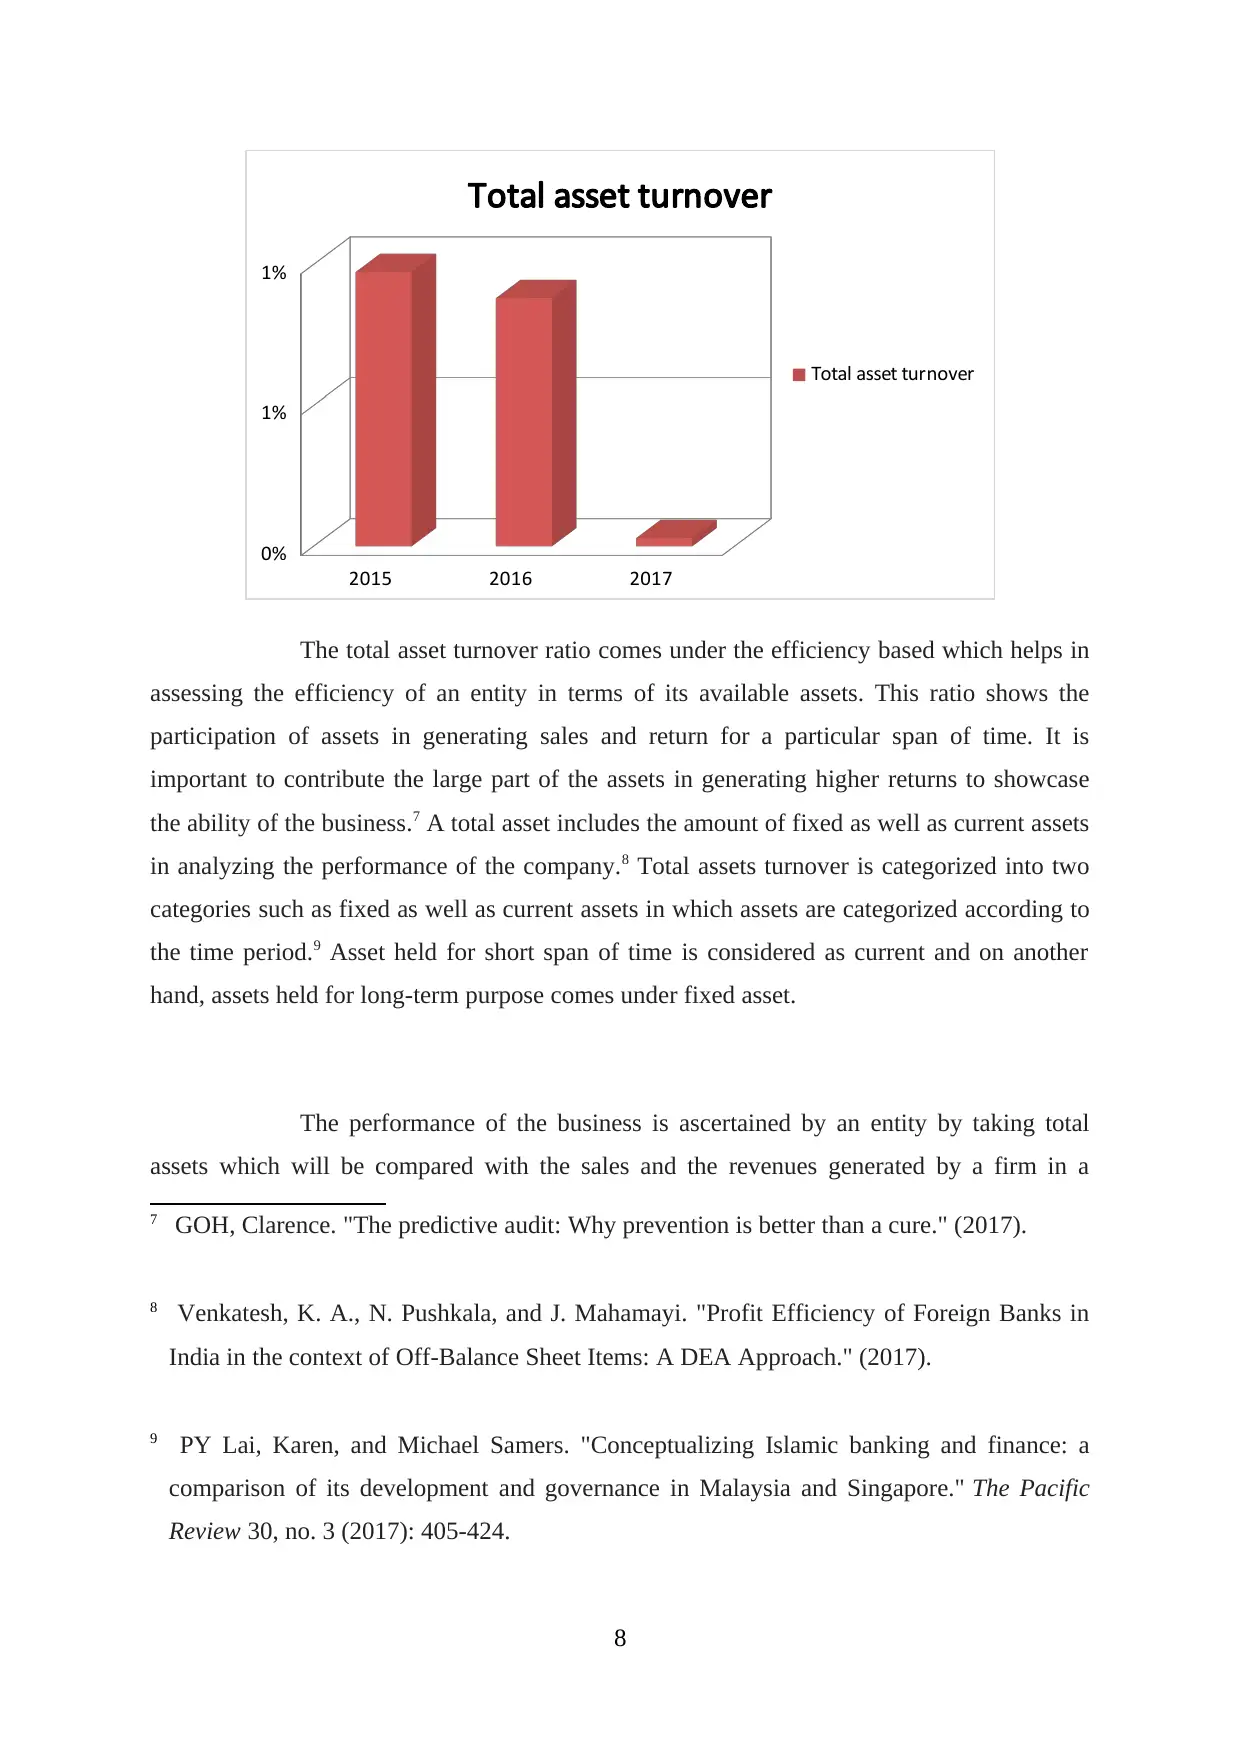
The total asset turnover ratio comes under the efficiency based which helps in
assessing the efficiency of an entity in terms of its available assets. This ratio shows the
participation of assets in generating sales and return for a particular span of time. It is
important to contribute the large part of the assets in generating higher returns to showcase
the ability of the business.7 A total asset includes the amount of fixed as well as current assets
in analyzing the performance of the company.8 Total assets turnover is categorized into two
categories such as fixed as well as current assets in which assets are categorized according to
the time period.9 Asset held for short span of time is considered as current and on another
hand, assets held for long-term purpose comes under fixed asset.
The performance of the business is ascertained by an entity by taking total
assets which will be compared with the sales and the revenues generated by a firm in a
7 GOH, Clarence. "The predictive audit: Why prevention is better than a cure." (2017).
8 Venkatesh, K. A., N. Pushkala, and J. Mahamayi. "Profit Efficiency of Foreign Banks in
India in the context of Off-Balance Sheet Items: A DEA Approach." (2017).
9 PY Lai, Karen, and Michael Samers. "Conceptualizing Islamic banking and finance: a
comparison of its development and governance in Malaysia and Singapore." The Pacific
Review 30, no. 3 (2017): 405-424.
8
0%
1%
1%
Total asset turnover
Total asset turnover
The total asset turnover ratio comes under the efficiency based which helps in
assessing the efficiency of an entity in terms of its available assets. This ratio shows the
participation of assets in generating sales and return for a particular span of time. It is
important to contribute the large part of the assets in generating higher returns to showcase
the ability of the business.7 A total asset includes the amount of fixed as well as current assets
in analyzing the performance of the company.8 Total assets turnover is categorized into two
categories such as fixed as well as current assets in which assets are categorized according to
the time period.9 Asset held for short span of time is considered as current and on another
hand, assets held for long-term purpose comes under fixed asset.
The performance of the business is ascertained by an entity by taking total
assets which will be compared with the sales and the revenues generated by a firm in a
7 GOH, Clarence. "The predictive audit: Why prevention is better than a cure." (2017).
8 Venkatesh, K. A., N. Pushkala, and J. Mahamayi. "Profit Efficiency of Foreign Banks in
India in the context of Off-Balance Sheet Items: A DEA Approach." (2017).
9 PY Lai, Karen, and Michael Samers. "Conceptualizing Islamic banking and finance: a
comparison of its development and governance in Malaysia and Singapore." The Pacific
Review 30, no. 3 (2017): 405-424.
8
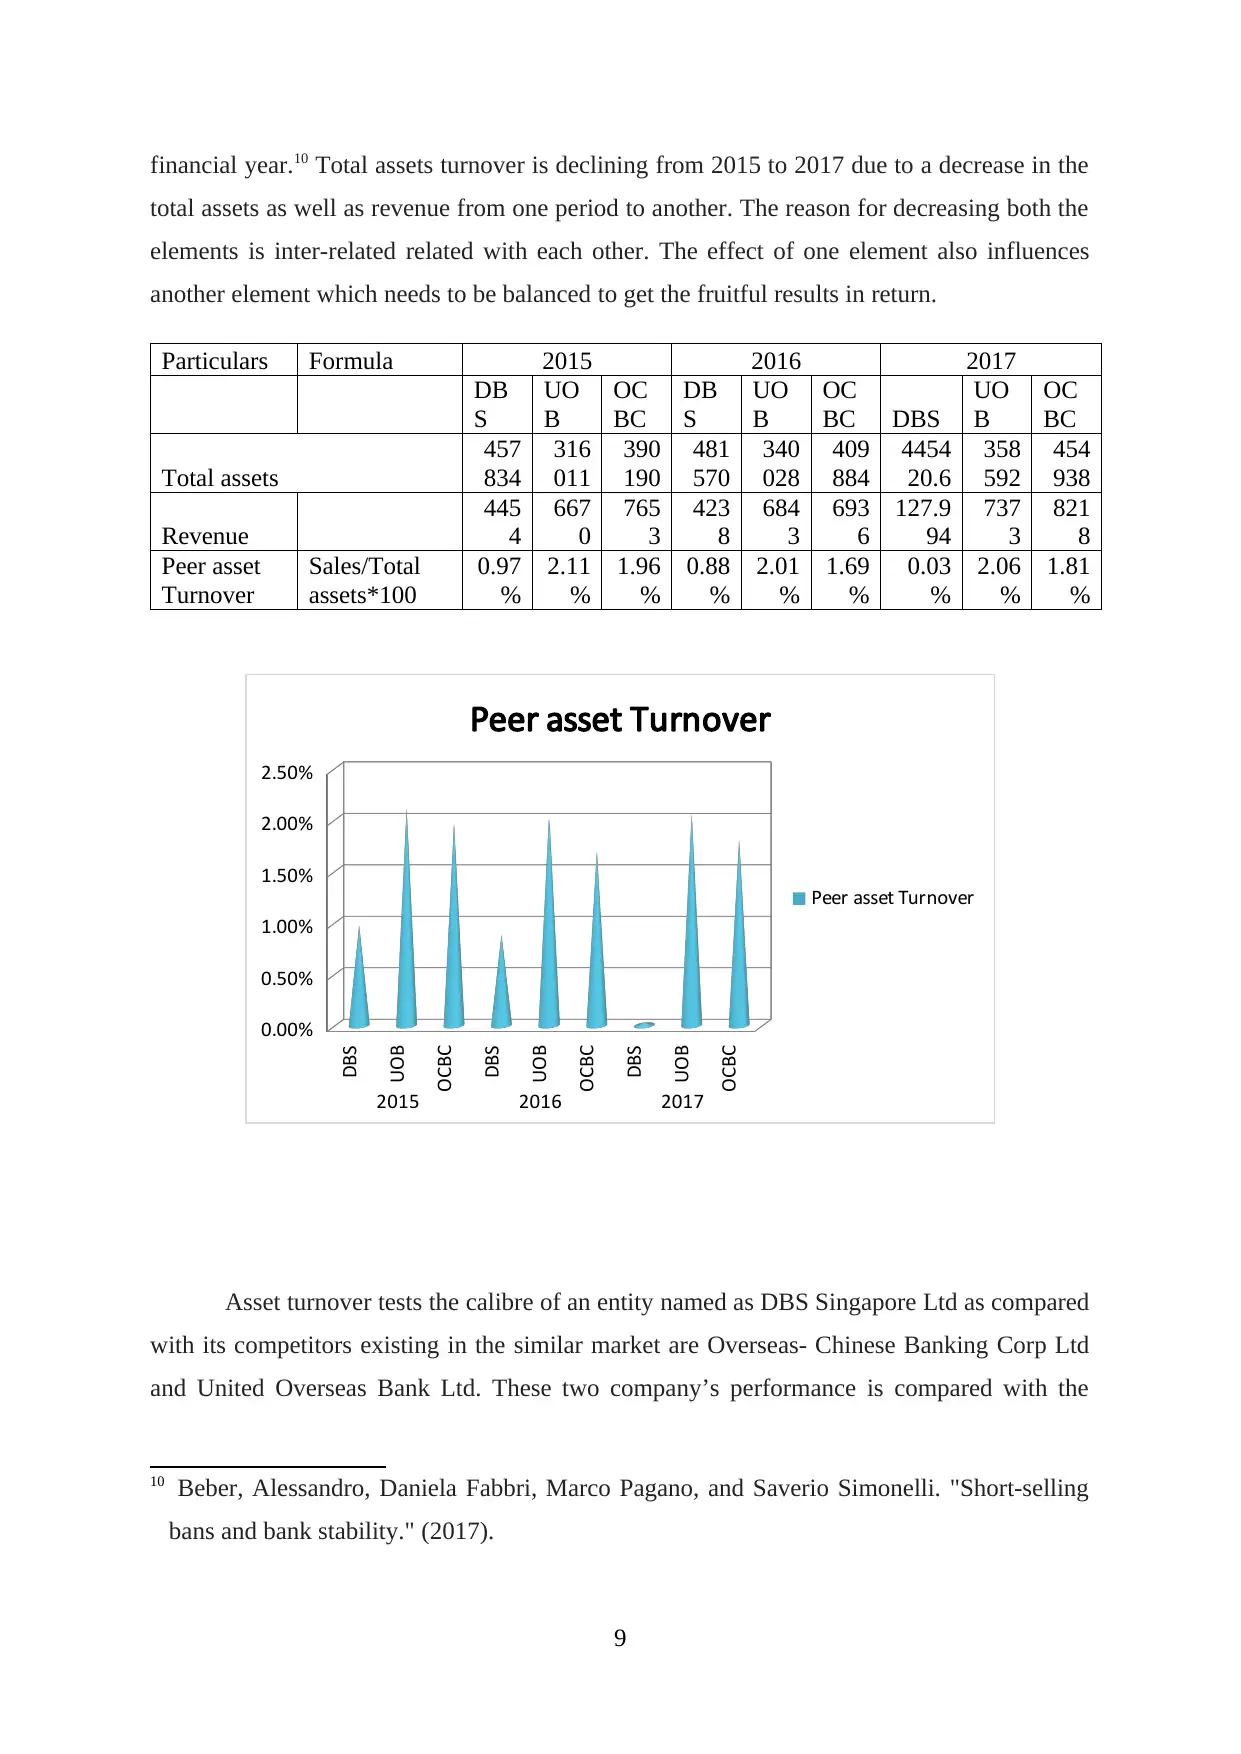
financial year.10 Total assets turnover is declining from 2015 to 2017 due to a decrease in the
total assets as well as revenue from one period to another. The reason for decreasing both the
elements is inter-related related with each other. The effect of one element also influences
another element which needs to be balanced to get the fruitful results in return.
Particulars Formula 2015 2016 2017
DB
S
UO
B
OC
BC
DB
S
UO
B
OC
BC DBS
UO
B
OC
BC
Total assets
457
834
316
011
390
190
481
570
340
028
409
884
4454
20.6
358
592
454
938
Revenue
445
4
667
0
765
3
423
8
684
3
693
6
127.9
94
737
3
821
8
Peer asset
Turnover
Sales/Total
assets*100
0.97
%
2.11
%
1.96
%
0.88
%
2.01
%
1.69
%
0.03
%
2.06
%
1.81
%
DBS
UOB
OCBC
DBS
UOB
OCBC
DBS
UOB
OCBC
2015 2016 2017
0.00%
0.50%
1.00%
1.50%
2.00%
2.50%
Peer asset Turnover
Peer asset Turnover
Asset turnover tests the calibre of an entity named as DBS Singapore Ltd as compared
with its competitors existing in the similar market are Overseas- Chinese Banking Corp Ltd
and United Overseas Bank Ltd. These two company’s performance is compared with the
10 Beber, Alessandro, Daniela Fabbri, Marco Pagano, and Saverio Simonelli. "Short-selling
bans and bank stability." (2017).
9
⊘ This is a preview!⊘
Do you want full access?
Subscribe today to unlock all pages.
Trusted by 1+ million students worldwide
1 out of 26
Related Documents


Your All-in-One AI-Powered Toolkit for Academic Success.
+13062052269
info@desklib.com
Available 24*7 on WhatsApp / Email
![[object Object]](/_next/static/media/star-bottom.7253800d.svg)
Unlock your academic potential
Copyright © 2020–2026 A2Z Services. All Rights Reserved. Developed and managed by ZUCOL.