4MBA-F6 Business Valuation: DCF Drivers for Tata Steel
VerifiedAdded on 2022/01/27
|28
|4637
|159
Project
AI Summary
This project analyzes the drivers of Discounted Cash Flow (DCF) valuation for Tata Steel. It begins with an industry analysis of the steel sector in India, examining production, consumption, import/export trends, and growth drivers influenced by factors such as the automotive and construction industries and government regulations. The project then delves into a detailed company analysis of Tata Steel, including its product portfolio, shareholding pattern, and peer comparison. The analysis incorporates key financial ratios such as ROA, ROE, ROCE, asset turnover, and profitability margins, comparing Tata Steel's performance to industry benchmarks and competitors. The project identifies revenue drivers and discusses their impact on valuation, providing a comprehensive overview of the factors influencing Tata Steel's financial performance and market position. The analysis is based on the MBA program at Christ University, Bangalore, in July 2021.
BUSINESS VALUATION
CIA 1(A): Identifying the drivers of DCF valuation of a listed company
4MBA-F6
SUBMITTED TO:
Dr. Anirban Ghatak
SUBMITTED BY:
Treesa Thomas-2027854
Raghav Agarwal-2028004
Abhishek Srivastava-2028003
Krithika Ponnambalam-2027856
MBA PROGRAMME
SCHOOL OF BUSINESS AND MANAGEMENT
CHRIST (DEEMED TO BE UNIVERSITY), BANGALORE
JULY 2021
Paraphrase This Document
Need a fresh take? Get an instant paraphrase of this document with our AI Paraphraser
TABLE OF CONTENT
S.NO DESCRIPTION PAGE NO.
1 INDUSTRY ANALYSIS 3 ~ 8
2 COMPANY ANALYSIS 8 ~ 12
3 INDUSTRY RATIOS 13 ~ 21
4 REVENUE DRIVERS 21 ~ 27
5 References 28
S.NO DESCRIPTION PAGE NO.
1 INDUSTRY ANALYSIS 3 ~ 8
2 COMPANY ANALYSIS 8 ~ 12
3 INDUSTRY RATIOS 13 ~ 21
4 REVENUE DRIVERS 21 ~ 27
5 References 28
INDUSTRY ANALYSIS
India was the world’s second-largest producer of steel till 2019, with a total production of
111.2 MT. For industrialization, metal is one of the core drivers, and among metal, steel held
a dominant position. Hence, the production and consumption of steel are widely regarded as
indicators of economic progress. That is why metal is considered the forefront of industrial
development and the backbone of any economy.
Demand for steel in different sectors will drive the economy, and the consumption of steel in
India's infrastructure is expected to increase to 11% by FY26. Various factors which could be
one of the reasons for the increase in consumption of steel are: ~ steel demand in the
automotive sector may increase due to rise in demand of automobiles, during the 2nd wave in
this pandemic steel plant prove to be beneficial for the Indian healthcare sector as they
produce oxygen cylinders for COVID patients and the housing industry can see a rise due to
government initiative of affordable housing (Smart cities) which can boost steel industry. It is
estimated that about 158 lakh MT of steel is likely to be consumed by Pradhan Mantri Awas
Yojana (Urban) to construct houses that are sanctioned.
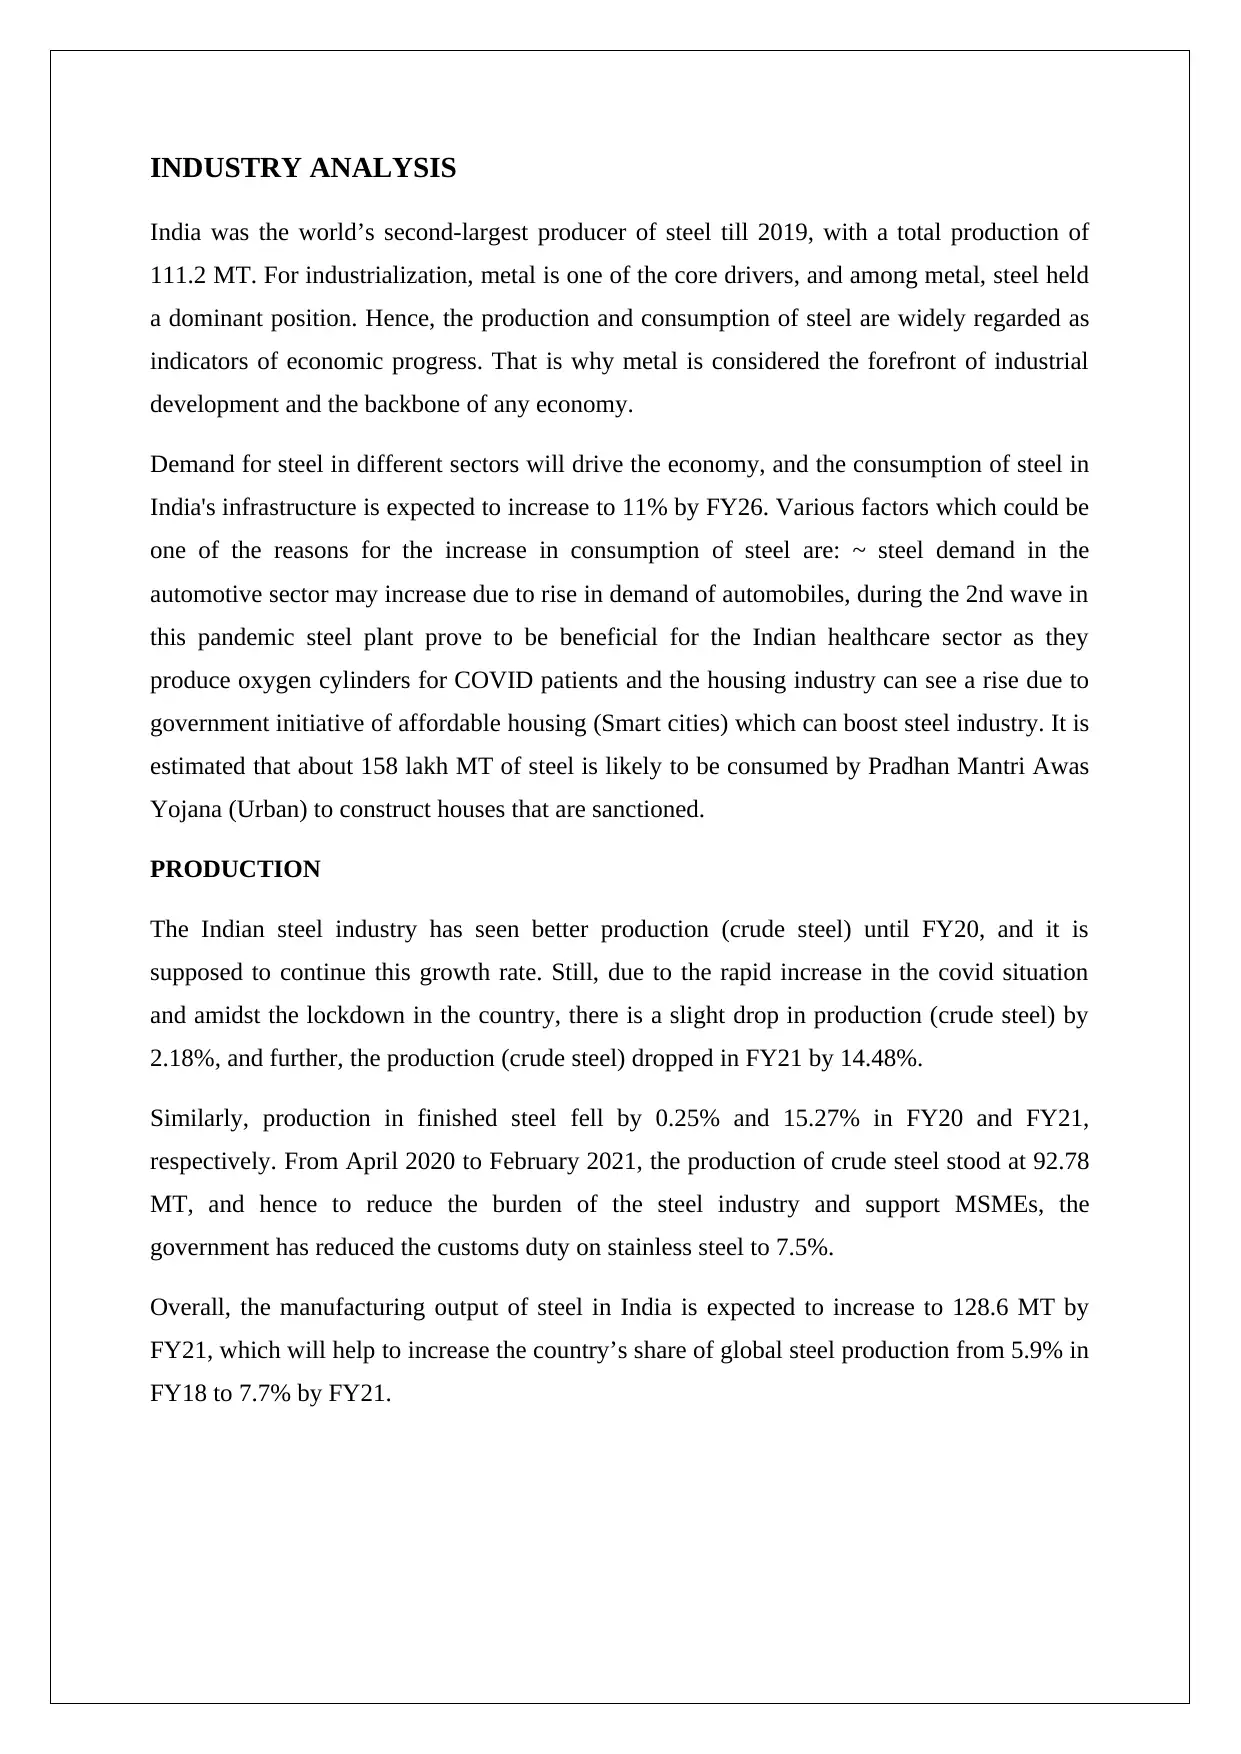
PRODUCTION
The Indian steel industry has seen better production (crude steel) until FY20, and it is
supposed to continue this growth rate. Still, due to the rapid increase in the covid situation
and amidst the lockdown in the country, there is a slight drop in production (crude steel) by
2.18%, and further, the production (crude steel) dropped in FY21 by 14.48%.
Similarly, production in finished steel fell by 0.25% and 15.27% in FY20 and FY21,
respectively. From April 2020 to February 2021, the production of crude steel stood at 92.78
MT, and hence to reduce the burden of the steel industry and support MSMEs, the
government has reduced the customs duty on stainless steel to 7.5%.
Overall, the manufacturing output of steel in India is expected to increase to 128.6 MT by
FY21, which will help to increase the country’s share of global steel production from 5.9% in
FY18 to 7.7% by FY21.
India was the world’s second-largest producer of steel till 2019, with a total production of
111.2 MT. For industrialization, metal is one of the core drivers, and among metal, steel held
a dominant position. Hence, the production and consumption of steel are widely regarded as
indicators of economic progress. That is why metal is considered the forefront of industrial
development and the backbone of any economy.
Demand for steel in different sectors will drive the economy, and the consumption of steel in
India's infrastructure is expected to increase to 11% by FY26. Various factors which could be
one of the reasons for the increase in consumption of steel are: ~ steel demand in the
automotive sector may increase due to rise in demand of automobiles, during the 2nd wave in
this pandemic steel plant prove to be beneficial for the Indian healthcare sector as they
produce oxygen cylinders for COVID patients and the housing industry can see a rise due to
government initiative of affordable housing (Smart cities) which can boost steel industry. It is
estimated that about 158 lakh MT of steel is likely to be consumed by Pradhan Mantri Awas
Yojana (Urban) to construct houses that are sanctioned.
PRODUCTION
The Indian steel industry has seen better production (crude steel) until FY20, and it is
supposed to continue this growth rate. Still, due to the rapid increase in the covid situation
and amidst the lockdown in the country, there is a slight drop in production (crude steel) by
2.18%, and further, the production (crude steel) dropped in FY21 by 14.48%.
Similarly, production in finished steel fell by 0.25% and 15.27% in FY20 and FY21,
respectively. From April 2020 to February 2021, the production of crude steel stood at 92.78
MT, and hence to reduce the burden of the steel industry and support MSMEs, the
government has reduced the customs duty on stainless steel to 7.5%.
Overall, the manufacturing output of steel in India is expected to increase to 128.6 MT by
FY21, which will help to increase the country’s share of global steel production from 5.9% in
FY18 to 7.7% by FY21.
⊘ This is a preview!⊘
Do you want full access?
Subscribe today to unlock all pages.
Trusted by 1+ million students worldwide
(Source: IBEF.ORG)
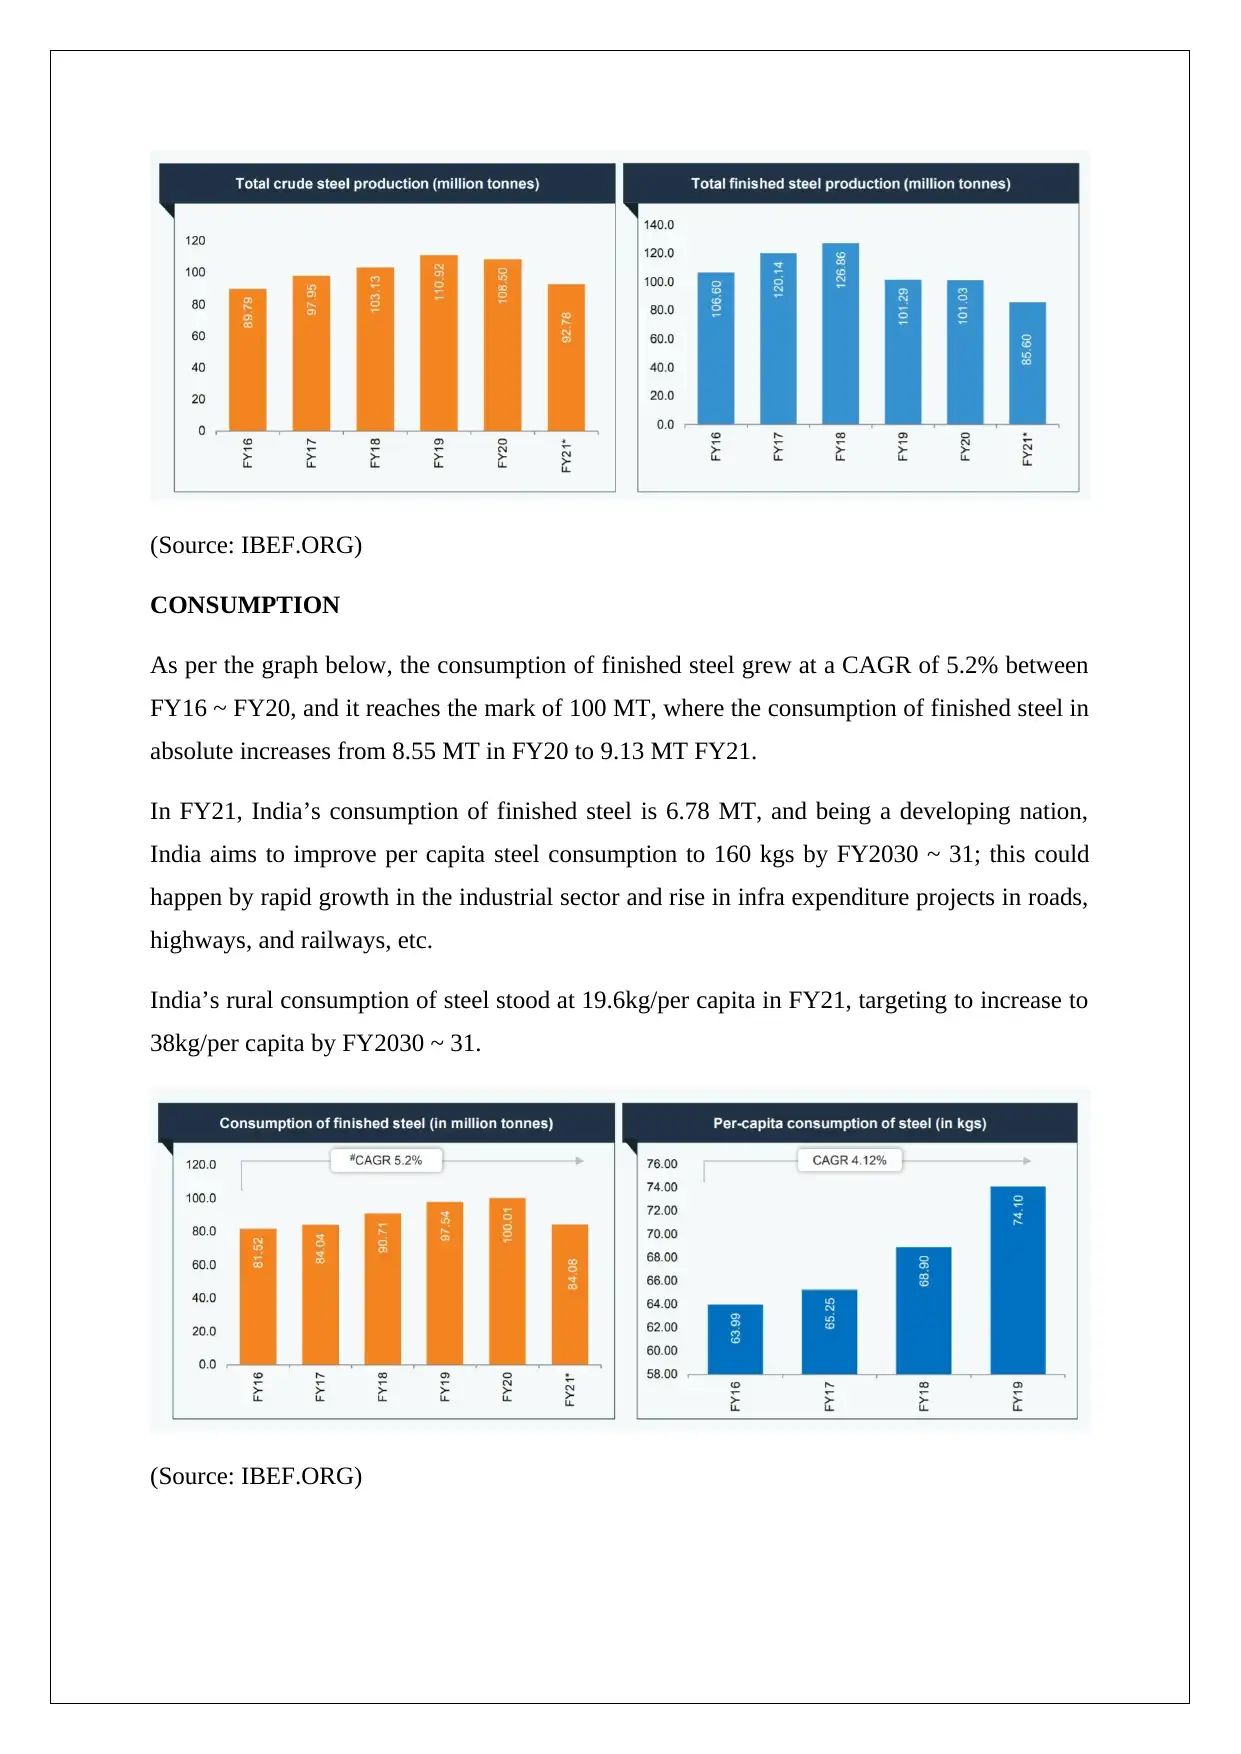
CONSUMPTION
As per the graph below, the consumption of finished steel grew at a CAGR of 5.2% between
FY16 ~ FY20, and it reaches the mark of 100 MT, where the consumption of finished steel in
absolute increases from 8.55 MT in FY20 to 9.13 MT FY21.
In FY21, India’s consumption of finished steel is 6.78 MT, and being a developing nation,
India aims to improve per capita steel consumption to 160 kgs by FY2030 ~ 31; this could
happen by rapid growth in the industrial sector and rise in infra expenditure projects in roads,
highways, and railways, etc.
India’s rural consumption of steel stood at 19.6kg/per capita in FY21, targeting to increase to
38kg/per capita by FY2030 ~ 31.
(Source: IBEF.ORG)
Paraphrase This Document
Need a fresh take? Get an instant paraphrase of this document with our AI Paraphraser
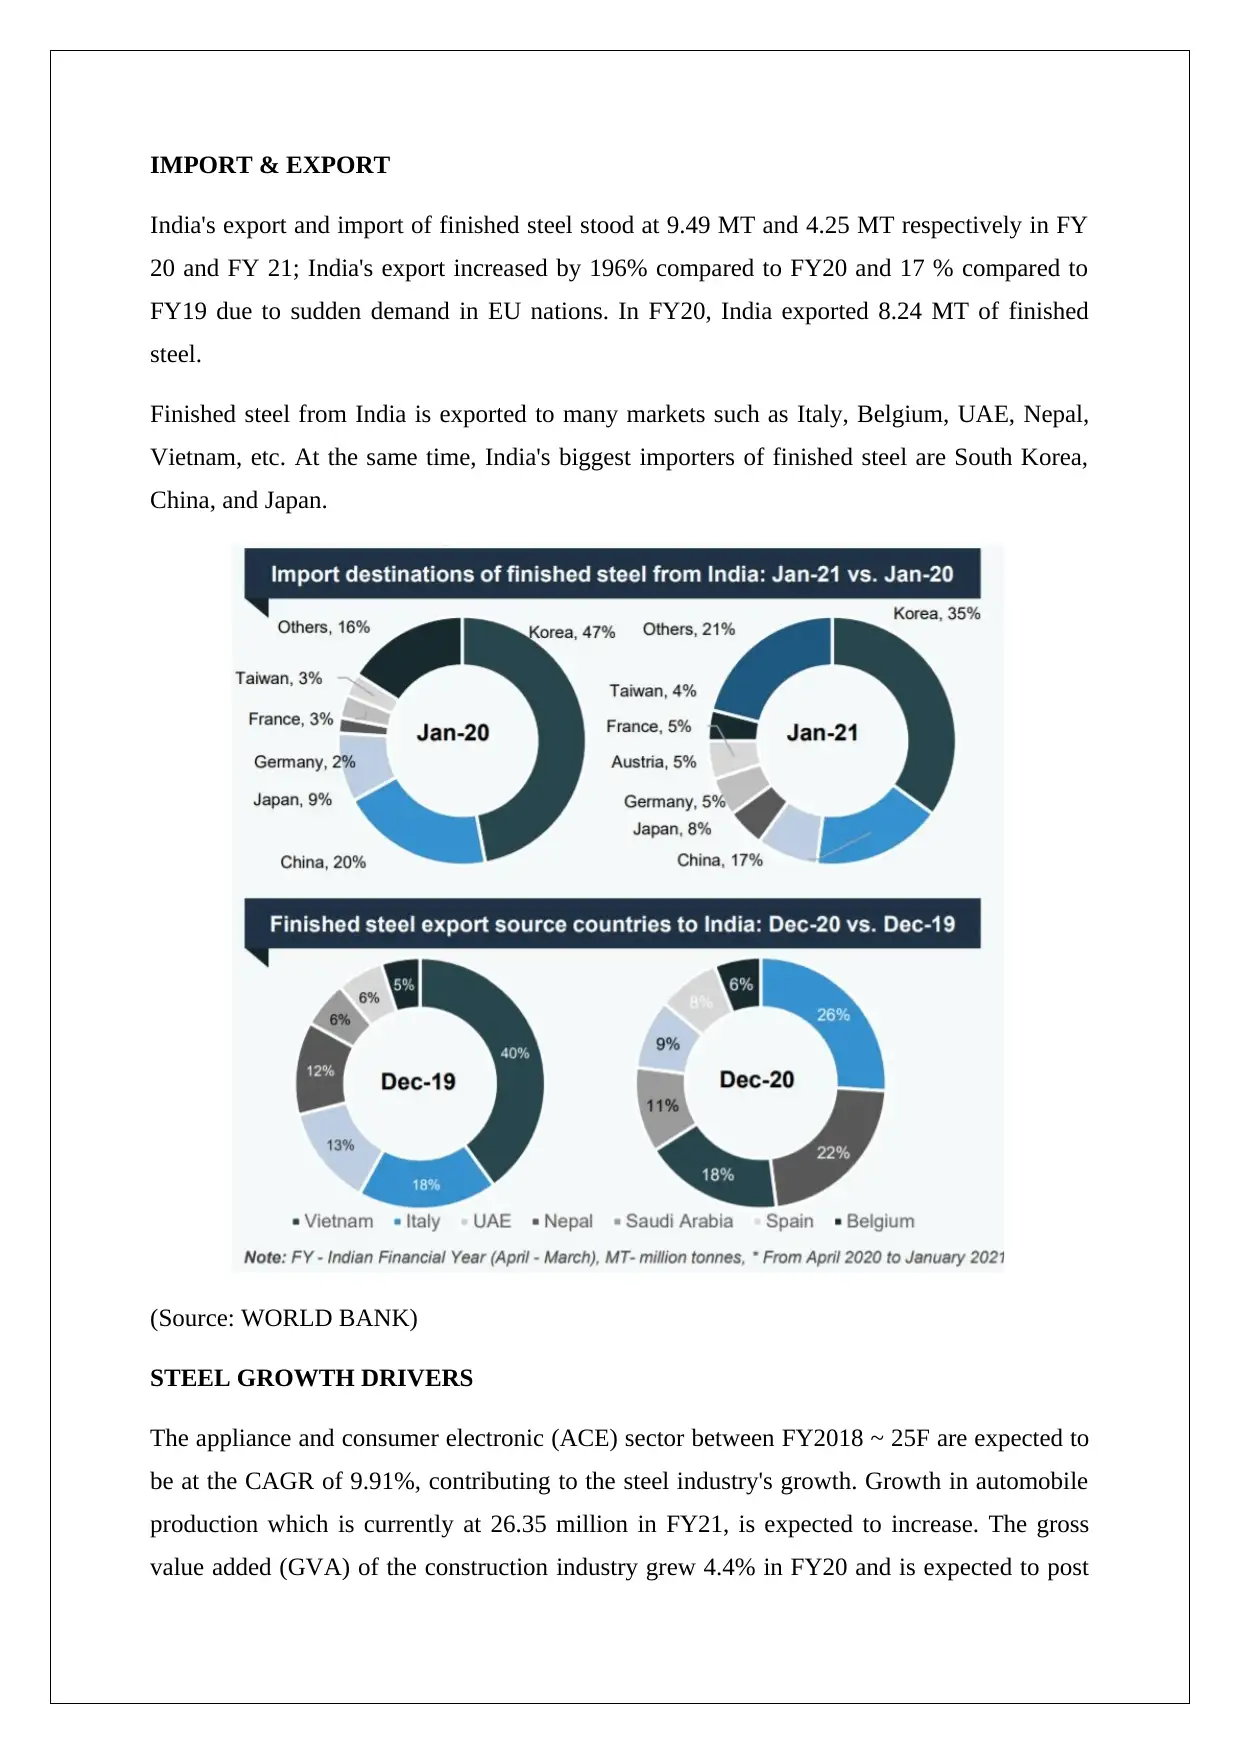
IMPORT & EXPORT
India's export and import of finished steel stood at 9.49 MT and 4.25 MT respectively in FY
20 and FY 21; India's export increased by 196% compared to FY20 and 17 % compared to
FY19 due to sudden demand in EU nations. In FY20, India exported 8.24 MT of finished
steel.
Finished steel from India is exported to many markets such as Italy, Belgium, UAE, Nepal,
Vietnam, etc. At the same time, India's biggest importers of finished steel are South Korea,
China, and Japan.
(Source: WORLD BANK)
STEEL GROWTH DRIVERS
The appliance and consumer electronic (ACE) sector between FY2018 ~ 25F are expected to
be at the CAGR of 9.91%, contributing to the steel industry's growth. Growth in automobile
production which is currently at 26.35 million in FY21, is expected to increase. The gross
value added (GVA) of the construction industry grew 4.4% in FY20 and is expected to post
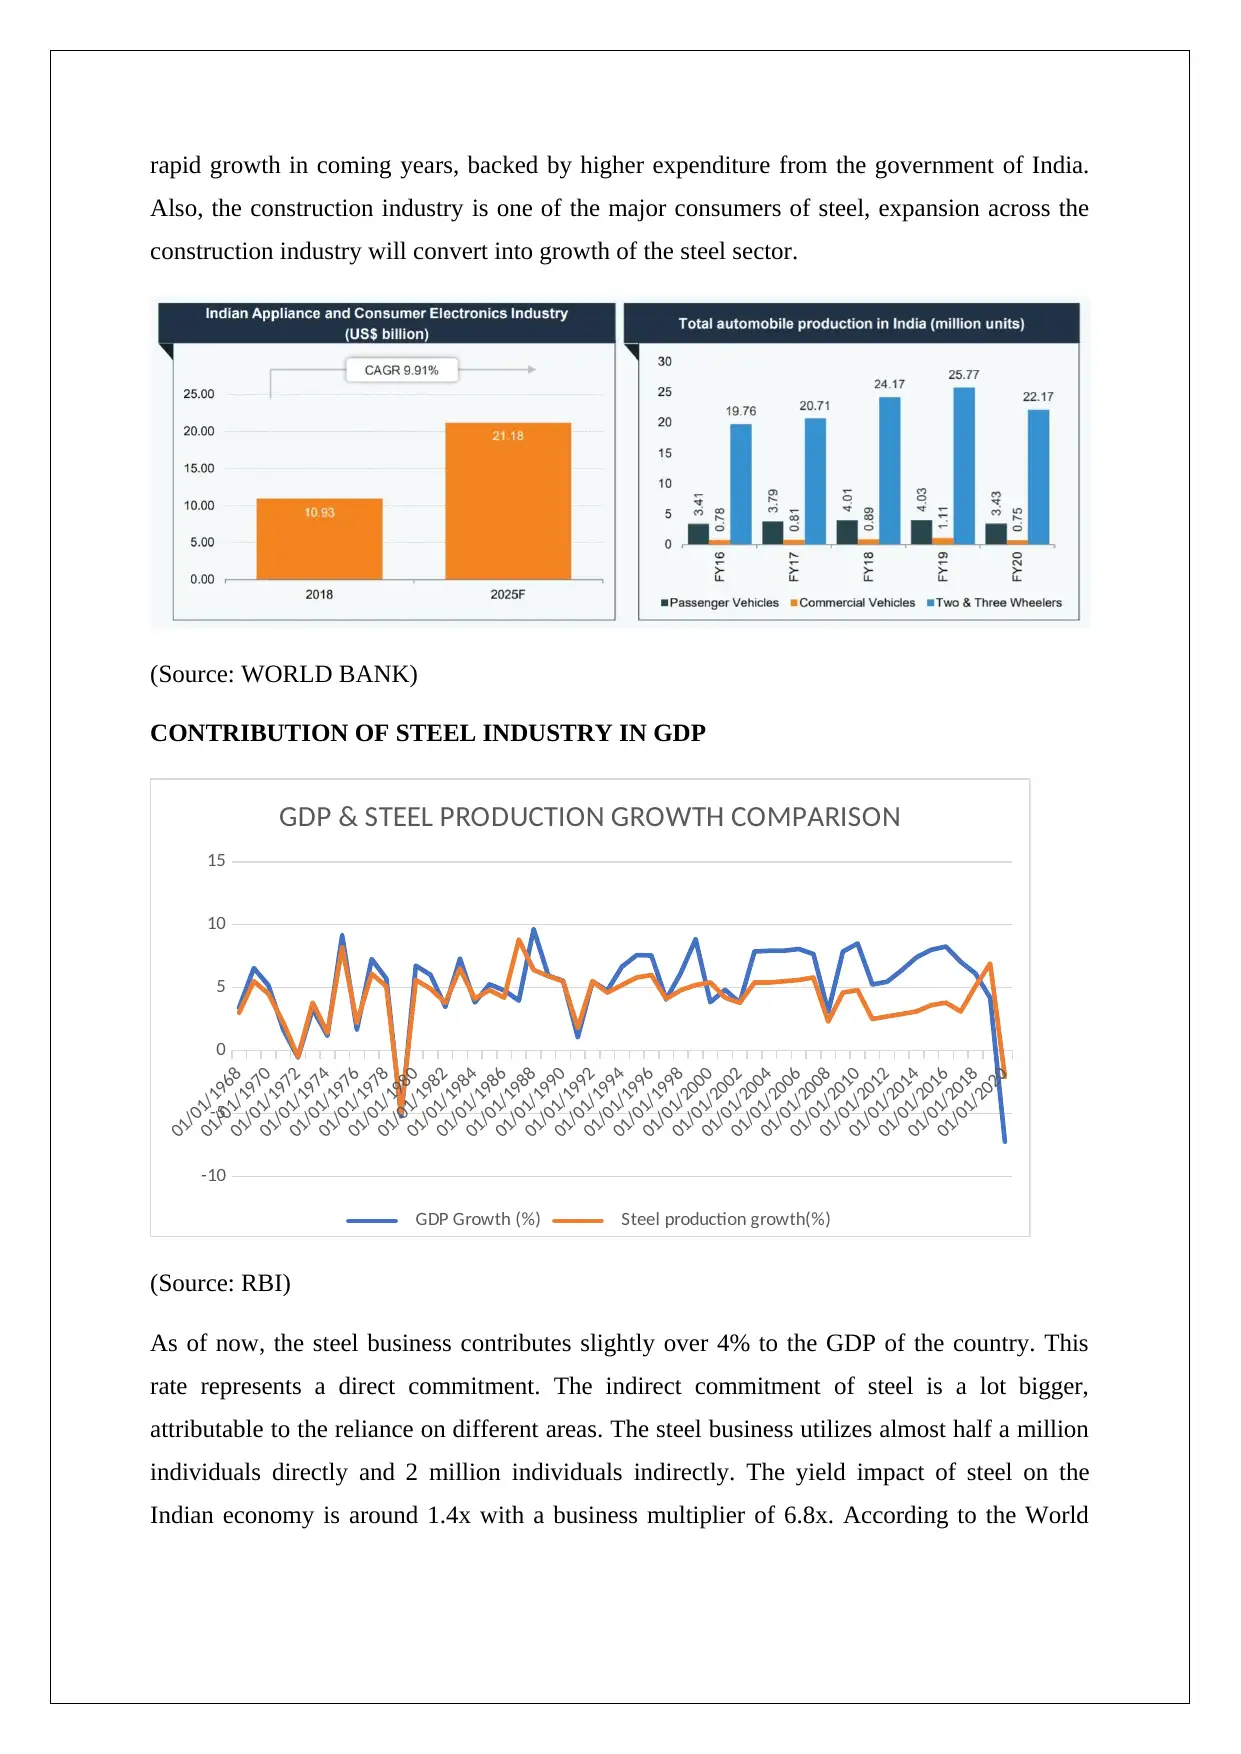
rapid growth in coming years, backed by higher expenditure from the government of India.
Also, the construction industry is one of the major consumers of steel, expansion across the
construction industry will convert into growth of the steel sector.
(Source: WORLD BANK)
CONTRIBUTION OF STEEL INDUSTRY IN GDP
01/01/1968
01/01/1970
01/01/1972
01/01/1974
01/01/1976
01/01/1978
01/01/1980
01/01/1982
01/01/1984
01/01/1986
01/01/1988
01/01/1990
01/01/1992
01/01/1994
01/01/1996
01/01/1998
01/01/2000
01/01/2002
01/01/2004
01/01/2006
01/01/2008
01/01/2010
01/01/2012
01/01/2014
01/01/2016
01/01/2018
01/01/2020
-10
-5
0
5
10
15
GDP & STEEL PRODUCTION GROWTH COMPARISON
GDP Growth (%) Steel production growth(%)
(Source: RBI)
As of now, the steel business contributes slightly over 4% to the GDP of the country. This
rate represents a direct commitment. The indirect commitment of steel is a lot bigger,
attributable to the reliance on different areas. The steel business utilizes almost half a million
individuals directly and 2 million individuals indirectly. The yield impact of steel on the
Indian economy is around 1.4x with a business multiplier of 6.8x. According to the World
⊘ This is a preview!⊘
Do you want full access?
Subscribe today to unlock all pages.
Trusted by 1+ million students worldwide
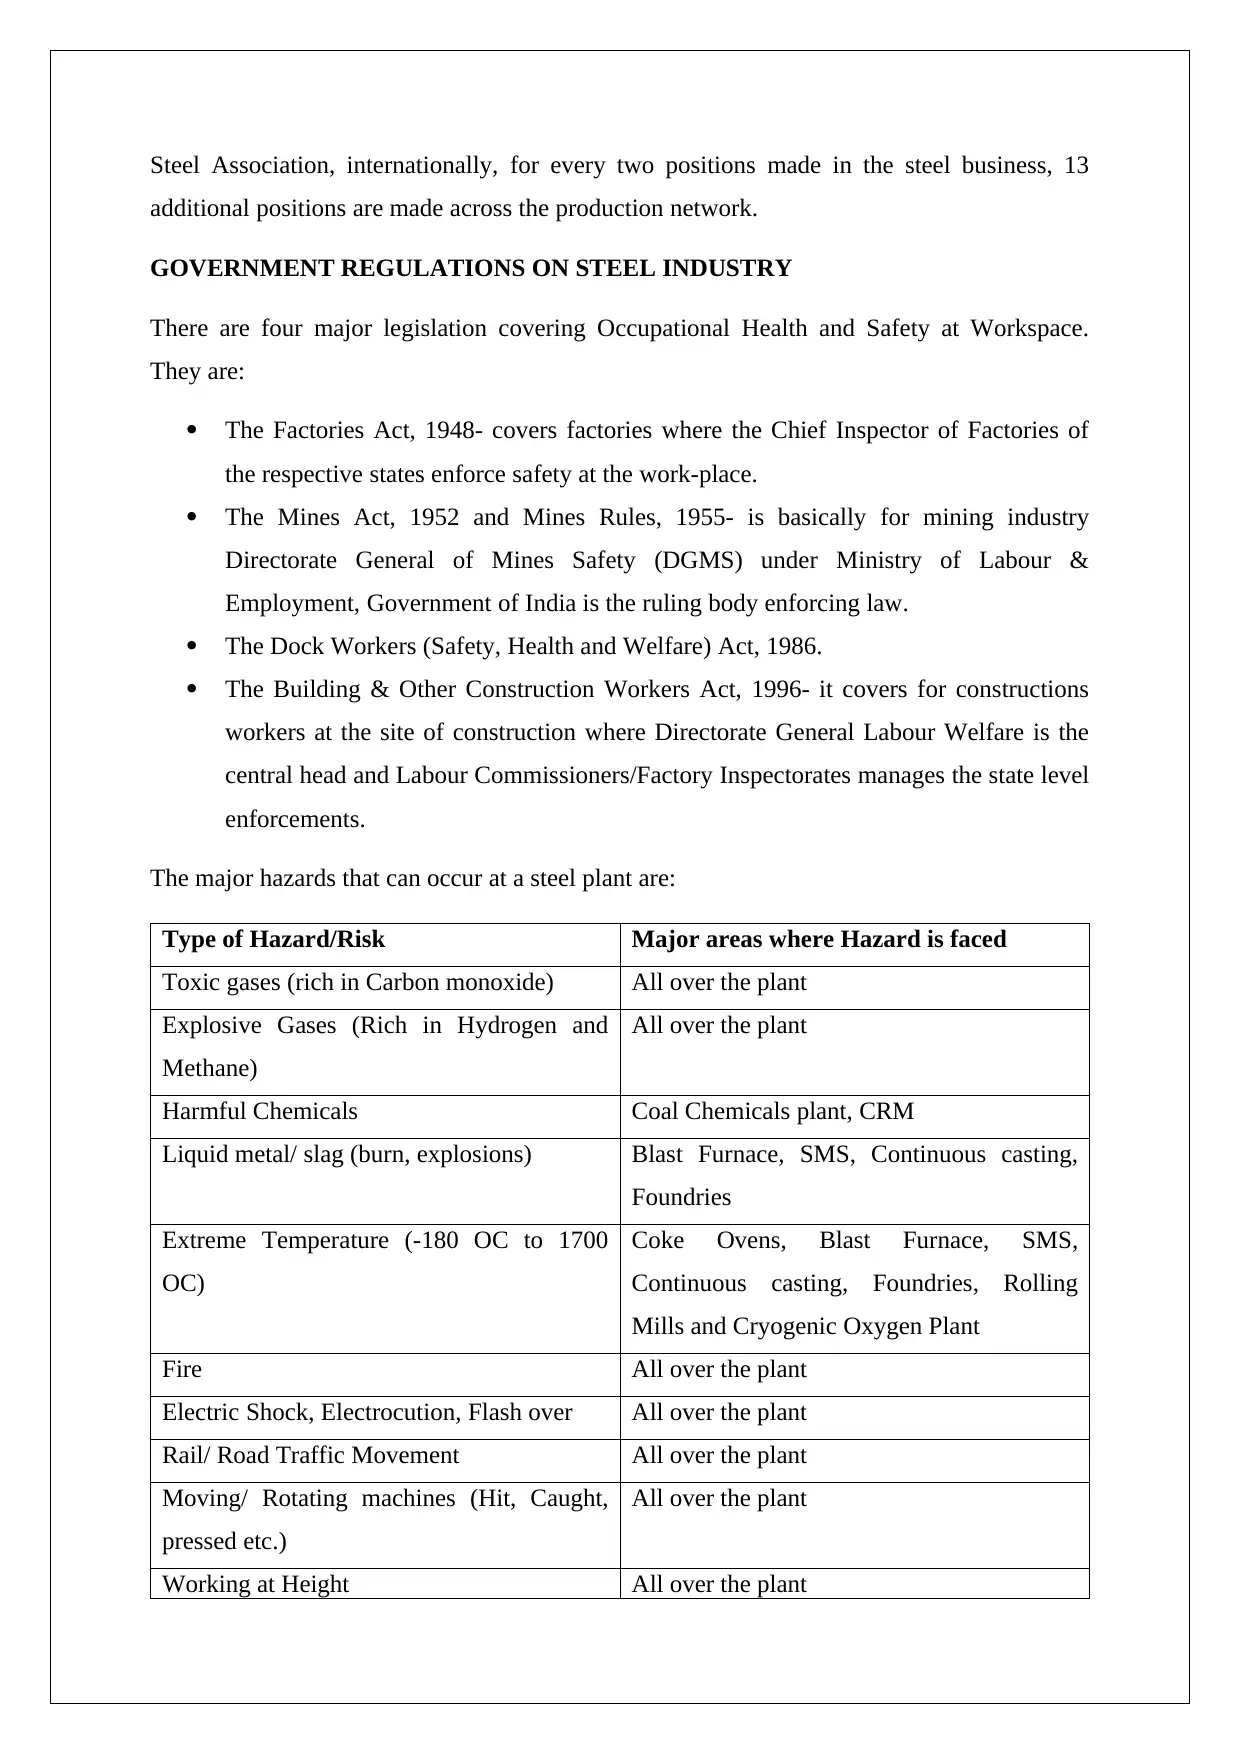
Steel Association, internationally, for every two positions made in the steel business, 13
additional positions are made across the production network.
GOVERNMENT REGULATIONS ON STEEL INDUSTRY
There are four major legislation covering Occupational Health and Safety at Workspace.
They are:
The Factories Act, 1948- covers factories where the Chief Inspector of Factories of
the respective states enforce safety at the work-place.
The Mines Act, 1952 and Mines Rules, 1955- is basically for mining industry
Directorate General of Mines Safety (DGMS) under Ministry of Labour &
Employment, Government of India is the ruling body enforcing law.
The Dock Workers (Safety, Health and Welfare) Act, 1986.
The Building & Other Construction Workers Act, 1996- it covers for constructions
workers at the site of construction where Directorate General Labour Welfare is the
central head and Labour Commissioners/Factory Inspectorates manages the state level
enforcements.
The major hazards that can occur at a steel plant are:
Type of Hazard/Risk Major areas where Hazard is faced
Toxic gases (rich in Carbon monoxide) All over the plant
Explosive Gases (Rich in Hydrogen and
Methane)
All over the plant
Harmful Chemicals Coal Chemicals plant, CRM
Liquid metal/ slag (burn, explosions) Blast Furnace, SMS, Continuous casting,
Foundries
Extreme Temperature (-180 OC to 1700
OC)
Coke Ovens, Blast Furnace, SMS,
Continuous casting, Foundries, Rolling
Mills and Cryogenic Oxygen Plant
Fire All over the plant
Electric Shock, Electrocution, Flash over All over the plant
Rail/ Road Traffic Movement All over the plant
Moving/ Rotating machines (Hit, Caught,
pressed etc.)
All over the plant
Working at Height All over the plant
Paraphrase This Document
Need a fresh take? Get an instant paraphrase of this document with our AI Paraphraser
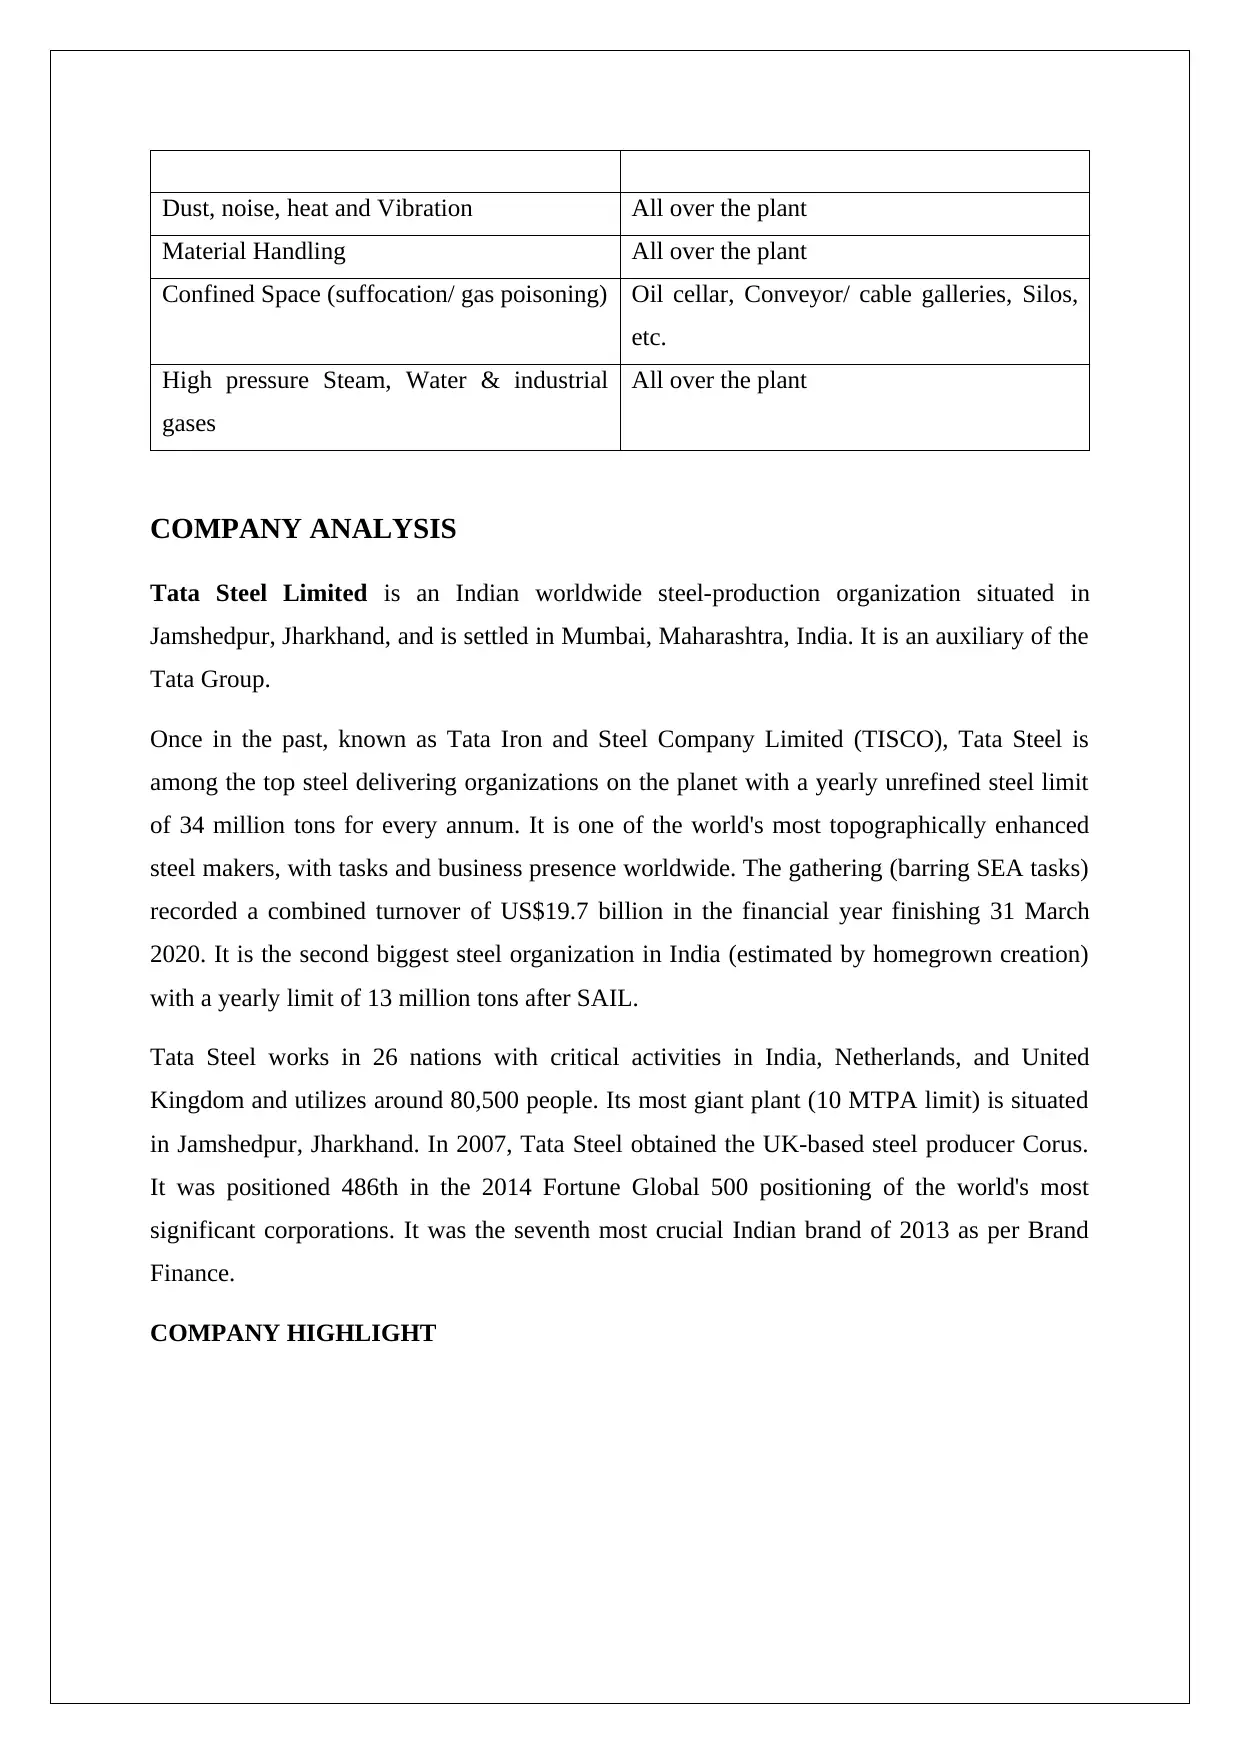
Dust, noise, heat and Vibration All over the plant
Material Handling All over the plant
Confined Space (suffocation/ gas poisoning) Oil cellar, Conveyor/ cable galleries, Silos,
etc.
High pressure Steam, Water & industrial
gases
All over the plant
COMPANY ANALYSIS
Tata Steel Limited is an Indian worldwide steel-production organization situated in
Jamshedpur, Jharkhand, and is settled in Mumbai, Maharashtra, India. It is an auxiliary of the
Tata Group.
Once in the past, known as Tata Iron and Steel Company Limited (TISCO), Tata Steel is
among the top steel delivering organizations on the planet with a yearly unrefined steel limit
of 34 million tons for every annum. It is one of the world's most topographically enhanced
steel makers, with tasks and business presence worldwide. The gathering (barring SEA tasks)
recorded a combined turnover of US$19.7 billion in the financial year finishing 31 March
2020. It is the second biggest steel organization in India (estimated by homegrown creation)
with a yearly limit of 13 million tons after SAIL.
Tata Steel works in 26 nations with critical activities in India, Netherlands, and United
Kingdom and utilizes around 80,500 people. Its most giant plant (10 MTPA limit) is situated
in Jamshedpur, Jharkhand. In 2007, Tata Steel obtained the UK-based steel producer Corus.
It was positioned 486th in the 2014 Fortune Global 500 positioning of the world's most
significant corporations. It was the seventh most crucial Indian brand of 2013 as per Brand
Finance.
COMPANY HIGHLIGHT
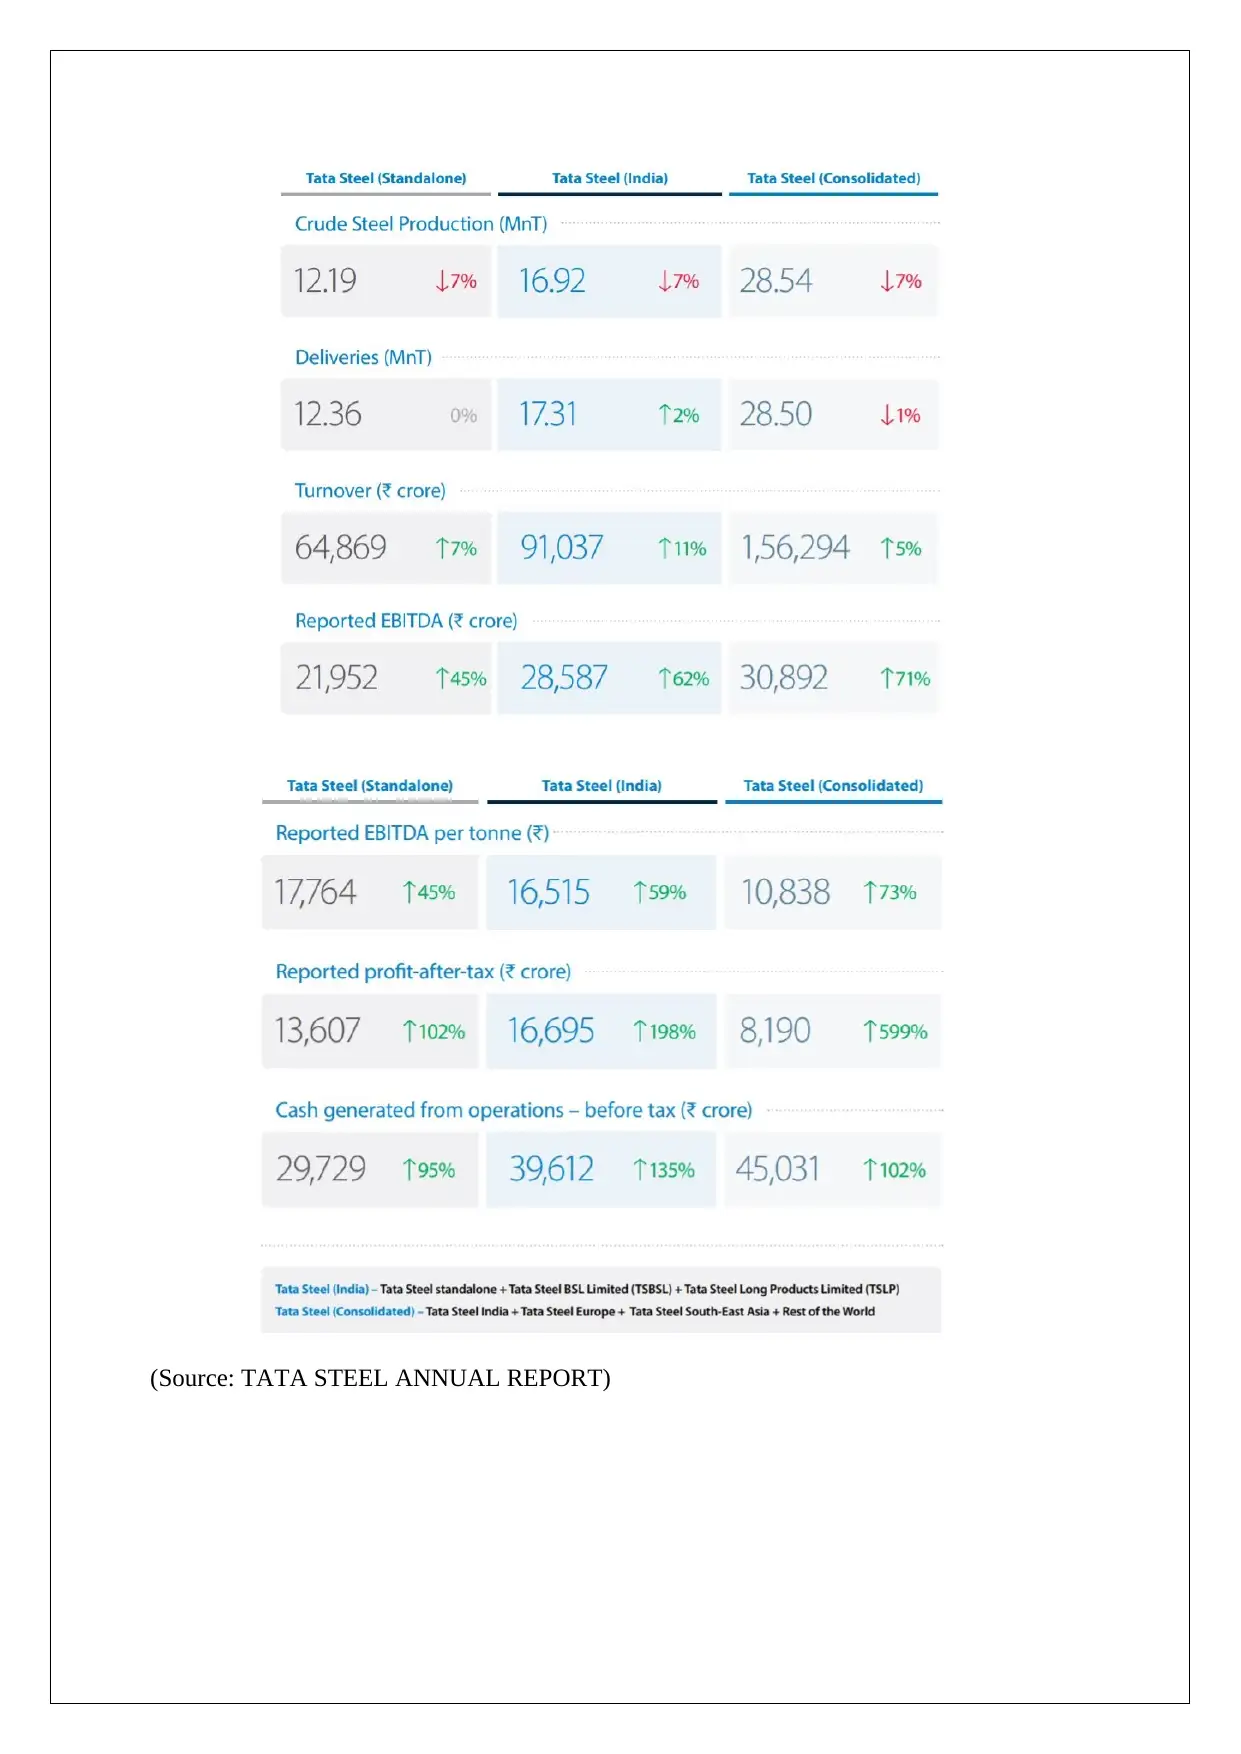
(Source: TATA STEEL ANNUAL REPORT)
⊘ This is a preview!⊘
Do you want full access?
Subscribe today to unlock all pages.
Trusted by 1+ million students worldwide
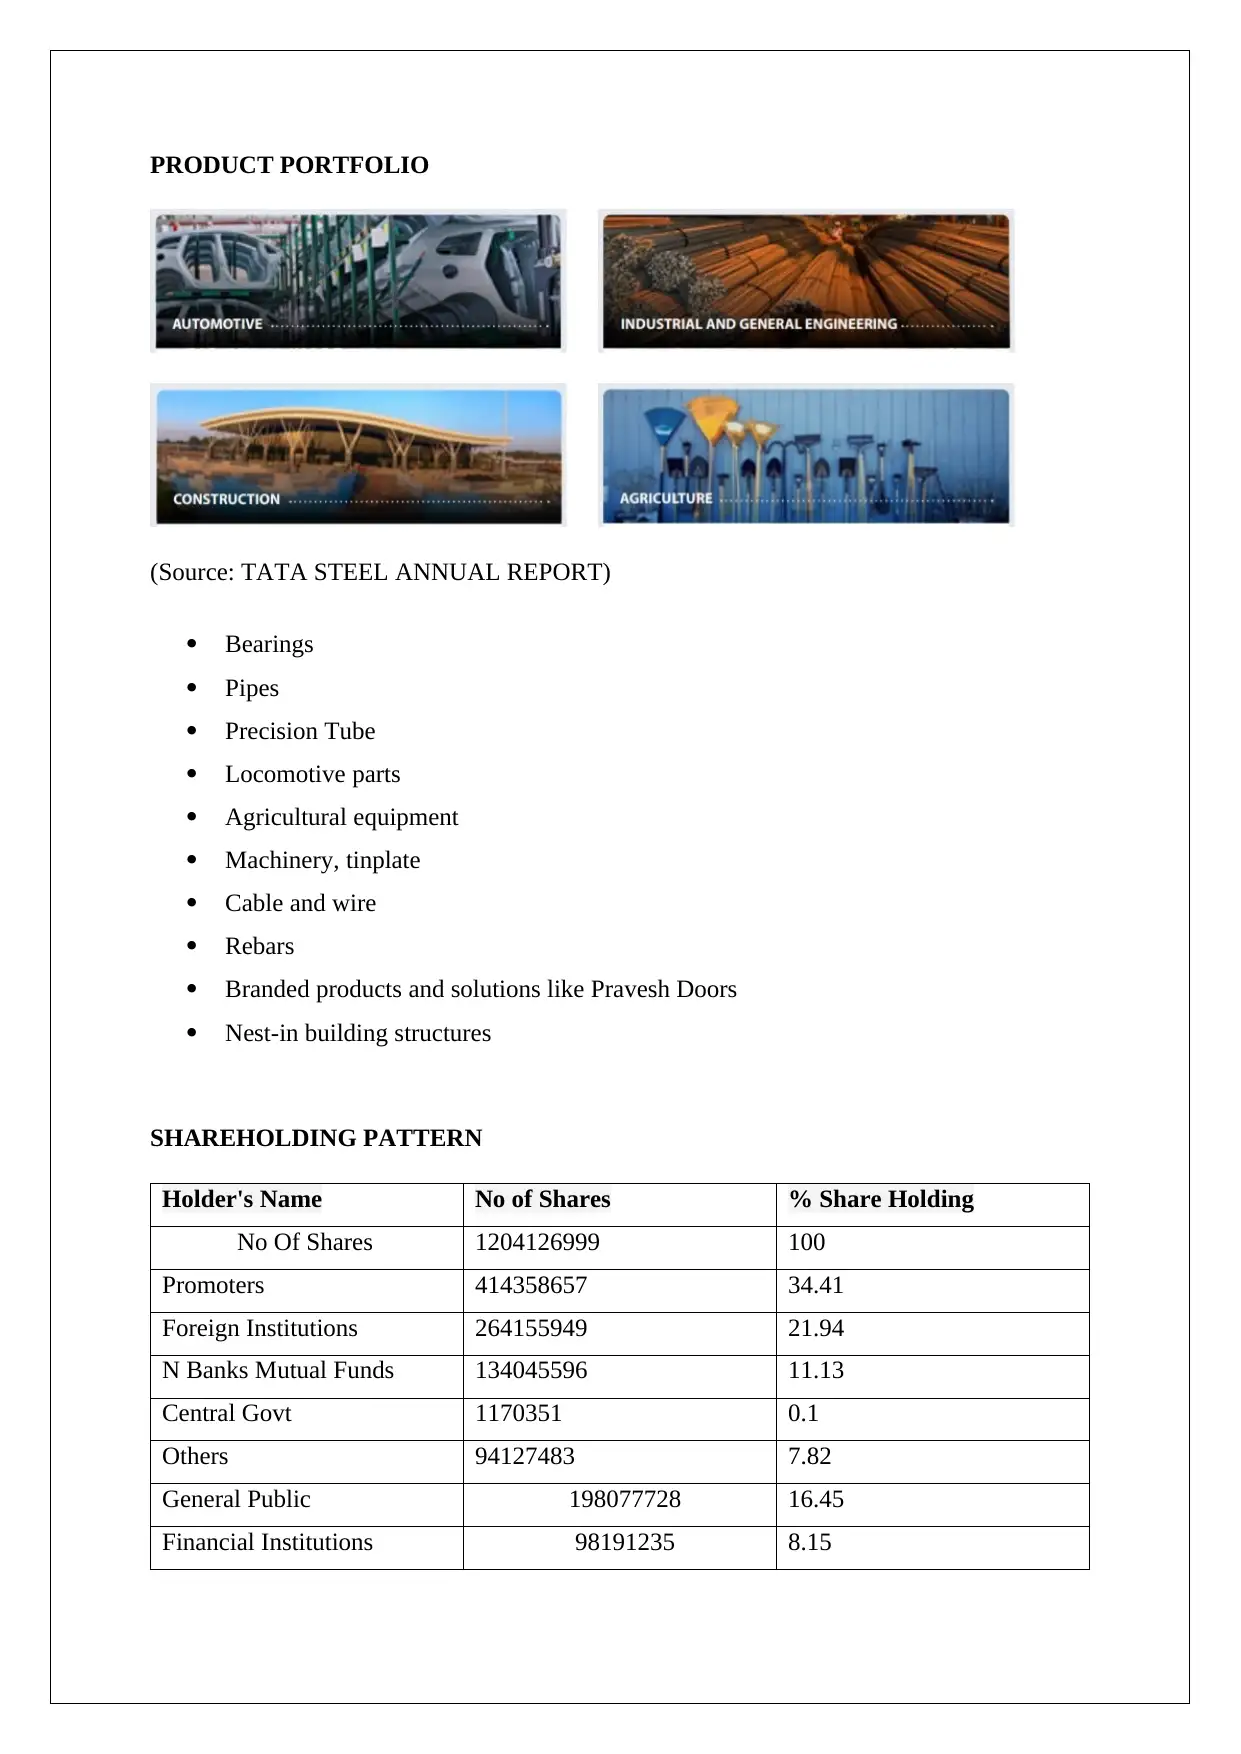
PRODUCT PORTFOLIO
(Source: TATA STEEL ANNUAL REPORT)
Bearings
Pipes
Precision Tube
Locomotive parts
Agricultural equipment
Machinery, tinplate
Cable and wire
Rebars
Branded products and solutions like Pravesh Doors
Nest-in building structures
SHAREHOLDING PATTERN
Holder's Name No of Shares % Share Holding
No Of Shares 1204126999 100
Promoters 414358657 34.41
Foreign Institutions 264155949 21.94
N Banks Mutual Funds 134045596 11.13
Central Govt 1170351 0.1
Others 94127483 7.82
General Public 198077728 16.45
Financial Institutions 98191235 8.15
Paraphrase This Document
Need a fresh take? Get an instant paraphrase of this document with our AI Paraphraser
Promoters
34%
Foreign Institutions
22%
N Banks
Mutual
Funds
11%
Central
Govt
0%
Others
8%
General
Public
16%
Financial Institutions
8%
Shareholding Pattern
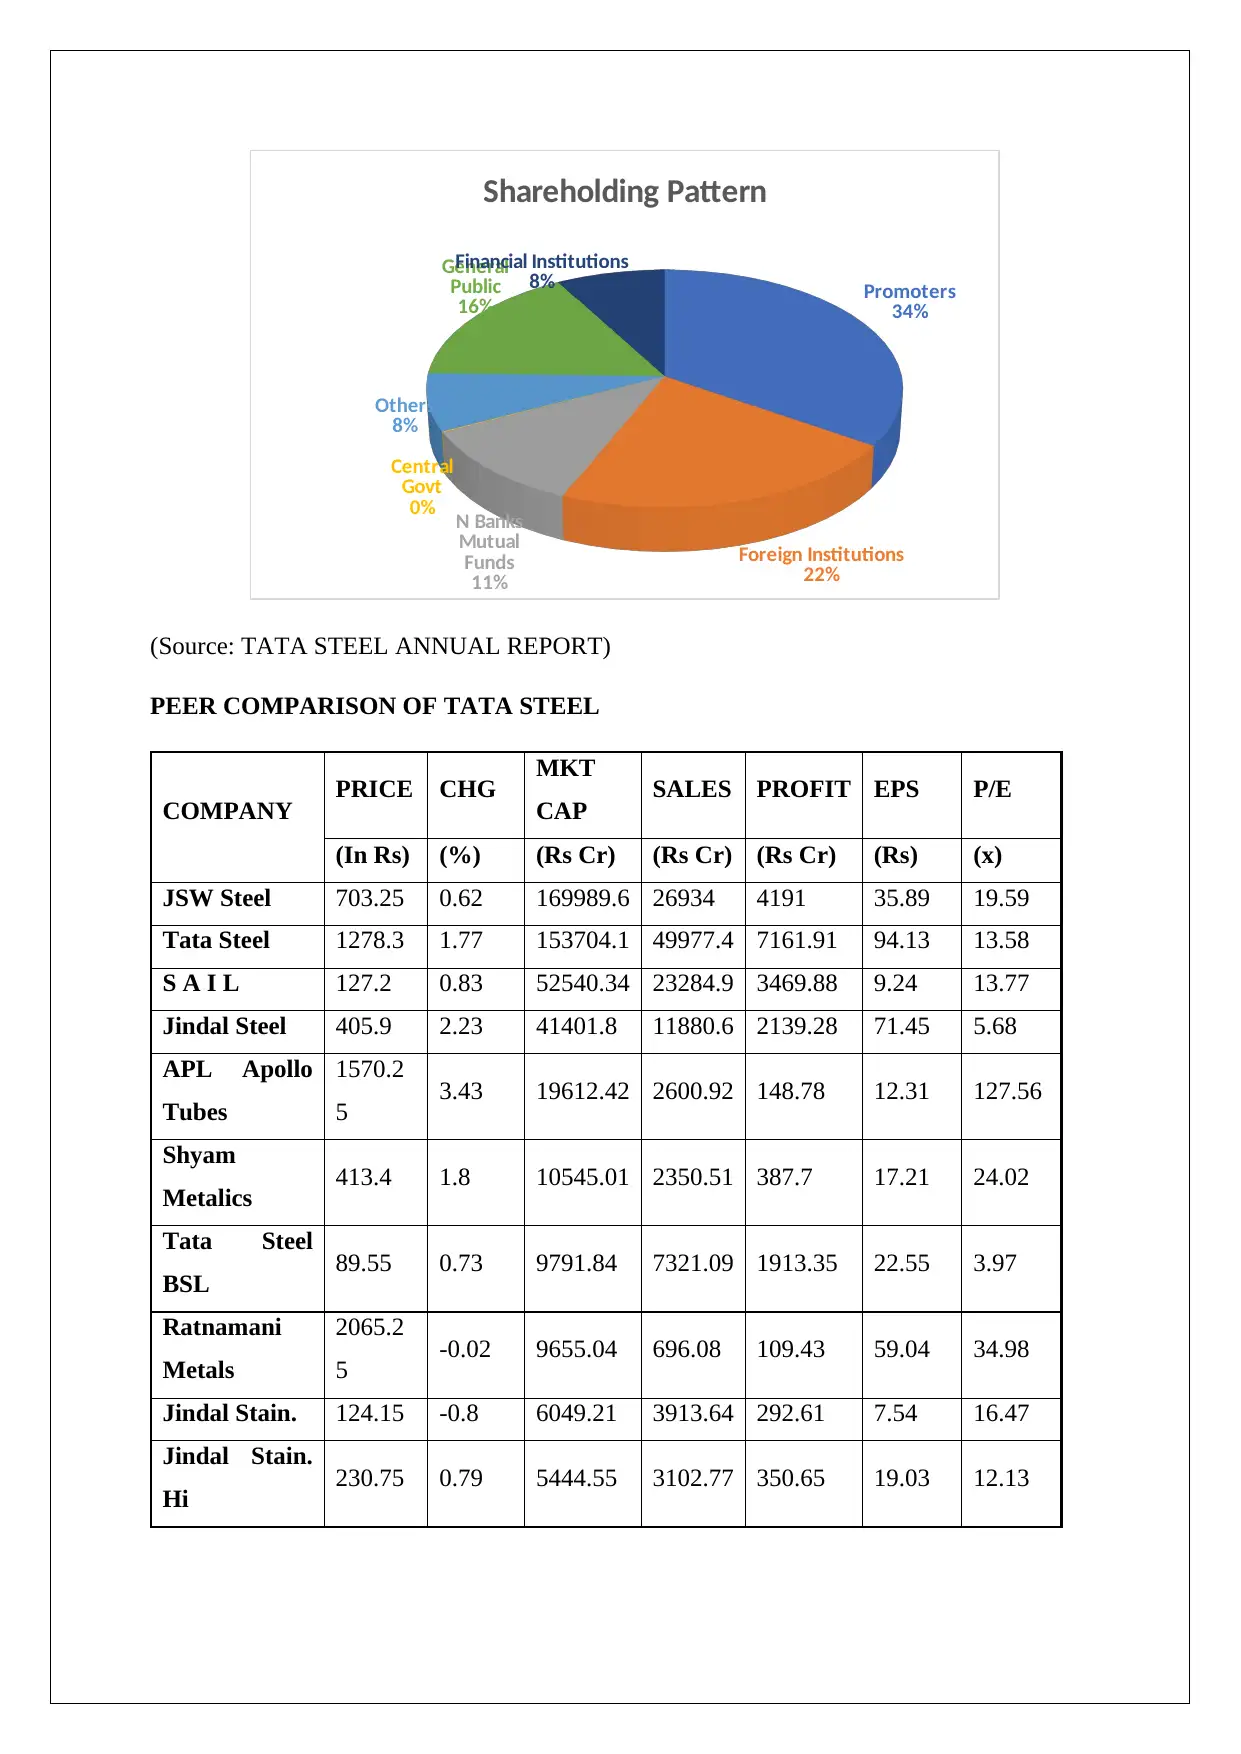
(Source: TATA STEEL ANNUAL REPORT)
PEER COMPARISON OF TATA STEEL
COMPANY PRICE CHG MKT
CAP SALES PROFIT EPS P/E
(In Rs) (%) (Rs Cr) (Rs Cr) (Rs Cr) (Rs) (x)
JSW Steel 703.25 0.62 169989.6 26934 4191 35.89 19.59
Tata Steel 1278.3 1.77 153704.1 49977.4 7161.91 94.13 13.58
S A I L 127.2 0.83 52540.34 23284.9 3469.88 9.24 13.77
Jindal Steel 405.9 2.23 41401.8 11880.6 2139.28 71.45 5.68
APL Apollo
Tubes
1570.2
5 3.43 19612.42 2600.92 148.78 12.31 127.56
Shyam
Metalics 413.4 1.8 10545.01 2350.51 387.7 17.21 24.02
Tata Steel
BSL 89.55 0.73 9791.84 7321.09 1913.35 22.55 3.97
Ratnamani
Metals
2065.2
5 -0.02 9655.04 696.08 109.43 59.04 34.98
Jindal Stain. 124.15 -0.8 6049.21 3913.64 292.61 7.54 16.47
Jindal Stain.
Hi 230.75 0.79 5444.55 3102.77 350.65 19.03 12.13
34%
Foreign Institutions
22%
N Banks
Mutual
Funds
11%
Central
Govt
0%
Others
8%
General
Public
16%
Financial Institutions
8%
Shareholding Pattern
(Source: TATA STEEL ANNUAL REPORT)
PEER COMPARISON OF TATA STEEL
COMPANY PRICE CHG MKT
CAP SALES PROFIT EPS P/E
(In Rs) (%) (Rs Cr) (Rs Cr) (Rs Cr) (Rs) (x)
JSW Steel 703.25 0.62 169989.6 26934 4191 35.89 19.59
Tata Steel 1278.3 1.77 153704.1 49977.4 7161.91 94.13 13.58
S A I L 127.2 0.83 52540.34 23284.9 3469.88 9.24 13.77
Jindal Steel 405.9 2.23 41401.8 11880.6 2139.28 71.45 5.68
APL Apollo
Tubes
1570.2
5 3.43 19612.42 2600.92 148.78 12.31 127.56
Shyam
Metalics 413.4 1.8 10545.01 2350.51 387.7 17.21 24.02
Tata Steel
BSL 89.55 0.73 9791.84 7321.09 1913.35 22.55 3.97
Ratnamani
Metals
2065.2
5 -0.02 9655.04 696.08 109.43 59.04 34.98
Jindal Stain. 124.15 -0.8 6049.21 3913.64 292.61 7.54 16.47
Jindal Stain.
Hi 230.75 0.79 5444.55 3102.77 350.65 19.03 12.13
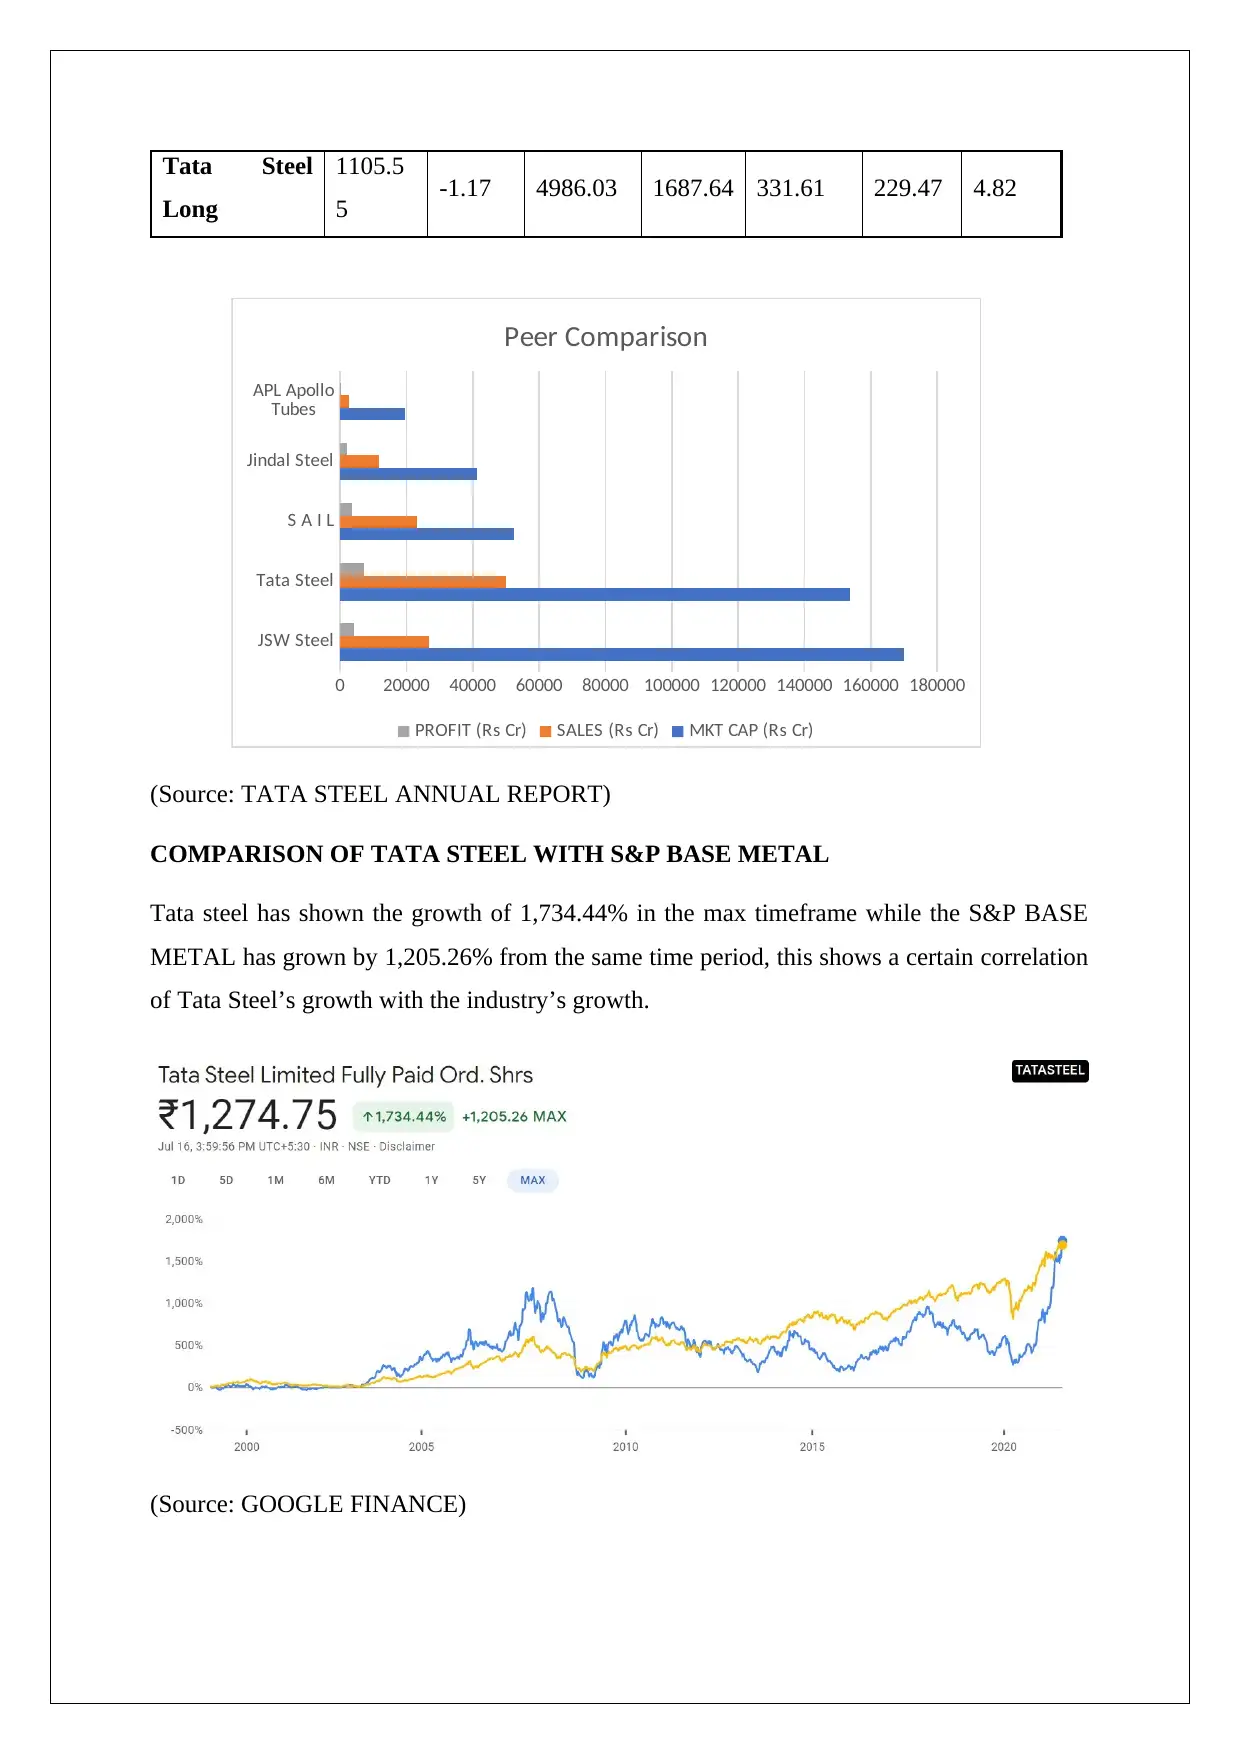
Tata Steel
Long
1105.5
5 -1.17 4986.03 1687.64 331.61 229.47 4.82
JSW Steel
Tata Steel
S A I L
Jindal Steel
APL Apollo
Tubes
0 20000 40000 60000 80000 100000 120000 140000 160000 180000
Peer Comparison
PROFIT (Rs Cr) SALES (Rs Cr) MKT CAP (Rs Cr)
(Source: TATA STEEL ANNUAL REPORT)
COMPARISON OF TATA STEEL WITH S&P BASE METAL
Tata steel has shown the growth of 1,734.44% in the max timeframe while the S&P BASE
METAL has grown by 1,205.26% from the same time period, this shows a certain correlation
of Tata Steel’s growth with the industry’s growth.
(Source: GOOGLE FINANCE)
⊘ This is a preview!⊘
Do you want full access?
Subscribe today to unlock all pages.
Trusted by 1+ million students worldwide
1 out of 28

Your All-in-One AI-Powered Toolkit for Academic Success.
+13062052269
info@desklib.com
Available 24*7 on WhatsApp / Email
![[object Object]](/_next/static/media/star-bottom.7253800d.svg)
Unlock your academic potential
Copyright © 2020–2026 A2Z Services. All Rights Reserved. Developed and managed by ZUCOL.