Corporate Financial Management: Analysis of DDR Stock Performance
VerifiedAdded on 2023/01/03
|10
|1142
|43
Report
AI Summary
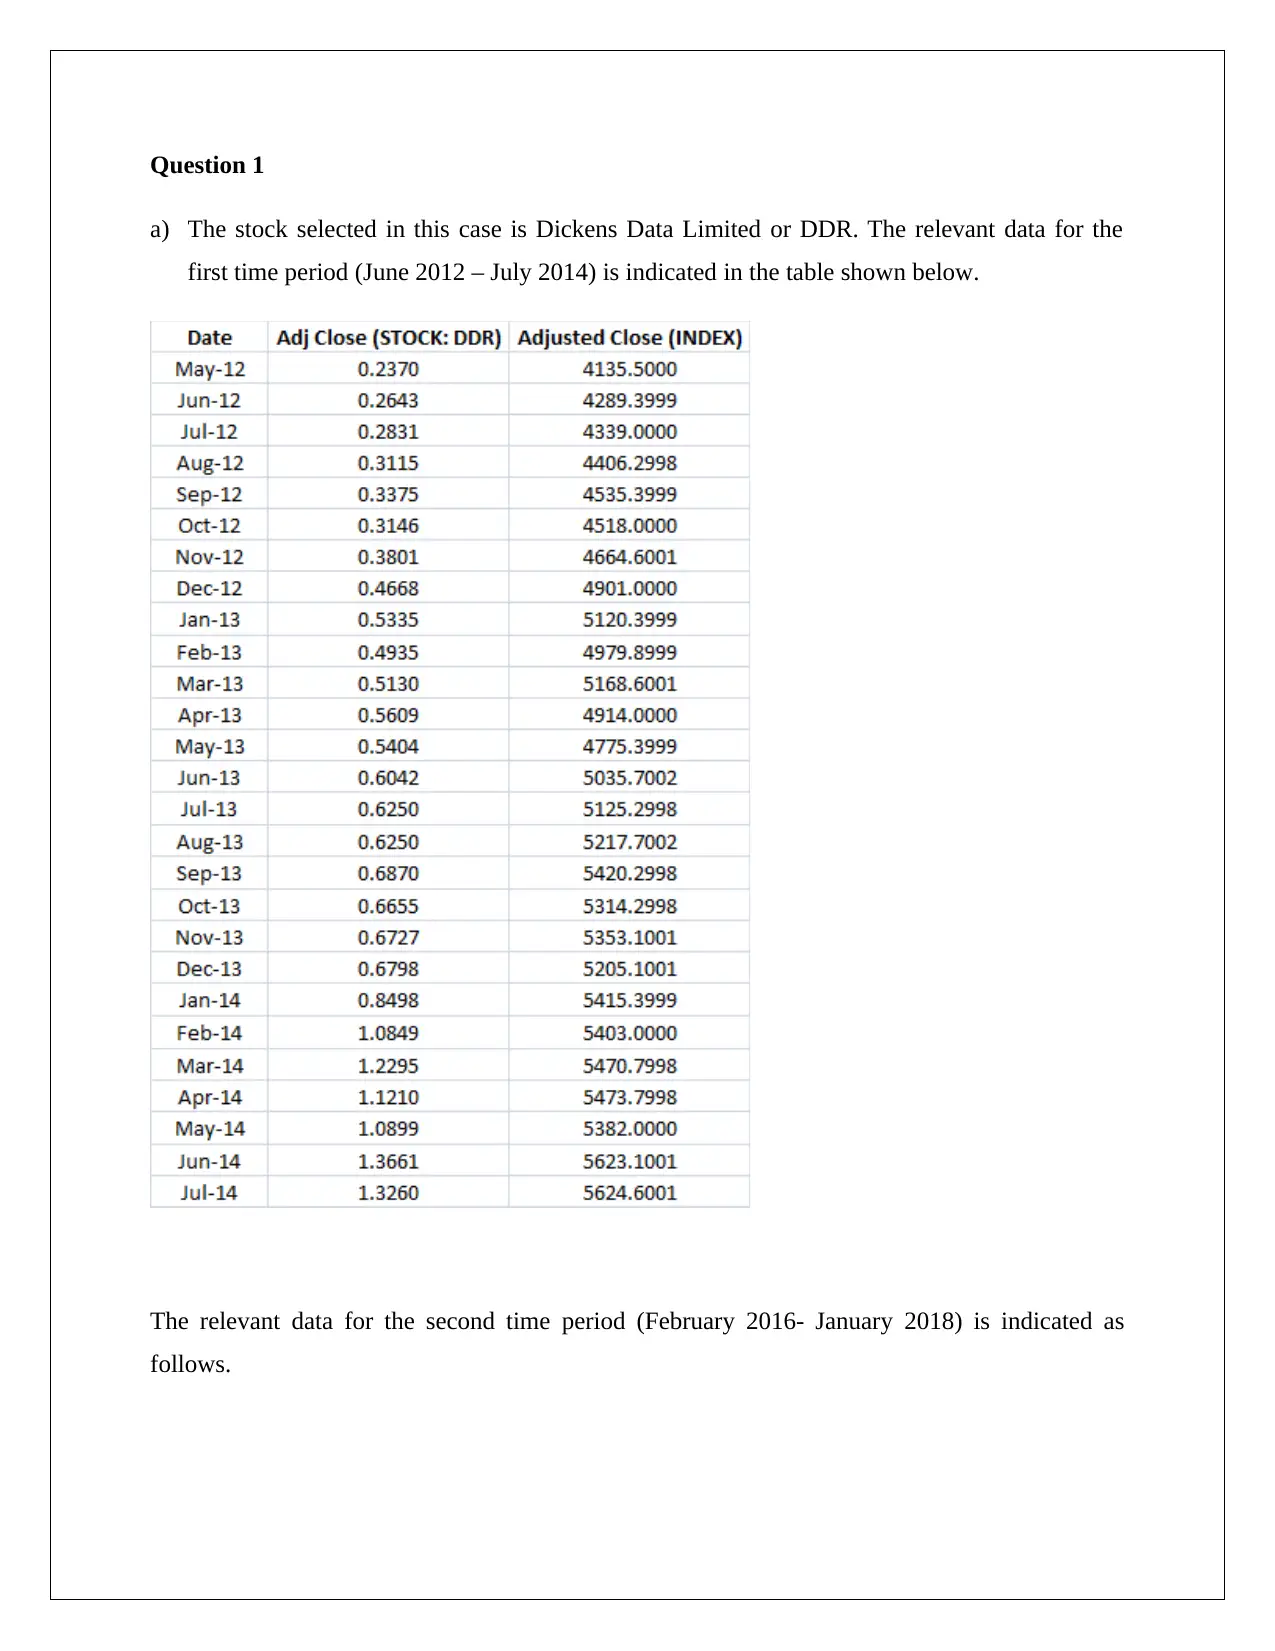
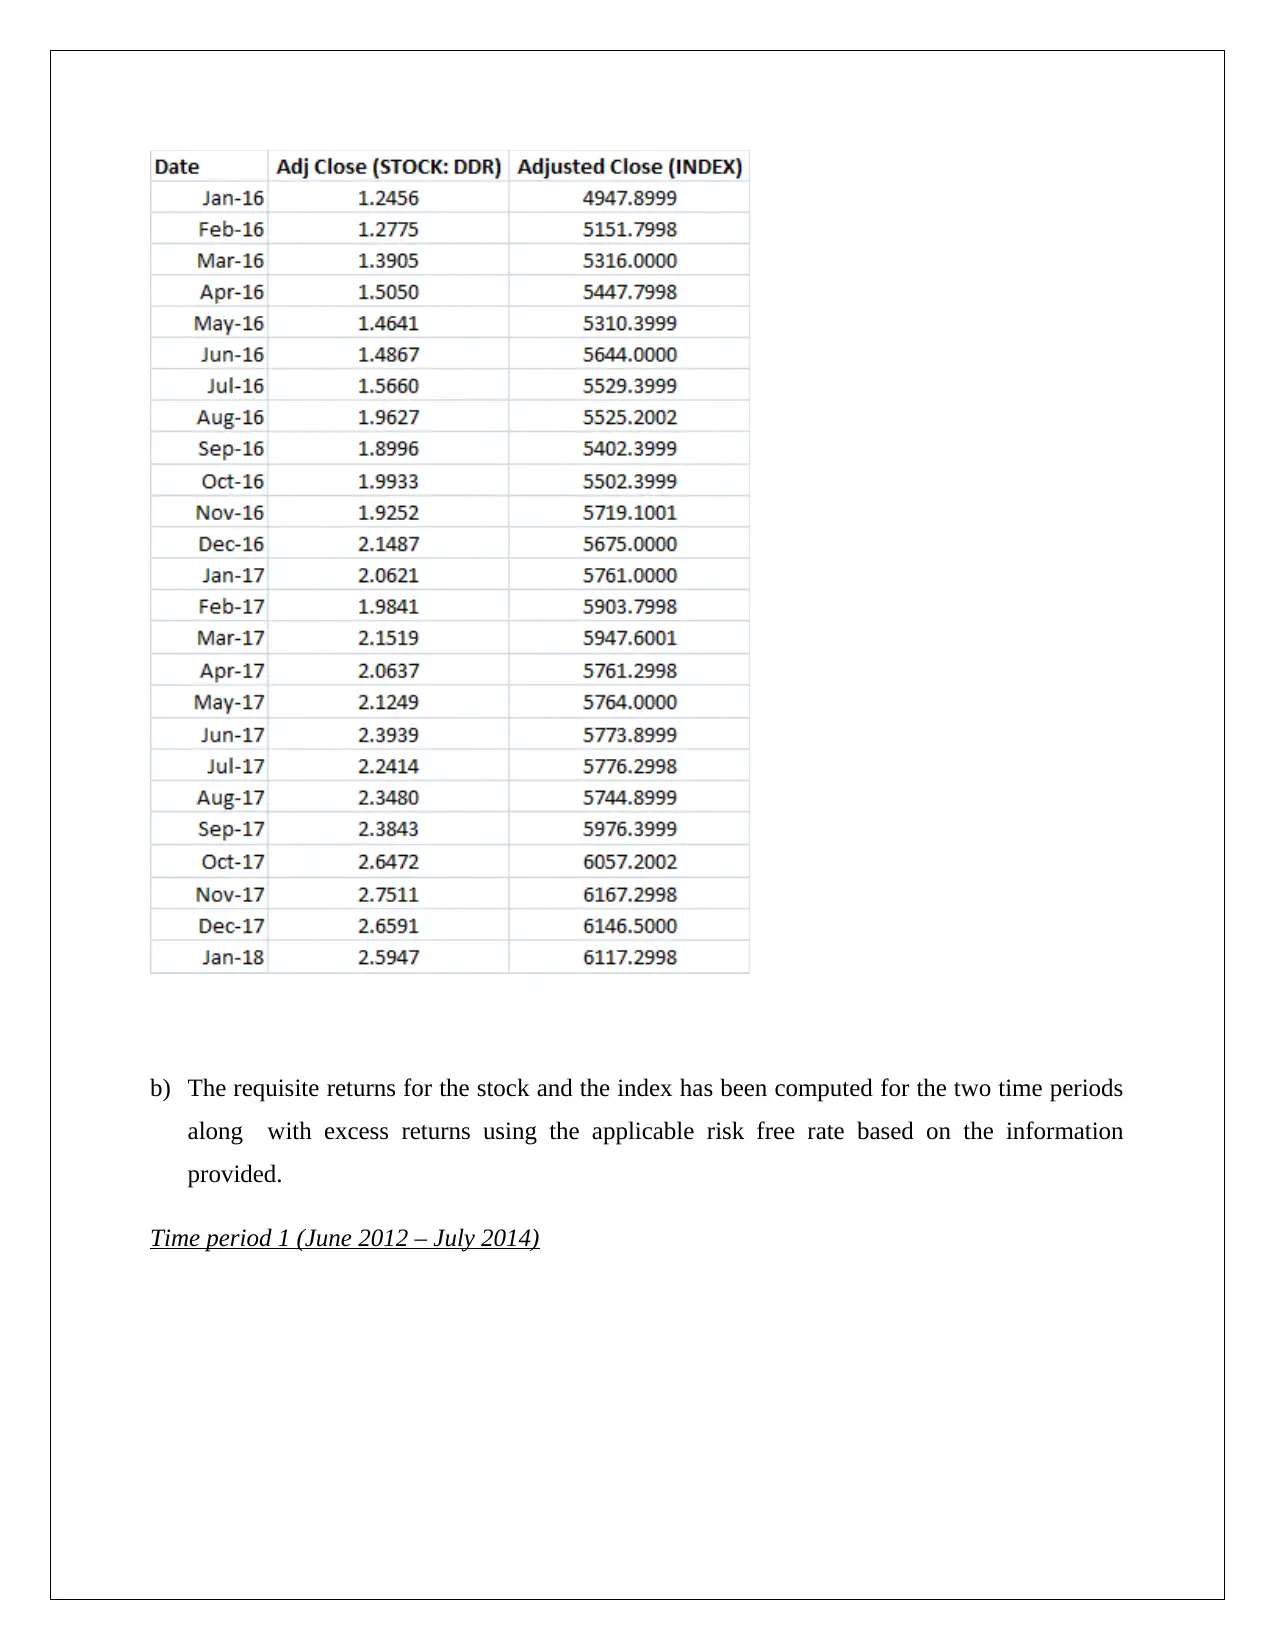
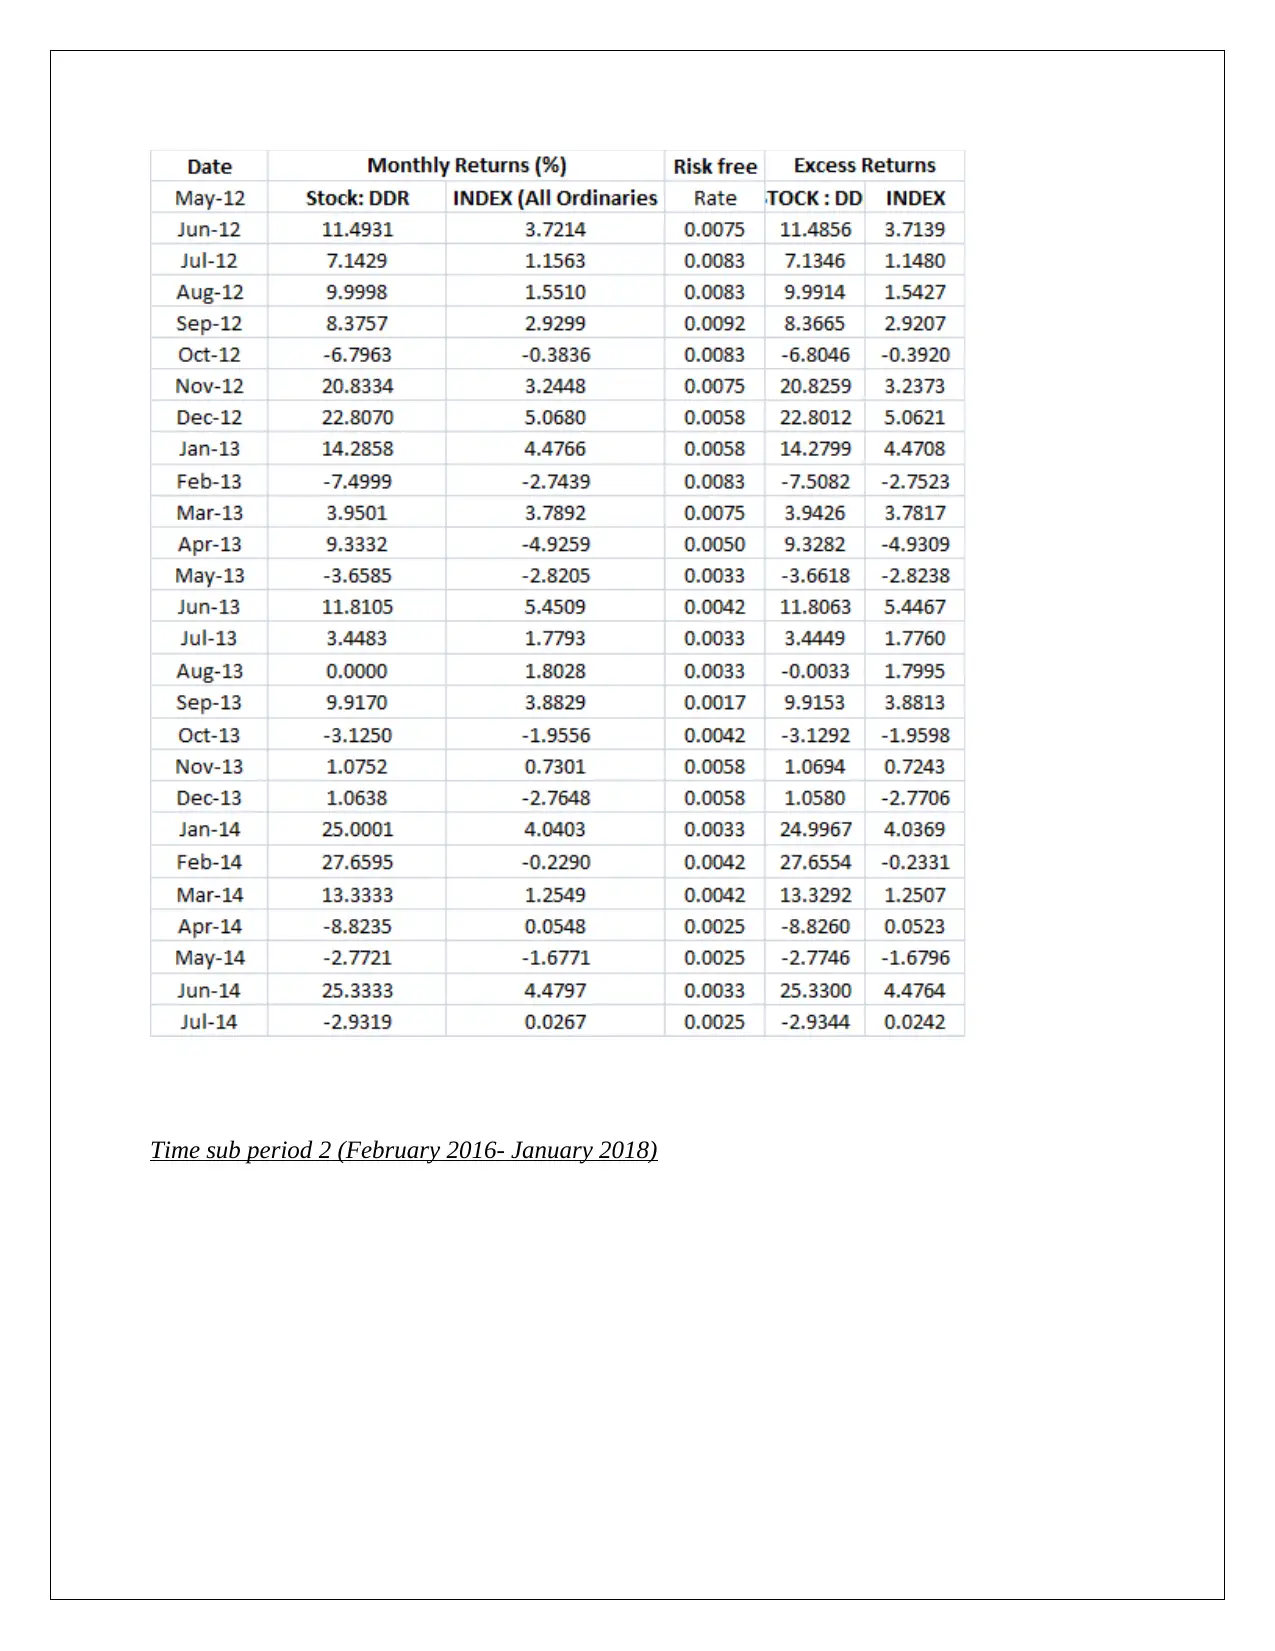
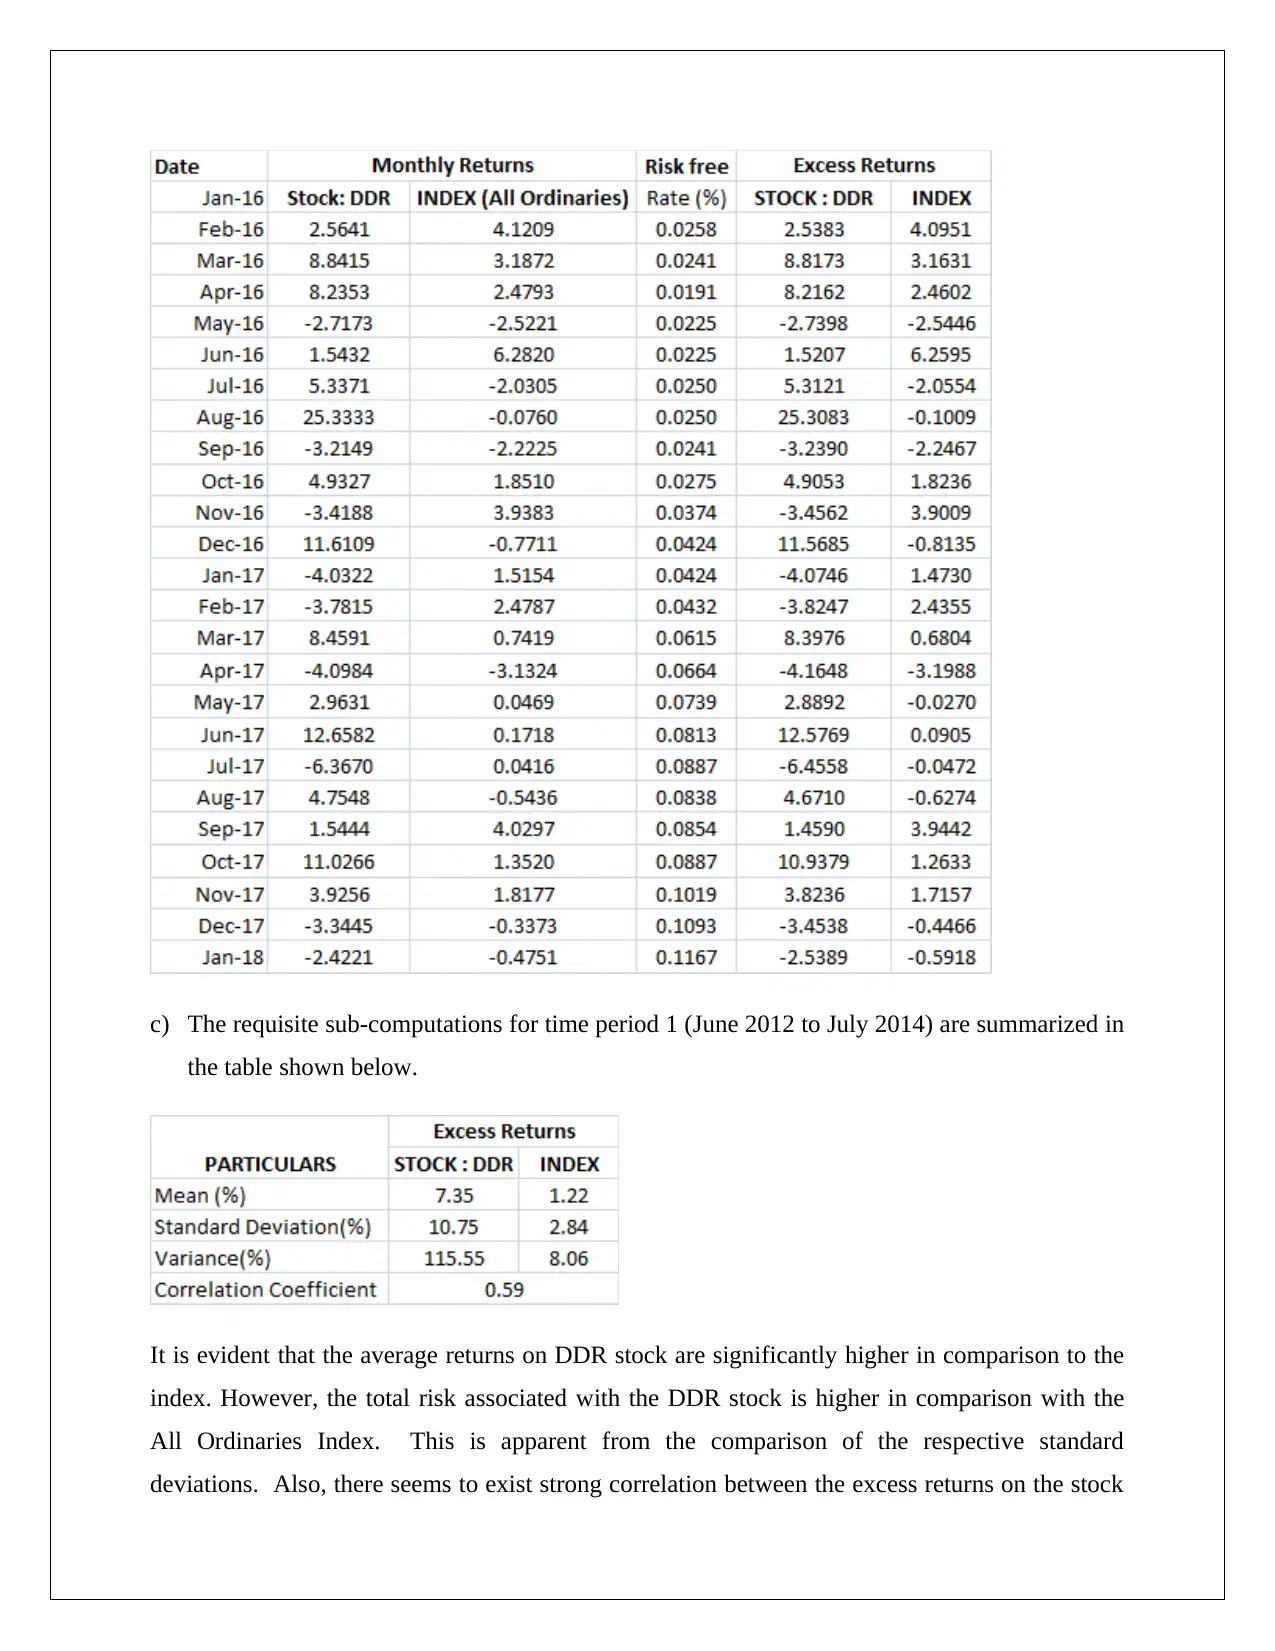
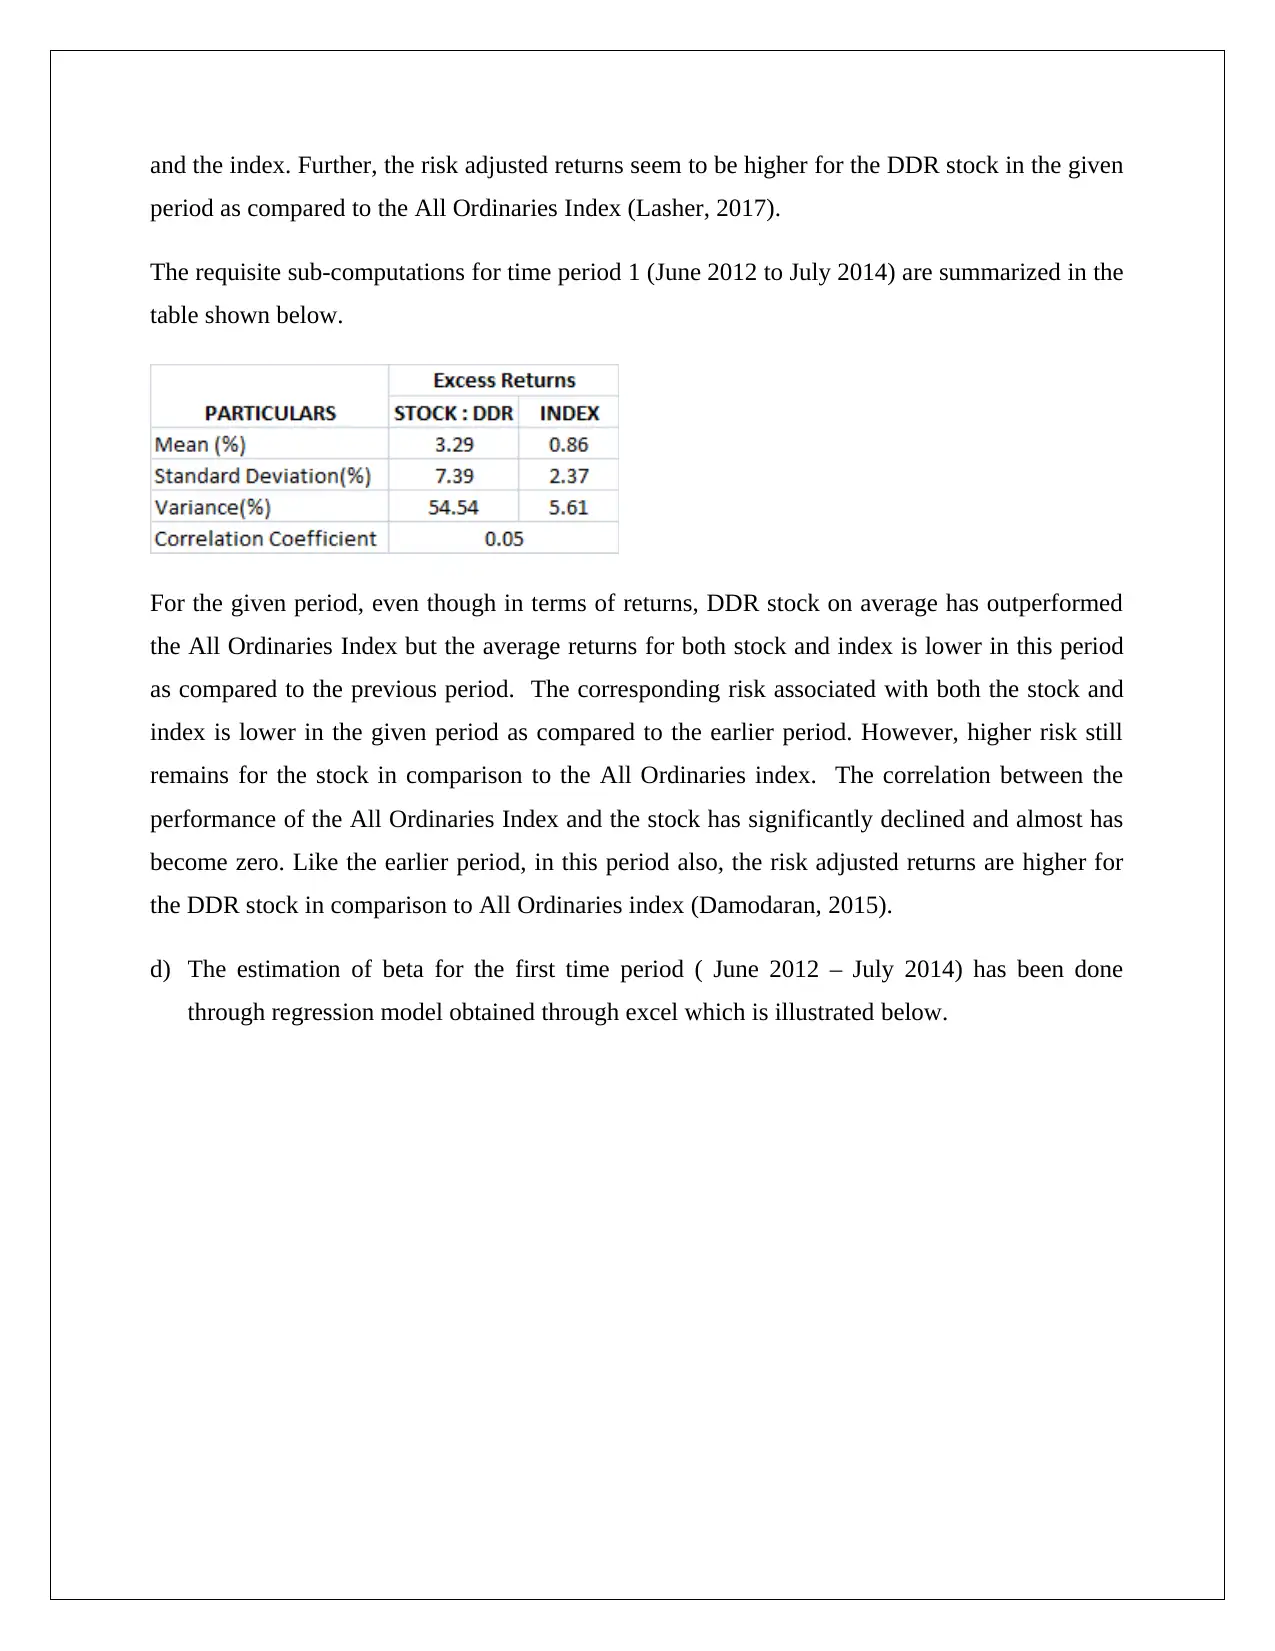
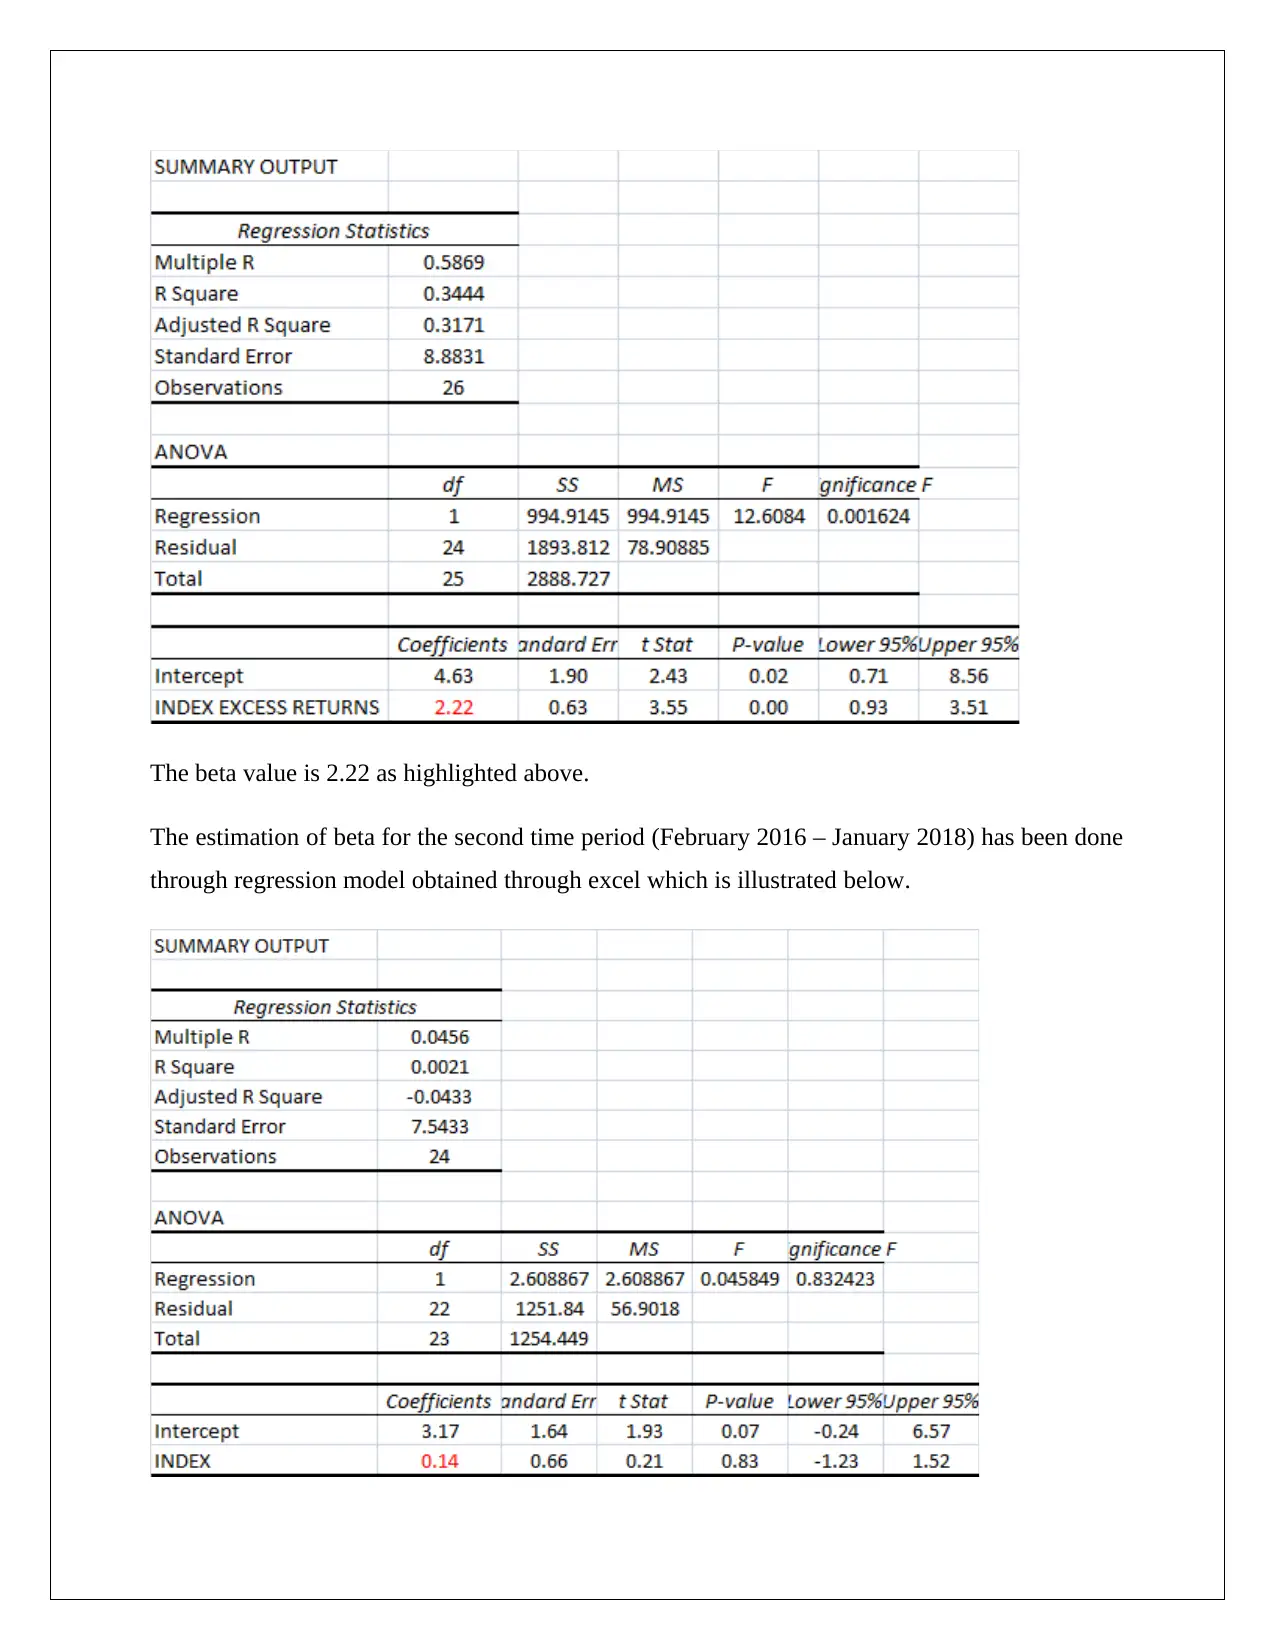
This report analyzes the performance of Dickens Data Limited (DDR) stock over two time periods: June 2012 – July 2014 and February 2016 – January 2018. The analysis includes calculating stock and market returns, excess returns, and risk-free rates. The report computes mean, standard deviation, ...
Read More
Contribute Materials
Your contribution can guide someone’s learning journey. Share your
documents today.

FINANCE
STOCK : DICKERS DATA LIMITED
STUDENT ID
[Pick the date]
STOCK : DICKERS DATA LIMITED
STUDENT ID
[Pick the date]
Secure Best Marks with AI Grader
Need help grading? Try our AI Grader for instant feedback on your assignments.

Question 1
a) The stock selected in this case is Dickens Data Limited or DDR. The relevant data for the
first time period (June 2012 – July 2014) is indicated in the table shown below.
The relevant data for the second time period (February 2016- January 2018) is indicated as
follows.
a) The stock selected in this case is Dickens Data Limited or DDR. The relevant data for the
first time period (June 2012 – July 2014) is indicated in the table shown below.
The relevant data for the second time period (February 2016- January 2018) is indicated as
follows.

b) The requisite returns for the stock and the index has been computed for the two time periods
along with excess returns using the applicable risk free rate based on the information
provided.
Time period 1 (June 2012 – July 2014)
along with excess returns using the applicable risk free rate based on the information
provided.
Time period 1 (June 2012 – July 2014)

Time sub period 2 (February 2016- January 2018)
Secure Best Marks with AI Grader
Need help grading? Try our AI Grader for instant feedback on your assignments.

c) The requisite sub-computations for time period 1 (June 2012 to July 2014) are summarized in
the table shown below.
It is evident that the average returns on DDR stock are significantly higher in comparison to the
index. However, the total risk associated with the DDR stock is higher in comparison with the
All Ordinaries Index. This is apparent from the comparison of the respective standard
deviations. Also, there seems to exist strong correlation between the excess returns on the stock

and the index. Further, the risk adjusted returns seem to be higher for the DDR stock in the given
period as compared to the All Ordinaries Index (Lasher, 2017).
The requisite sub-computations for time period 1 (June 2012 to July 2014) are summarized in the
table shown below.
For the given period, even though in terms of returns, DDR stock on average has outperformed
the All Ordinaries Index but the average returns for both stock and index is lower in this period
as compared to the previous period. The corresponding risk associated with both the stock and
index is lower in the given period as compared to the earlier period. However, higher risk still
remains for the stock in comparison to the All Ordinaries index. The correlation between the
performance of the All Ordinaries Index and the stock has significantly declined and almost has
become zero. Like the earlier period, in this period also, the risk adjusted returns are higher for
the DDR stock in comparison to All Ordinaries index (Damodaran, 2015).
d) The estimation of beta for the first time period ( June 2012 – July 2014) has been done
through regression model obtained through excel which is illustrated below.

The beta value is 2.22 as highlighted above.
The estimation of beta for the second time period (February 2016 – January 2018) has been done
through regression model obtained through excel which is illustrated below.
The estimation of beta for the second time period (February 2016 – January 2018) has been done
through regression model obtained through excel which is illustrated below.
Paraphrase This Document
Need a fresh take? Get an instant paraphrase of this document with our AI Paraphraser

The beta value is 0.14 as highlighted above.
e) Beta for the first time period (June 2012 – July 2014) is 2.22 which implies that the DDR
stock would be termed as a aggressive stock. This is because the systematic risk associated
with the stock would be more than twice that of the All Ordinaries Index which has a beta of
1. The beta value would also imply that a unit change in the index value would bring about
change of 2.22 units in the DDR stock price (Brealey, Myers and Allen, 2014).
Beta for the second time period (February 2016 – January 2018) is 0.14 which implies that DDR
stock would be termed as a defensive stock. This is because the systematic risk associated with
the stock is considerably lesser than the All Ordinaries Index which has a beta of 1. The beta
value would also imply that a unit change in the index value would bring about change of 0.14
units in the DDR stock price (Berk et. al., 2016).
f) The company selected i.e. Dickers Data Limited has been in the business of distribution of
hardware products to various resellers and clients for voer four decades. Even though the
main focus of the company is branded hardware products but in the recent times it also offers
software products. It is the leading vendor of various branded products from Asus, Lenovo,
Cisco, Toshiba in Australia. The company over the years has forged a strong relationship
with various branded players whose products the company markets. The current market
capitalization of the company is in excess of AUD 650 million (DickersData, nd).
g) It is apparent from the comparison of beta in the two sub-periods that the values are starkly
different. This may be attributed to the underlying assumption that CAPM model makes with
regards to the investor investing in a well diversified portfolio. As a result, CAPM approach
assumes that all the unsystematic risk associated with a stock would have been eliminated
and all risk is captured by the systematic risk. This is often not true since there is sizable
unsystematic risk that the investor is exposed to (Damodaran, 2015).
In the given case also, during the second period, it is apparent that the correlation between
the market returns and the stock returns are close to zero. Owing to this, the beta is not a apt
measure to capture the risk of the DDR stock. Since beta has failed to capture the risk
associated with DDR stock, hence the beta value in second case is not correct. It is unlikely

that the total risk associated with the stock would be significantly higher for a stock over a
period when systematic risk associated with the stock returns is significantly lower in
comparison to the index (Lasher,2017).
period when systematic risk associated with the stock returns is significantly lower in
comparison to the index (Lasher,2017).

References
Berk, J., DeMarzo, P., Harford, J., Ford, G., Mollica, V. and Finch, N. (2013) Fundamentals of
corporate finance. London: Pearson Higher Education AU.
Brealey, R.A., Myers, S.C. and Allen, F. (2014) Principles of corporate finance. 2nd ed. New
York: McGraw-Hill Inc
Damodaran, A. (2015) Applied corporate finance: A user’s manual. 3rd ed. New York: Wiley,
John & Sons.
DickerData (n.d.) Who We ARE, [Online] Available at
https://www.dickerdata.com.au/Home/Index# [Assessed at May 4, 2019]
Lasher, W. R., (2017) Practical Financial Management. 5th ed. London: South- Western
College Publisher.
1 out of 10
Related Documents

Your All-in-One AI-Powered Toolkit for Academic Success.
+13062052269
info@desklib.com
Available 24*7 on WhatsApp / Email
Unlock your academic potential
© 2024 | Zucol Services PVT LTD | All rights reserved.