Business Finance: Risk, Return, and Capital Budgeting
VerifiedAdded on 2023/02/01
|18
|4928
|100
Report
AI Summary
This assignment analyzes the financial aspects of JB Hi-Fi Limited, covering business description, risk and return, and capital budgeting. Part I provides an overview of the company, including its market capitalization, product offerings, and operational history. Part II delves into risk and return calculations, including continuously compounded return, expected return, standard deviation, and correlation coefficient. The analysis uses the CAPM model to determine the cost of equity and evaluates portfolio risk and return. Part III examines capital budgeting, comparing the attractiveness of different projects based on gross cash flows. The report includes formulas, calculations, and interpretations of financial metrics, providing insights into JB Hi-Fi's financial performance and investment strategies. The assignment demonstrates an understanding of financial concepts and their application in a real-world business context.

Running Head: Business Finance
Business Finance
[Pick the date]
Business Finance
[Pick the date]
Paraphrase This Document
Need a fresh take? Get an instant paraphrase of this document with our AI Paraphraser
Business Finance
Part I (Business Description)
1. Company Name- JB Hi-Fi Limited
GICS SECTOR- Consumer Discretionary
GICS Industry Group- Retailing
GICS Industry- Specialty Retail (Morningstar, 2019)
2. Total Market Capitalization of JB Hi-Fi Limited- $2,901.95m (Morningstar, 2019)
3. JB Hi-Fi Limited (JBH) deals in consumer electronics, whitegoods and softwares like
music, games as well as movies. The group is a speciality discount retailer of highly
branded home entertainment related products. It conducts its business from standalone
destination sites, shopping centres and the online stores operating in Australia and
New Zealand.
The JB HI-FI Limited deals in the following products and services:
i. Televisions
ii. Audio equipment
iii. Computers
iv. Cameras
v. Telecommunications products and services
vi. Software
vii. Musical instruments
viii. Whitegoods
ix. Cooking products
x. Small appliances
xi. Digital content
xii. Information technology and consulting services
The company is working under the stewardship of Mr Gregory (Greg) Richards, the
Chairman and Mr Richard Murray, the Managing Director (MD) and Chief Executive Officer
(CEO) of JB HI-FI Limited.
4. The market risk (beta) of JB HI-FI Limited stands at 0.95 (Morningstar, 2019).
1
Business Finance
5. The market risk (beta) of Industry stands at 0.96 (Morningstar, 2019).
6. The market risk of JB HI-FI Limited is 0.95 and the company operates its business in
retailing industry whose beta or market risk is 0.96. The difference between the beta
figures of market and company are differing by 0.01 which cannot be considered a big
gap. However, if we compare both these figures, then JB HI-FI Limited is little less
risky than its industry counterpart. From here, we can interpret that both industry and
JB HI-FI Limited are less volatile/unstable than the market because their beta fall in
the range of 0-1. If we look from an investor’s point of view, then the ones who are
more risk averse may opt for making investment in the companies operating in
retailing industry and one of those companies could be JB HI-FI Limited whose
market risk is less than the industry too.
7. 5 year holding period return for JB HI-FI Limited stands at 12.46% (Morningstar,
2019).
8. JB HI-FI Limited started its journey from one single store situated at East Keilor,
Victoria. It was established in the year 1974 by the owner whose name was Mr John
Barbuto (JB) and his major intention was to provide the best range of Hi-Fi along
with the recorded music at a price which stands the lowest in whole Australia. In the
year 1983, Mr John Barbuto sold his business and more nine stores came into
existence by the year 1999. When the business became successful then in order to
take the efficacious business model nationally it was acquired by the private equity
bankers as well as the senior management in July, 2000. Later, the business got itself
listed on the Australian Stock Exchange (ASX) in the month of October, 2003.
Presently, the company has become the largest retailer, dealing in home entertainment
products which is growing on a very fast pace. In the year 2004, JB HI-FI Limited
acquired the Queensland Clive Anthony chain of stores and these stores deals in the
products like white goods, air-conditioning, consumer electronics and cooking
appliances. At present, in all these stores a consumer can find all the products of JB
plus more and now it is JB Hi-Fi HOME stores. The renowned brands of computers,
Televisions, Hi-Fi, Car sound, Tablets, Portable Audio etc. are provided by the JB
stores. In all these stores, the consumers can find a vast range of recorded music,
DVD movies, games, Television shows etc. and all at a very low price. The company
is also known for its high quality personal service from their experts (JB HI-FI, N.D.).
If we talk about its operational history, then in the year 2018 it reported a rise of
12.3% in Net Profit after Tax (NPAT) and as per 2019 results the NPAT had again
2
⊘ This is a preview!⊘
Do you want full access?
Subscribe today to unlock all pages.
Trusted by 1+ million students worldwide

Business Finance
experienced a rise of 5.5% (Morningstar, 2019). So the company is operating from
1974- present that is JB Hi-Fi is approximately forty-five years old company.
3
experienced a rise of 5.5% (Morningstar, 2019). So the company is operating from
1974- present that is JB Hi-Fi is approximately forty-five years old company.
3
Paraphrase This Document
Need a fresh take? Get an instant paraphrase of this document with our AI Paraphraser
Business Finance
Part II Risk and Return
1.
2.
3.
4.
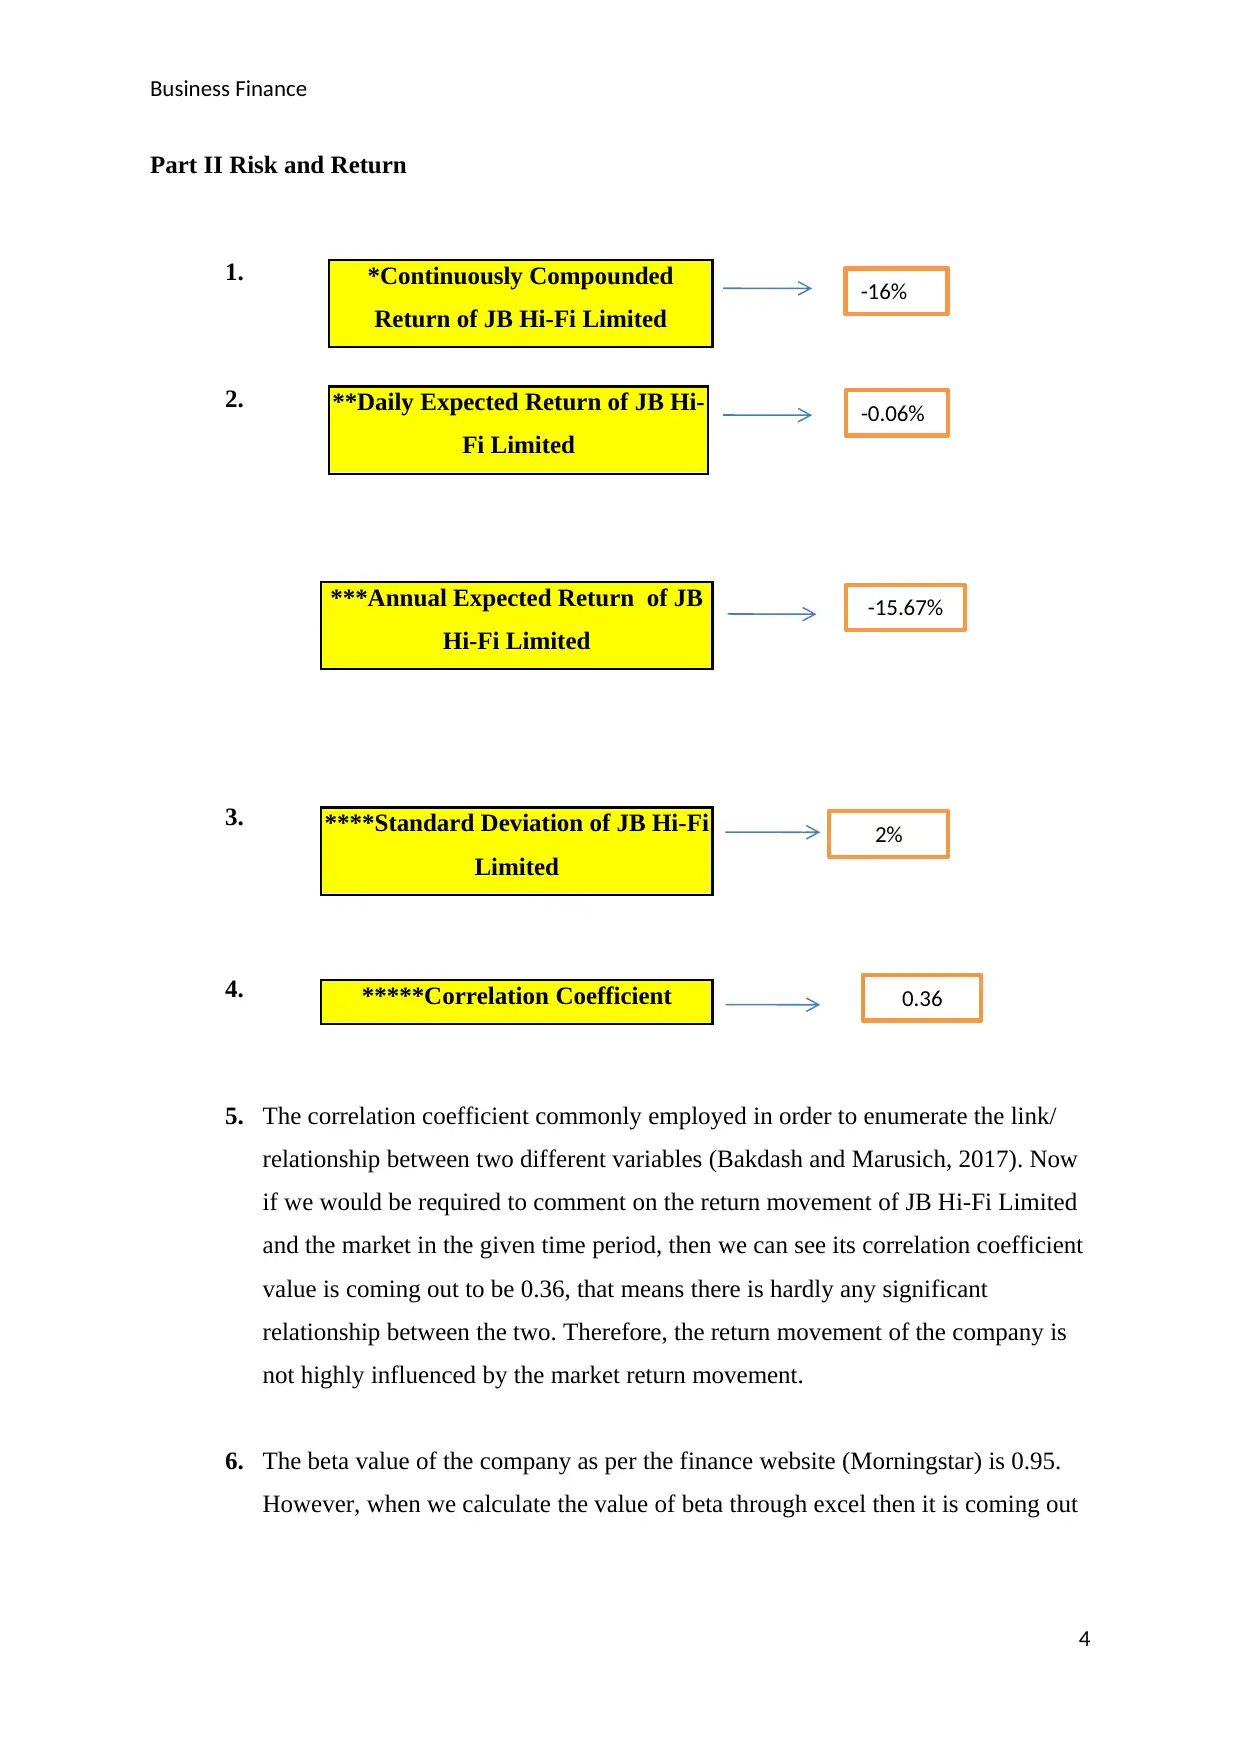
5. The correlation coefficient commonly employed in order to enumerate the link/
relationship between two different variables (Bakdash and Marusich, 2017). Now
if we would be required to comment on the return movement of JB Hi-Fi Limited
and the market in the given time period, then we can see its correlation coefficient
value is coming out to be 0.36, that means there is hardly any significant
relationship between the two. Therefore, the return movement of the company is
not highly influenced by the market return movement.
6. The beta value of the company as per the finance website (Morningstar) is 0.95.
However, when we calculate the value of beta through excel then it is coming out
4
-0.06%
2%
0.36
-15.67%
-16%
*Continuously Compounded
Return of JB Hi-Fi Limited
**Daily Expected Return of JB Hi-
Fi Limited
***Annual Expected Return of JB
Hi-Fi Limited
****Standard Deviation of JB Hi-Fi
Limited
*****Correlation Coefficient
Part II Risk and Return
1.
2.
3.
4.
5. The correlation coefficient commonly employed in order to enumerate the link/
relationship between two different variables (Bakdash and Marusich, 2017). Now
if we would be required to comment on the return movement of JB Hi-Fi Limited
and the market in the given time period, then we can see its correlation coefficient
value is coming out to be 0.36, that means there is hardly any significant
relationship between the two. Therefore, the return movement of the company is
not highly influenced by the market return movement.
6. The beta value of the company as per the finance website (Morningstar) is 0.95.
However, when we calculate the value of beta through excel then it is coming out
4
-0.06%
2%
0.36
-15.67%
-16%
*Continuously Compounded
Return of JB Hi-Fi Limited
**Daily Expected Return of JB Hi-
Fi Limited
***Annual Expected Return of JB
Hi-Fi Limited
****Standard Deviation of JB Hi-Fi
Limited
*****Correlation Coefficient
Business Finance
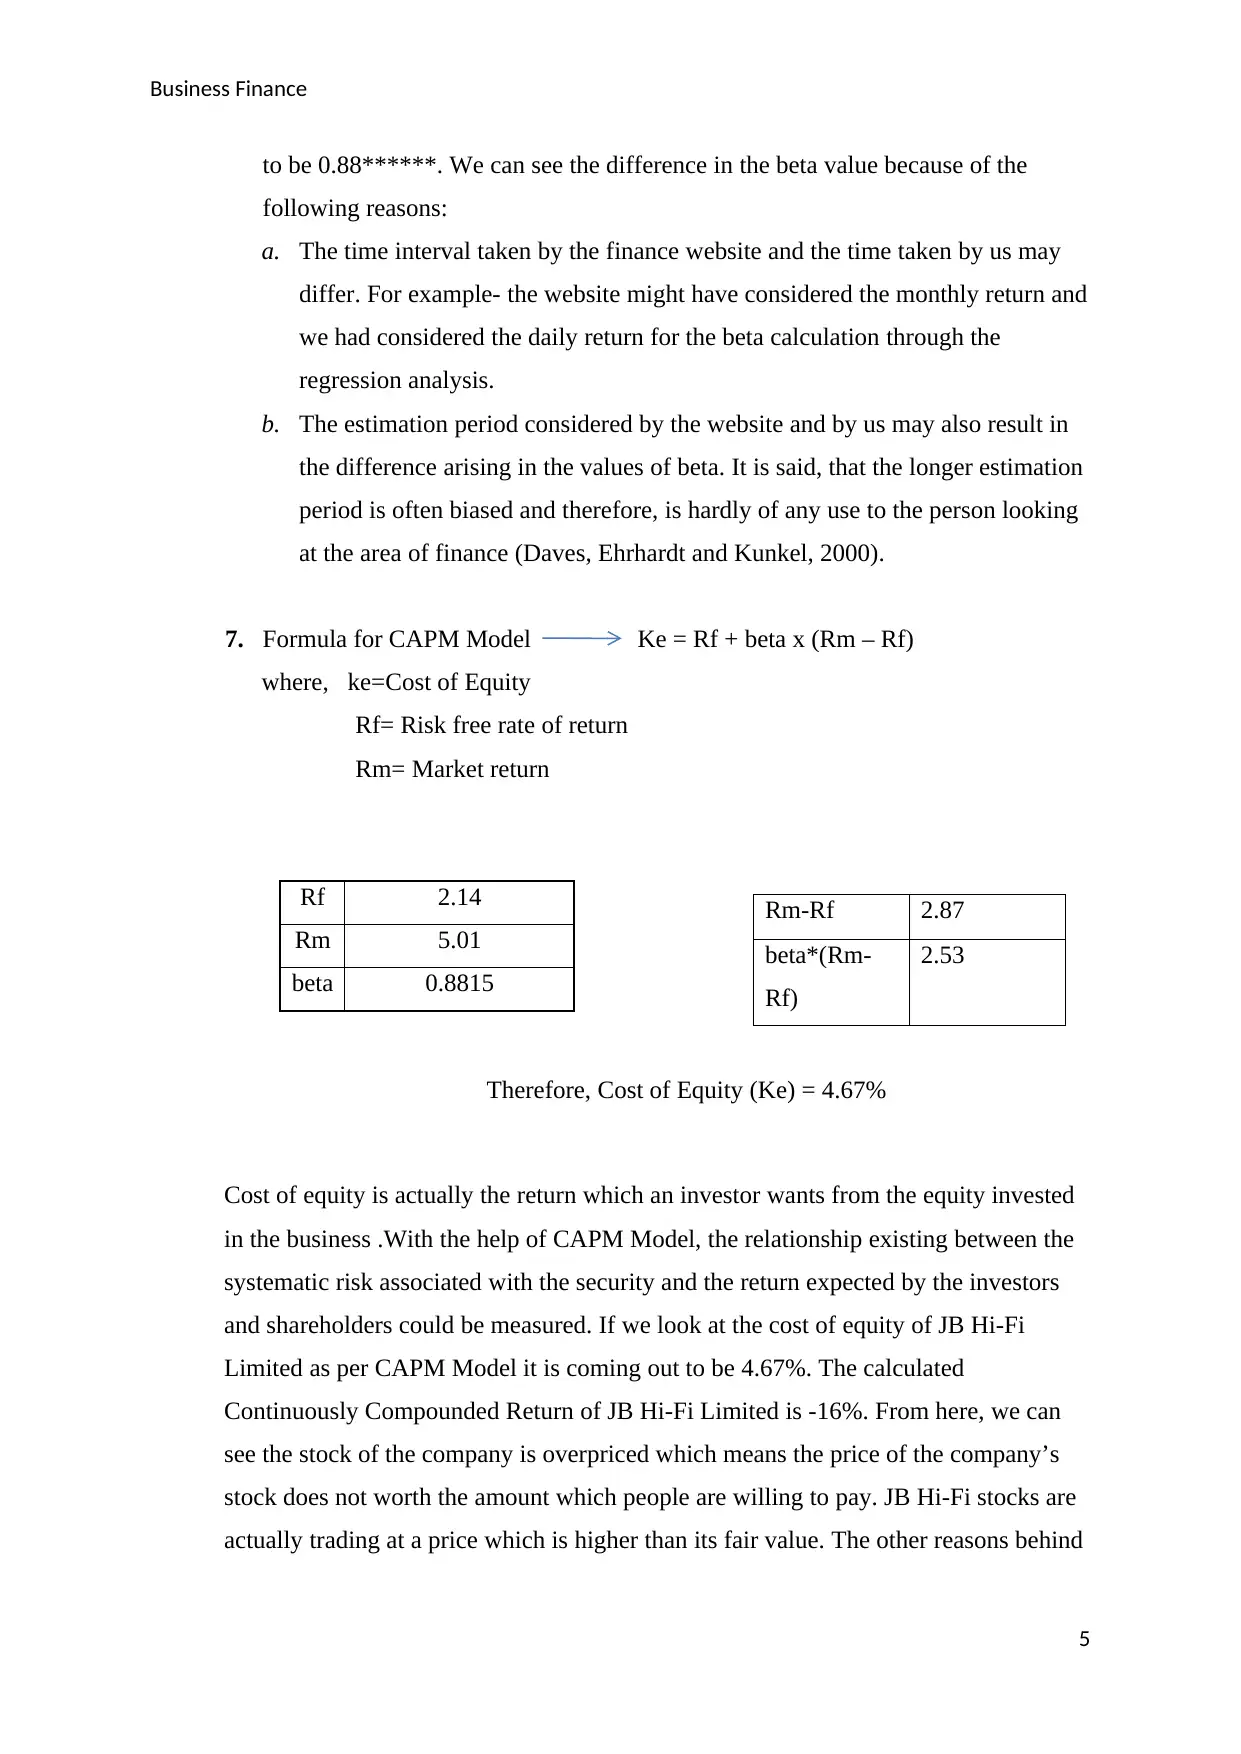
to be 0.88******. We can see the difference in the beta value because of the
following reasons:
a. The time interval taken by the finance website and the time taken by us may
differ. For example- the website might have considered the monthly return and
we had considered the daily return for the beta calculation through the
regression analysis.
b. The estimation period considered by the website and by us may also result in
the difference arising in the values of beta. It is said, that the longer estimation
period is often biased and therefore, is hardly of any use to the person looking
at the area of finance (Daves, Ehrhardt and Kunkel, 2000).
7. Formula for CAPM Model Ke = Rf + beta x (Rm – Rf)
where, ke=Cost of Equity
Rf= Risk free rate of return
Rm= Market return
Therefore, Cost of Equity (Ke) = 4.67%
Cost of equity is actually the return which an investor wants from the equity invested
in the business .With the help of CAPM Model, the relationship existing between the
systematic risk associated with the security and the return expected by the investors
and shareholders could be measured. If we look at the cost of equity of JB Hi-Fi
Limited as per CAPM Model it is coming out to be 4.67%. The calculated
Continuously Compounded Return of JB Hi-Fi Limited is -16%. From here, we can
see the stock of the company is overpriced which means the price of the company’s
stock does not worth the amount which people are willing to pay. JB Hi-Fi stocks are
actually trading at a price which is higher than its fair value. The other reasons behind
5
Rf 2.14
Rm 5.01
beta 0.8815
Rm-Rf 2.87
beta*(Rm-
Rf)
2.53
⊘ This is a preview!⊘
Do you want full access?
Subscribe today to unlock all pages.
Trusted by 1+ million students worldwide
Business Finance
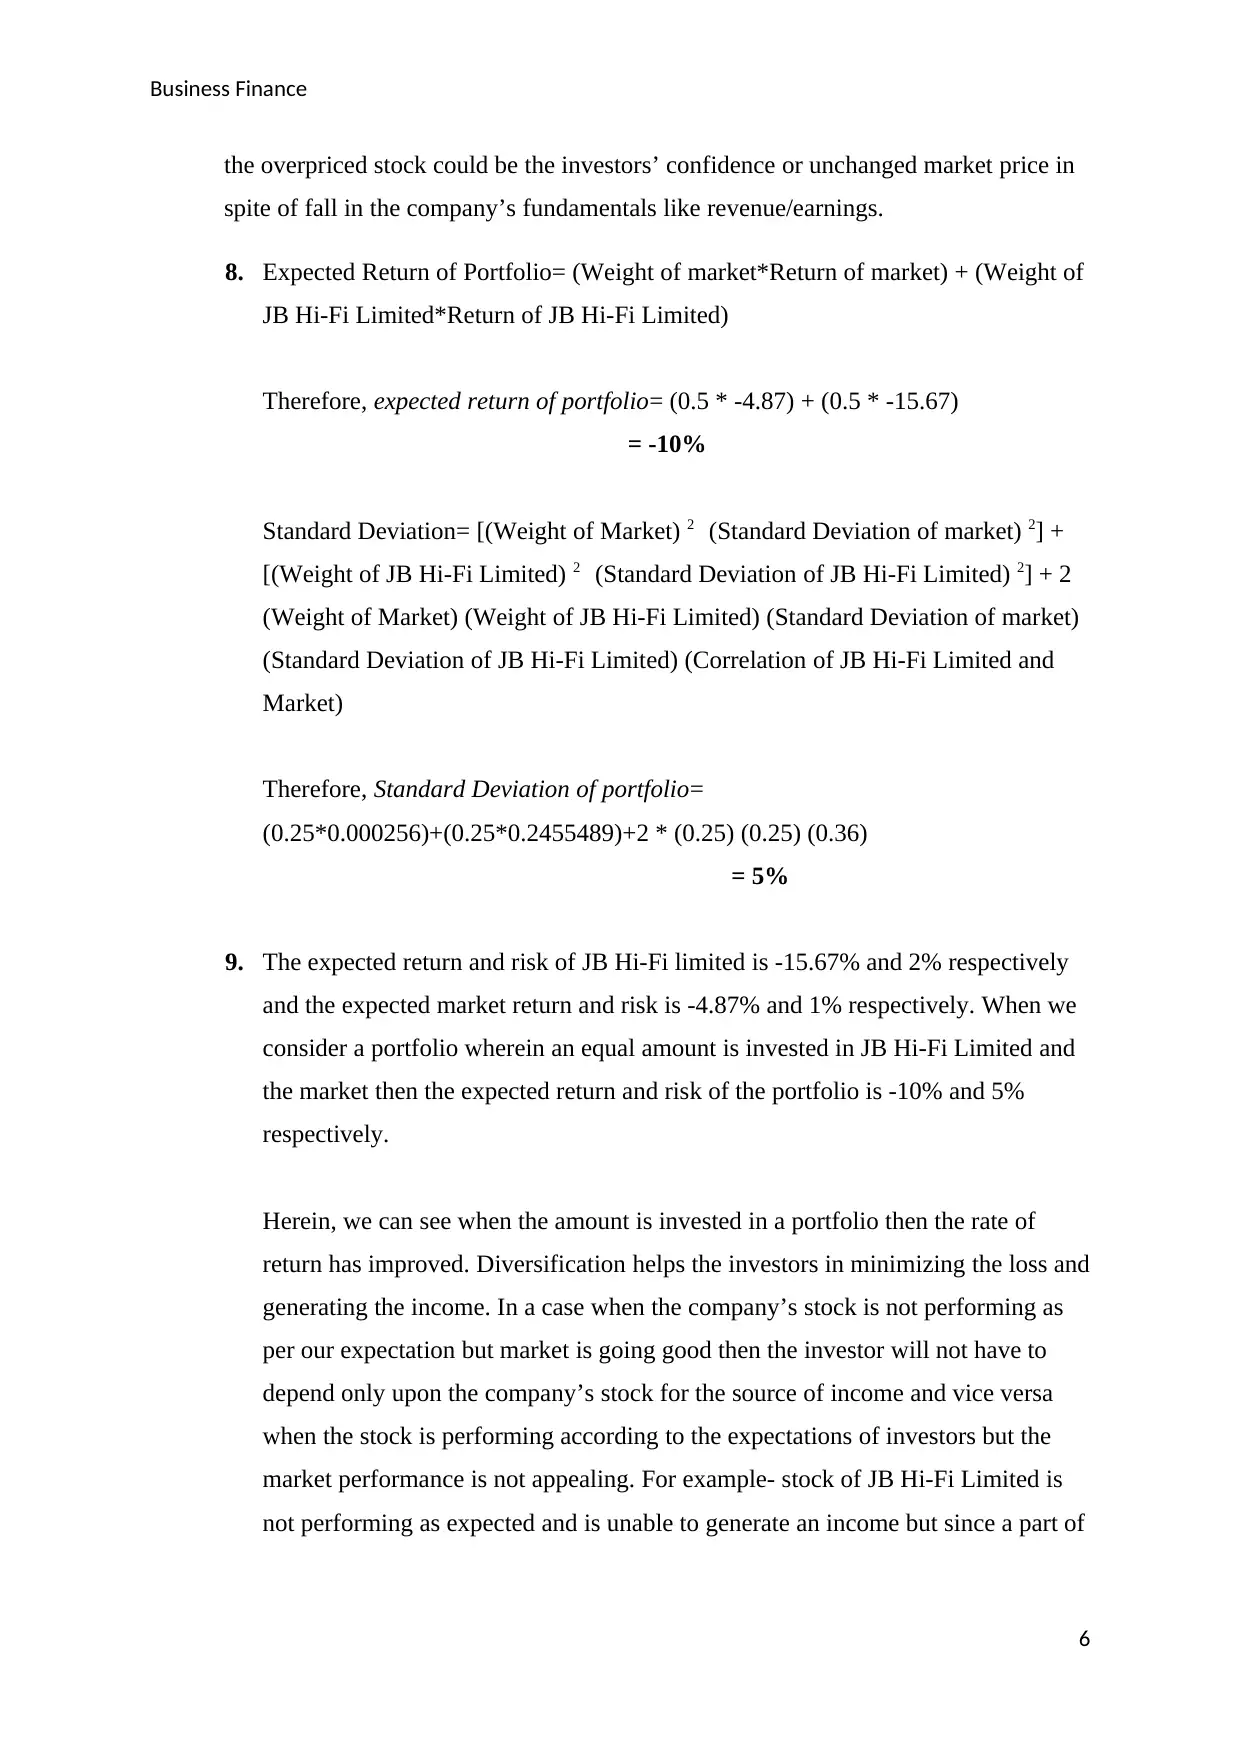
the overpriced stock could be the investors’ confidence or unchanged market price in
spite of fall in the company’s fundamentals like revenue/earnings.
8. Expected Return of Portfolio= (Weight of market*Return of market) + (Weight of
JB Hi-Fi Limited*Return of JB Hi-Fi Limited)
Therefore, expected return of portfolio= (0.5 * -4.87) + (0.5 * -15.67)
= -10%
Standard Deviation= [(Weight of Market) 2 (Standard Deviation of market) 2] +
[(Weight of JB Hi-Fi Limited) 2 (Standard Deviation of JB Hi-Fi Limited) 2] + 2
(Weight of Market) (Weight of JB Hi-Fi Limited) (Standard Deviation of market)
(Standard Deviation of JB Hi-Fi Limited) (Correlation of JB Hi-Fi Limited and
Market)
Therefore, Standard Deviation of portfolio=
(0.25*0.000256)+(0.25*0.2455489)+2 * (0.25) (0.25) (0.36)
= 5%
9. The expected return and risk of JB Hi-Fi limited is -15.67% and 2% respectively
and the expected market return and risk is -4.87% and 1% respectively. When we
consider a portfolio wherein an equal amount is invested in JB Hi-Fi Limited and
the market then the expected return and risk of the portfolio is -10% and 5%
respectively.
Herein, we can see when the amount is invested in a portfolio then the rate of
return has improved. Diversification helps the investors in minimizing the loss and
generating the income. In a case when the company’s stock is not performing as
per our expectation but market is going good then the investor will not have to
depend only upon the company’s stock for the source of income and vice versa
when the stock is performing according to the expectations of investors but the
market performance is not appealing. For example- stock of JB Hi-Fi Limited is
not performing as expected and is unable to generate an income but since a part of
6
Paraphrase This Document
Need a fresh take? Get an instant paraphrase of this document with our AI Paraphraser
Business Finance
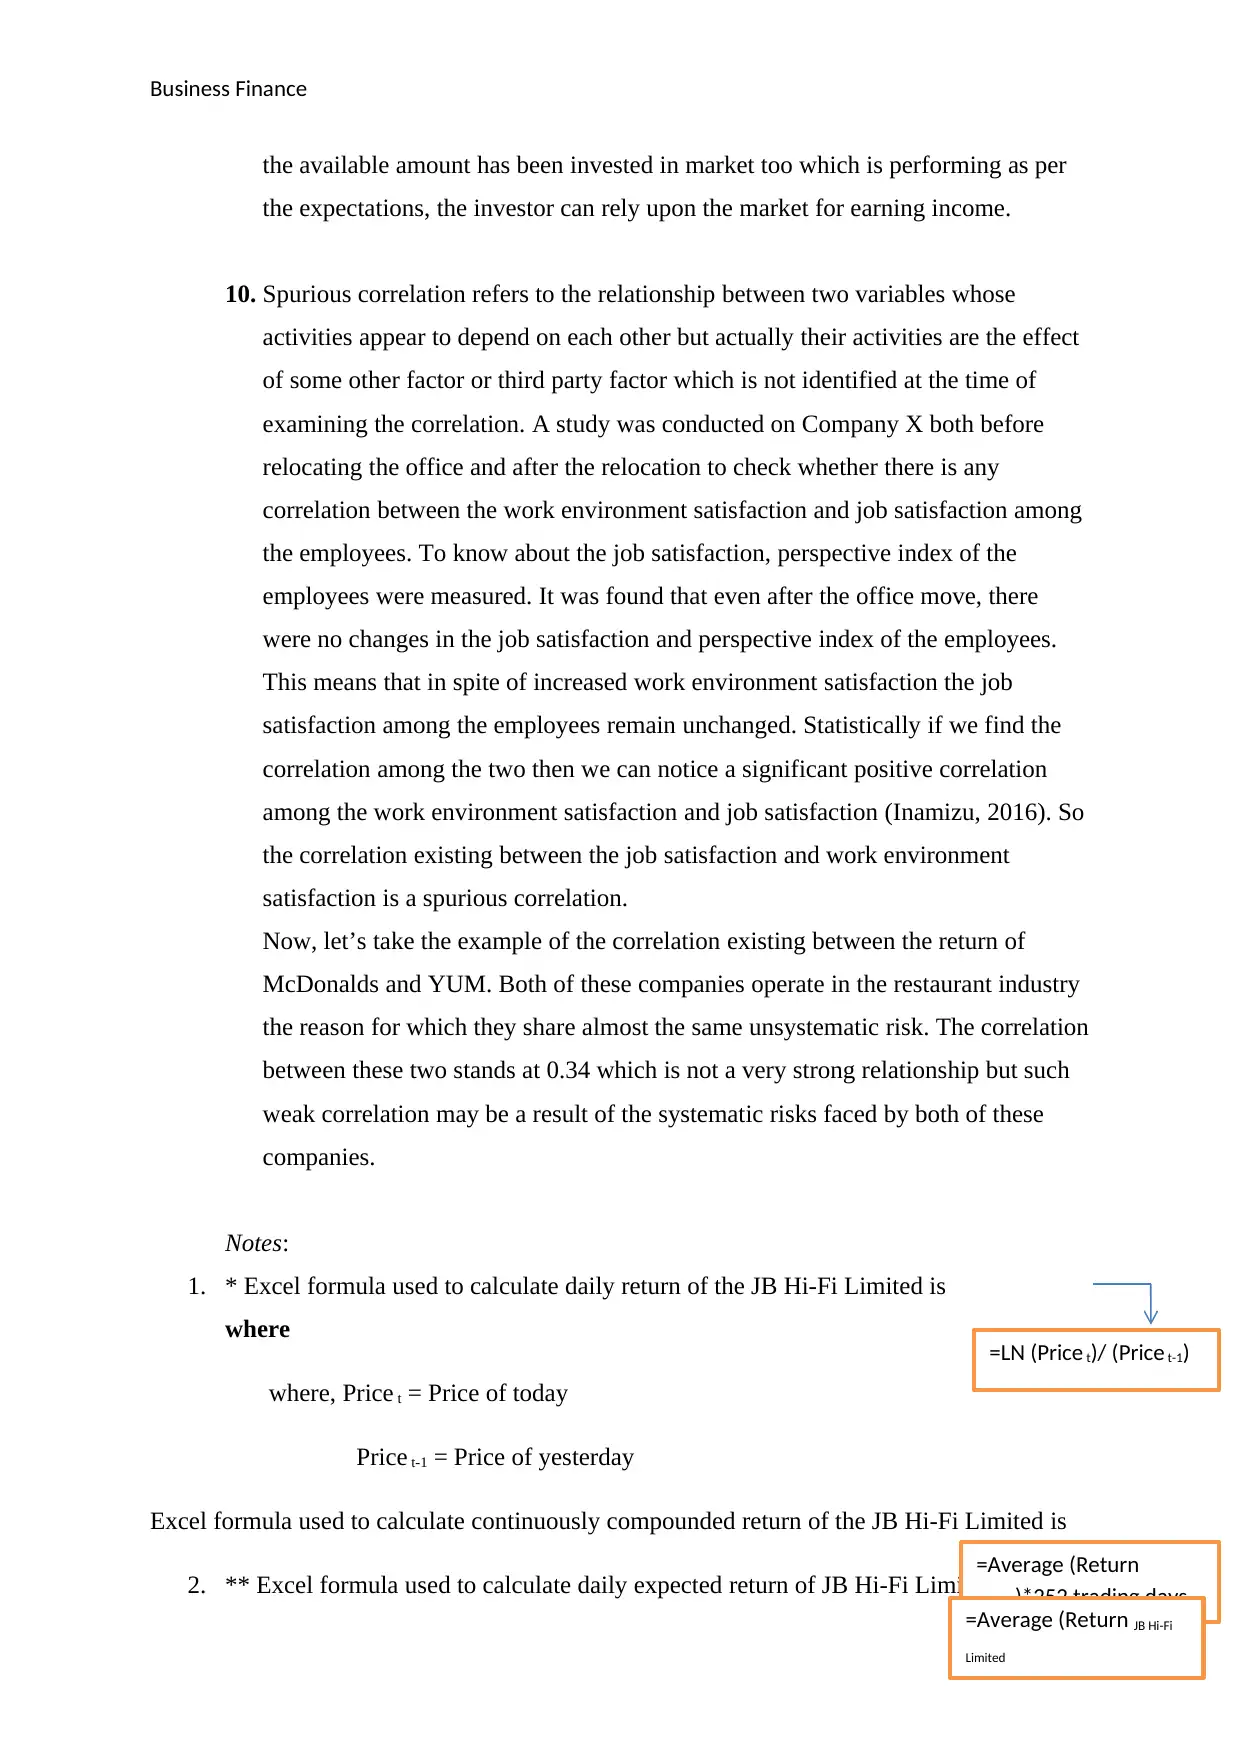
the available amount has been invested in market too which is performing as per
the expectations, the investor can rely upon the market for earning income.
10. Spurious correlation refers to the relationship between two variables whose
activities appear to depend on each other but actually their activities are the effect
of some other factor or third party factor which is not identified at the time of
examining the correlation. A study was conducted on Company X both before
relocating the office and after the relocation to check whether there is any
correlation between the work environment satisfaction and job satisfaction among
the employees. To know about the job satisfaction, perspective index of the
employees were measured. It was found that even after the office move, there
were no changes in the job satisfaction and perspective index of the employees.
This means that in spite of increased work environment satisfaction the job
satisfaction among the employees remain unchanged. Statistically if we find the
correlation among the two then we can notice a significant positive correlation
among the work environment satisfaction and job satisfaction (Inamizu, 2016). So
the correlation existing between the job satisfaction and work environment
satisfaction is a spurious correlation.
Now, let’s take the example of the correlation existing between the return of
McDonalds and YUM. Both of these companies operate in the restaurant industry
the reason for which they share almost the same unsystematic risk. The correlation
between these two stands at 0.34 which is not a very strong relationship but such
weak correlation may be a result of the systematic risks faced by both of these
companies.
Notes:
1. * Excel formula used to calculate daily return of the JB Hi-Fi Limited is
where
where, Price t = Price of today
Price t-1 = Price of yesterday
Excel formula used to calculate continuously compounded return of the JB Hi-Fi Limited is
2. ** Excel formula used to calculate daily expected return of JB Hi-Fi Limited
7
=LN (Price t)/ (Price t-1)
=Average (Return
market)*252 trading days
=Average (Return JB Hi-Fi
Limited

Business Finance
3. *** Excel formula used to calculate annual expected return of JB Hi-Fi Limited
4. **** Excel formula used to calculate standard deviation of JB Hi-Fi Limited
5. ***** Excel formula used to calculate correlation Coefficient
6. ****** Beta of the company was calculated by running a regression analysis on the
Return JB Hi-Fi Limited and Return market.
8
=Average (Return
market)*252 trading
days
=STDEV.S (Return JB Hi-
Fi Limited)
=CORREL (Return JB Hi-Fi Limited , Return market)
⊘ This is a preview!⊘
Do you want full access?
Subscribe today to unlock all pages.
Trusted by 1+ million students worldwide
Business Finance
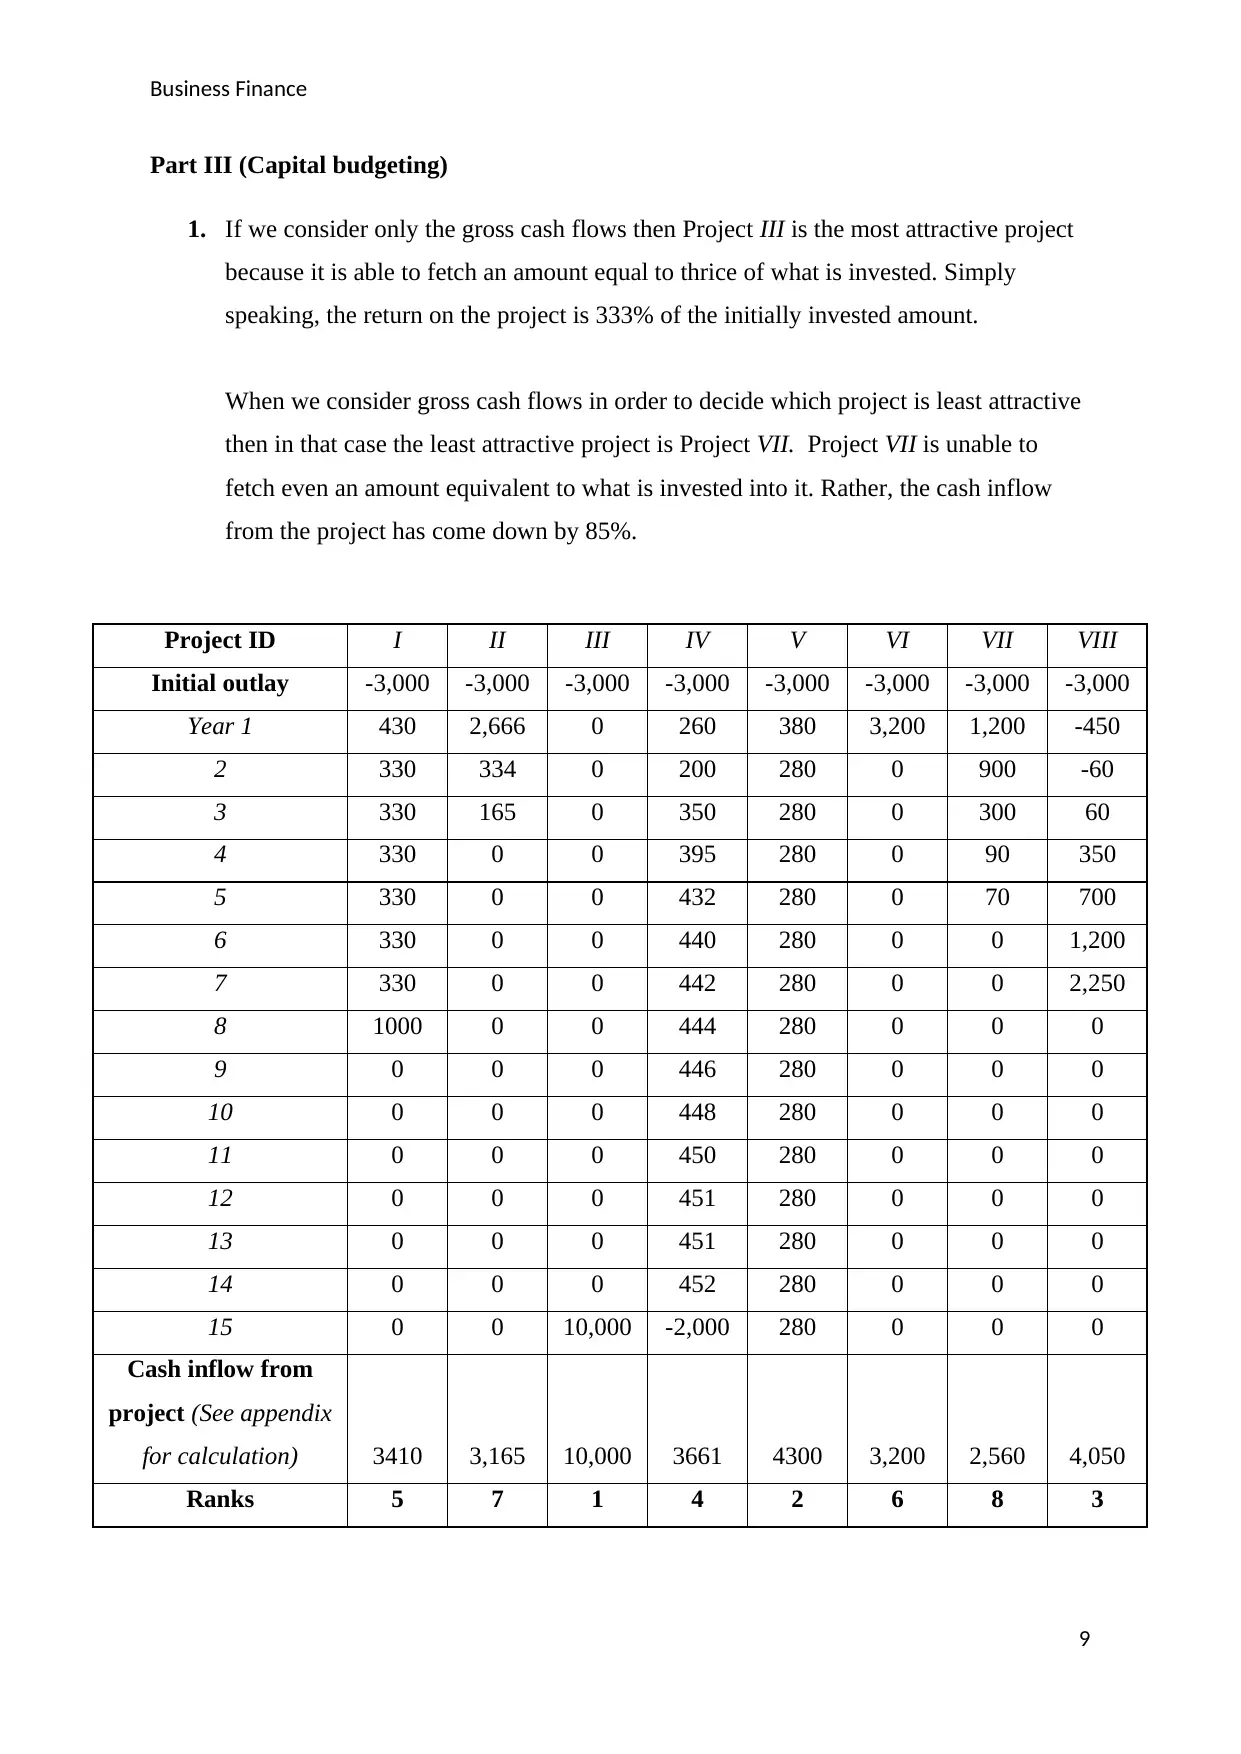
Part III (Capital budgeting)
1. If we consider only the gross cash flows then Project III is the most attractive project
because it is able to fetch an amount equal to thrice of what is invested. Simply
speaking, the return on the project is 333% of the initially invested amount.
When we consider gross cash flows in order to decide which project is least attractive
then in that case the least attractive project is Project VII. Project VII is unable to
fetch even an amount equivalent to what is invested into it. Rather, the cash inflow
from the project has come down by 85%.
Project ID I II III IV V VI VII VIII
Initial outlay -3,000 -3,000 -3,000 -3,000 -3,000 -3,000 -3,000 -3,000
Year 1 430 2,666 0 260 380 3,200 1,200 -450
2 330 334 0 200 280 0 900 -60
3 330 165 0 350 280 0 300 60
4 330 0 0 395 280 0 90 350
5 330 0 0 432 280 0 70 700
6 330 0 0 440 280 0 0 1,200
7 330 0 0 442 280 0 0 2,250
8 1000 0 0 444 280 0 0 0
9 0 0 0 446 280 0 0 0
10 0 0 0 448 280 0 0 0
11 0 0 0 450 280 0 0 0
12 0 0 0 451 280 0 0 0
13 0 0 0 451 280 0 0 0
14 0 0 0 452 280 0 0 0
15 0 0 10,000 -2,000 280 0 0 0
Cash inflow from
project (See appendix
for calculation) 3410 3,165 10,000 3661 4300 3,200 2,560 4,050
Ranks 5 7 1 4 2 6 8 3
9
Paraphrase This Document
Need a fresh take? Get an instant paraphrase of this document with our AI Paraphraser
Business Finance
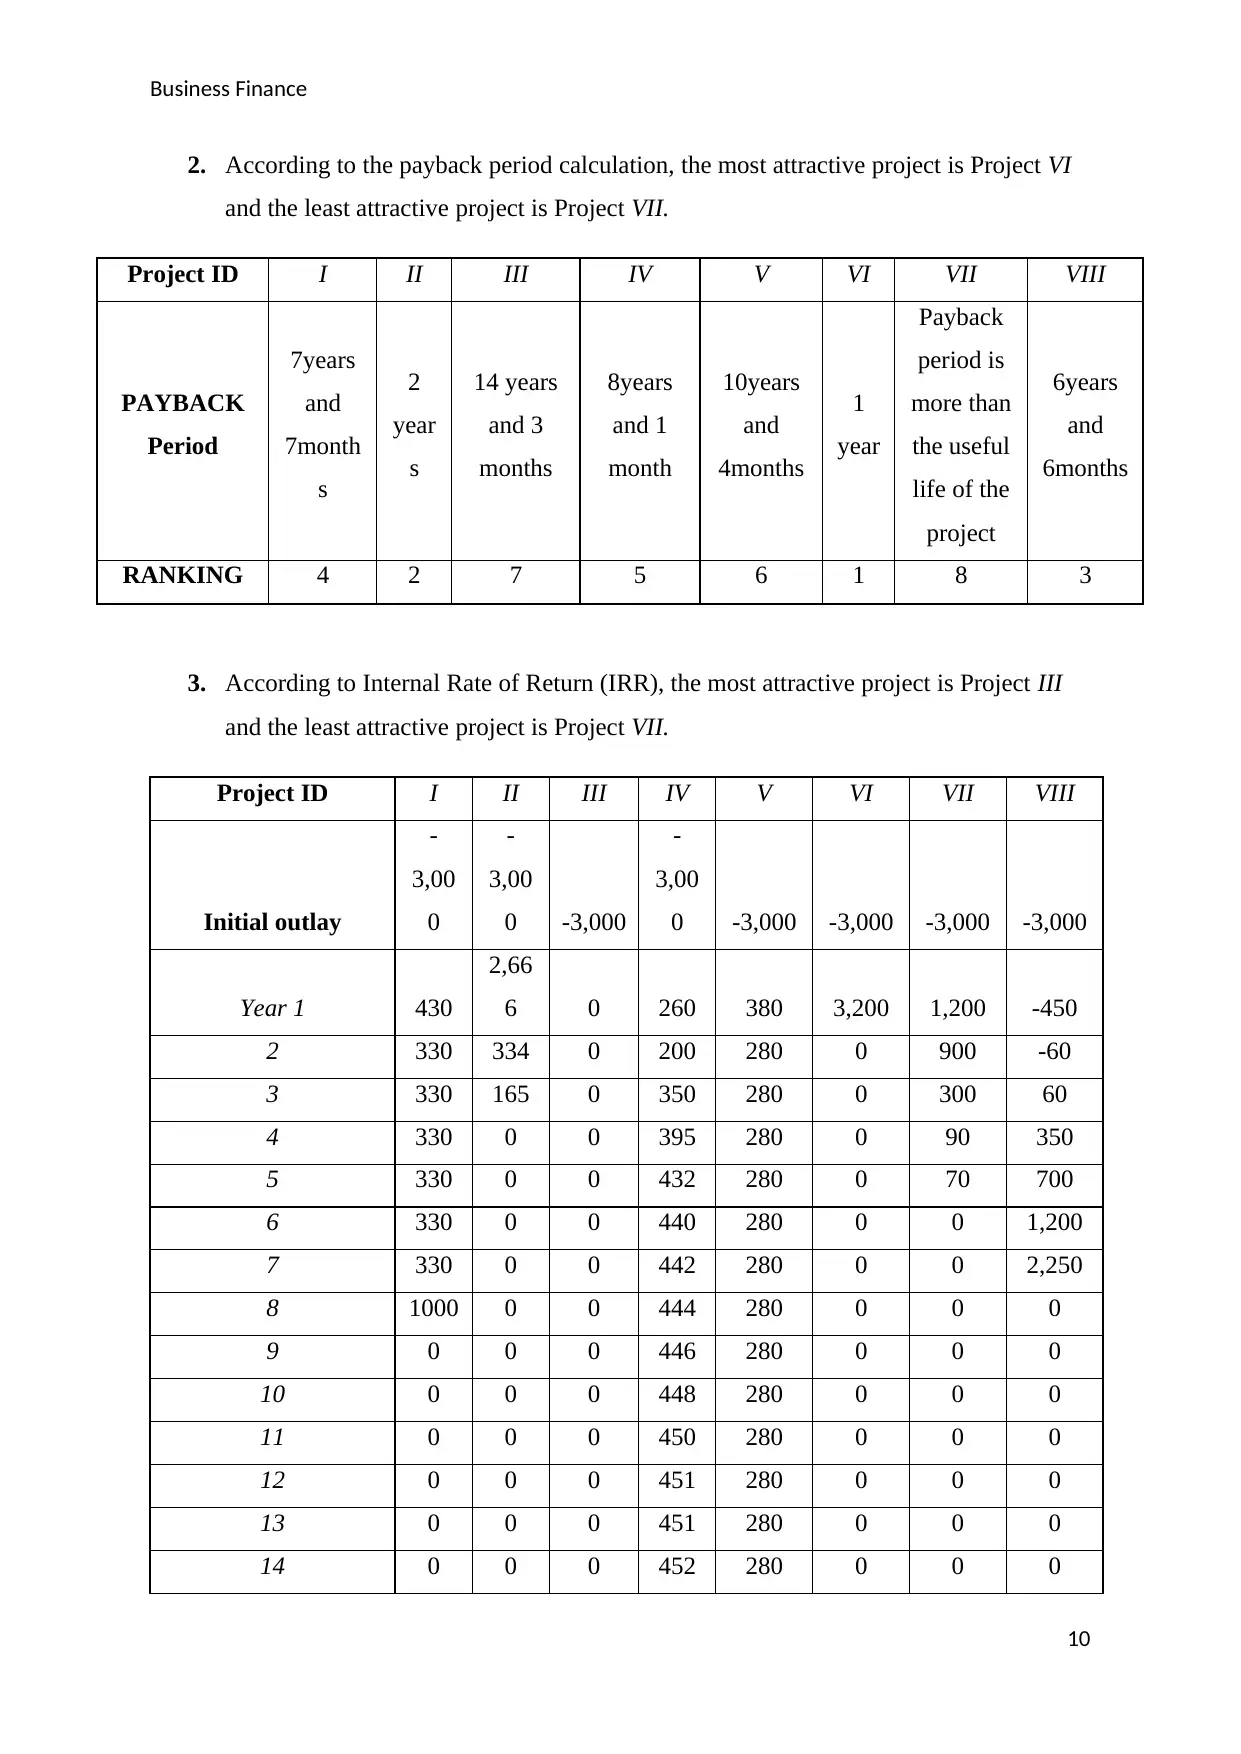
2. According to the payback period calculation, the most attractive project is Project VI
and the least attractive project is Project VII.
Project ID I II III IV V VI VII VIII
PAYBACK
Period
7years
and
7month
s
2
year
s
14 years
and 3
months
8years
and 1
month
10years
and
4months
1
year
Payback
period is
more than
the useful
life of the
project
6years
and
6months
RANKING 4 2 7 5 6 1 8 3
3. According to Internal Rate of Return (IRR), the most attractive project is Project III
and the least attractive project is Project VII.
Project ID I II III IV V VI VII VIII
Initial outlay
-
3,00
0
-
3,00
0 -3,000
-
3,00
0 -3,000 -3,000 -3,000 -3,000
Year 1 430
2,66
6 0 260 380 3,200 1,200 -450
2 330 334 0 200 280 0 900 -60
3 330 165 0 350 280 0 300 60
4 330 0 0 395 280 0 90 350
5 330 0 0 432 280 0 70 700
6 330 0 0 440 280 0 0 1,200
7 330 0 0 442 280 0 0 2,250
8 1000 0 0 444 280 0 0 0
9 0 0 0 446 280 0 0 0
10 0 0 0 448 280 0 0 0
11 0 0 0 450 280 0 0 0
12 0 0 0 451 280 0 0 0
13 0 0 0 451 280 0 0 0
14 0 0 0 452 280 0 0 0
10
Business Finance
15 0 0
10,00
0
-
2,00
0 280 0 0 0
IRR 3% 5% 8% 4% 5% 7% -8% 4%
Ranks 6 3 1 4 5 2 7 4
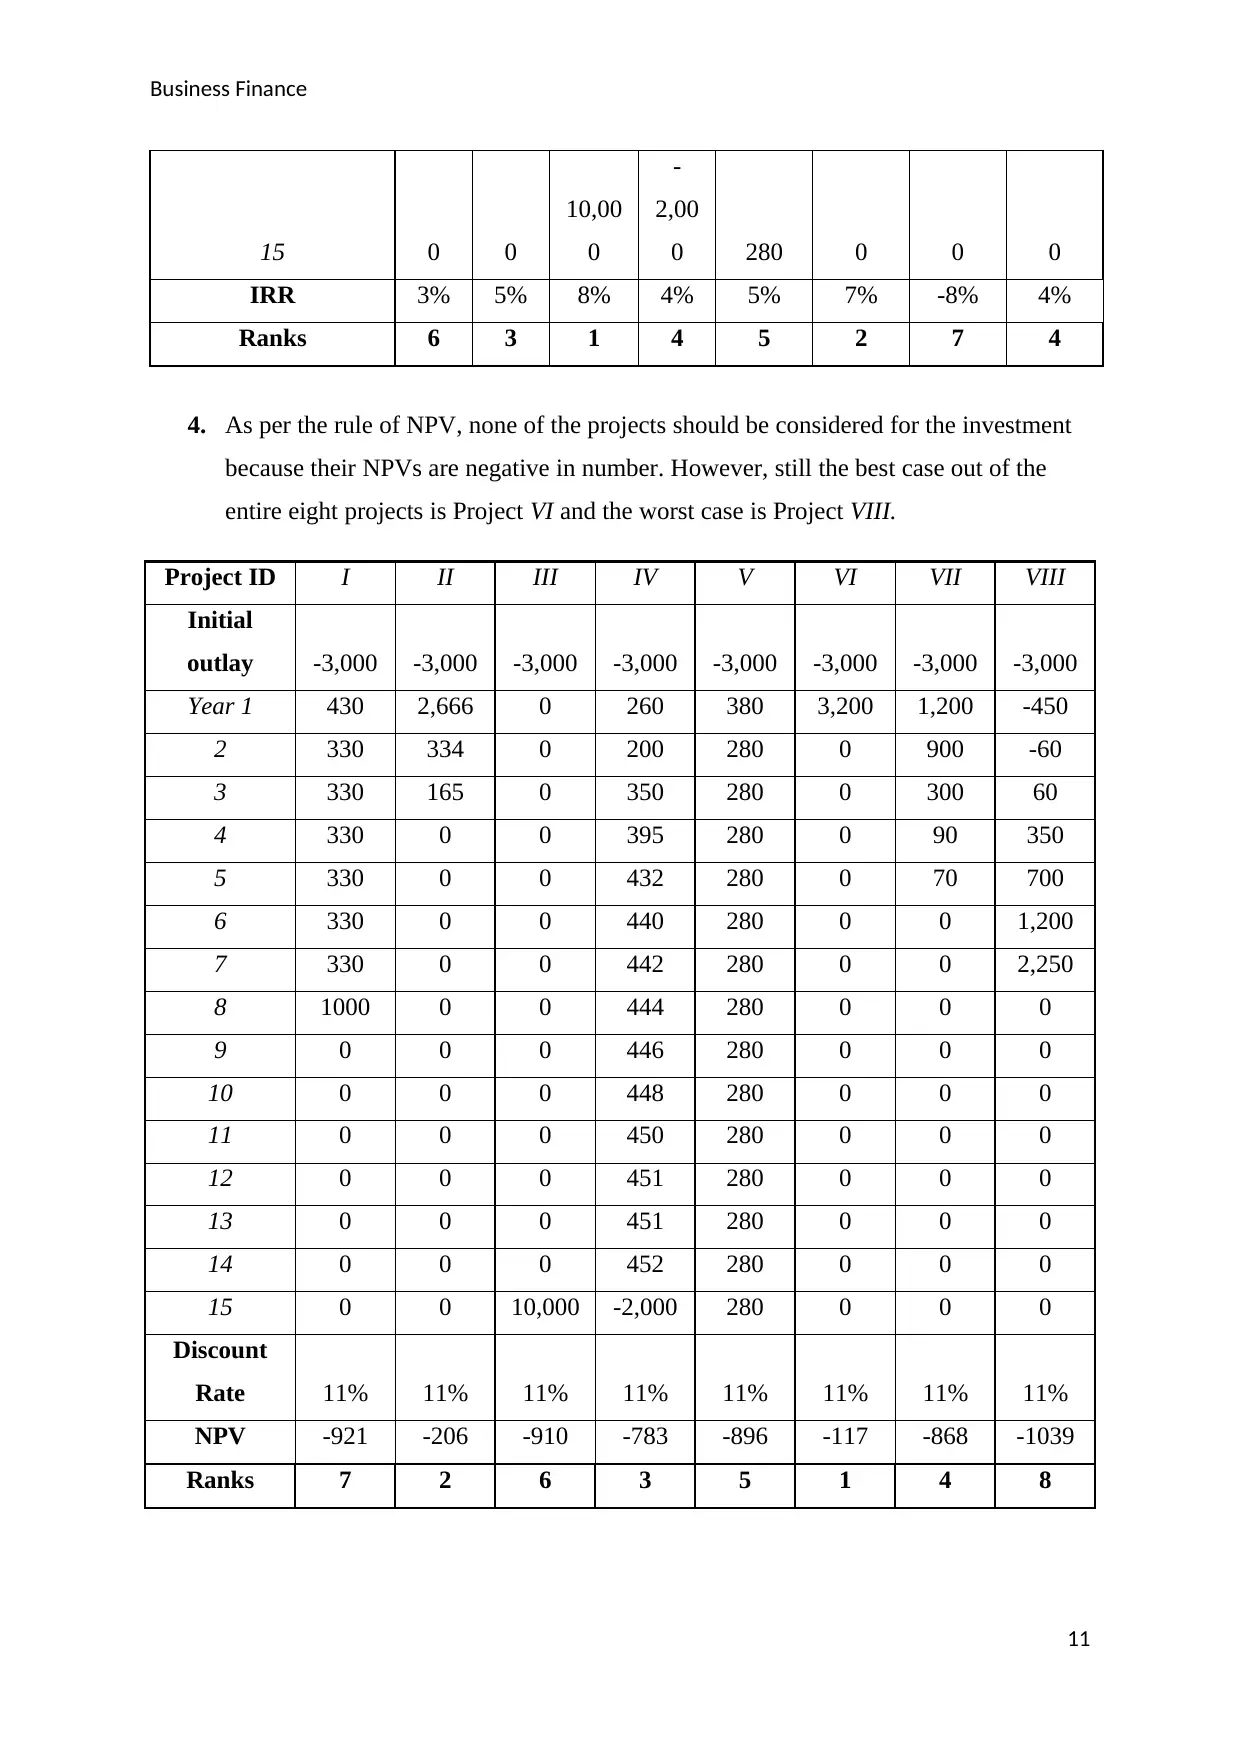
4. As per the rule of NPV, none of the projects should be considered for the investment
because their NPVs are negative in number. However, still the best case out of the
entire eight projects is Project VI and the worst case is Project VIII.
Project ID I II III IV V VI VII VIII
Initial
outlay -3,000 -3,000 -3,000 -3,000 -3,000 -3,000 -3,000 -3,000
Year 1 430 2,666 0 260 380 3,200 1,200 -450
2 330 334 0 200 280 0 900 -60
3 330 165 0 350 280 0 300 60
4 330 0 0 395 280 0 90 350
5 330 0 0 432 280 0 70 700
6 330 0 0 440 280 0 0 1,200
7 330 0 0 442 280 0 0 2,250
8 1000 0 0 444 280 0 0 0
9 0 0 0 446 280 0 0 0
10 0 0 0 448 280 0 0 0
11 0 0 0 450 280 0 0 0
12 0 0 0 451 280 0 0 0
13 0 0 0 451 280 0 0 0
14 0 0 0 452 280 0 0 0
15 0 0 10,000 -2,000 280 0 0 0
Discount
Rate 11% 11% 11% 11% 11% 11% 11% 11%
NPV -921 -206 -910 -783 -896 -117 -868 -1039
Ranks 7 2 6 3 5 1 4 8
11
15 0 0
10,00
0
-
2,00
0 280 0 0 0
IRR 3% 5% 8% 4% 5% 7% -8% 4%
Ranks 6 3 1 4 5 2 7 4
4. As per the rule of NPV, none of the projects should be considered for the investment
because their NPVs are negative in number. However, still the best case out of the
entire eight projects is Project VI and the worst case is Project VIII.
Project ID I II III IV V VI VII VIII
Initial
outlay -3,000 -3,000 -3,000 -3,000 -3,000 -3,000 -3,000 -3,000
Year 1 430 2,666 0 260 380 3,200 1,200 -450
2 330 334 0 200 280 0 900 -60
3 330 165 0 350 280 0 300 60
4 330 0 0 395 280 0 90 350
5 330 0 0 432 280 0 70 700
6 330 0 0 440 280 0 0 1,200
7 330 0 0 442 280 0 0 2,250
8 1000 0 0 444 280 0 0 0
9 0 0 0 446 280 0 0 0
10 0 0 0 448 280 0 0 0
11 0 0 0 450 280 0 0 0
12 0 0 0 451 280 0 0 0
13 0 0 0 451 280 0 0 0
14 0 0 0 452 280 0 0 0
15 0 0 10,000 -2,000 280 0 0 0
Discount
Rate 11% 11% 11% 11% 11% 11% 11% 11%
NPV -921 -206 -910 -783 -896 -117 -868 -1039
Ranks 7 2 6 3 5 1 4 8
11
⊘ This is a preview!⊘
Do you want full access?
Subscribe today to unlock all pages.
Trusted by 1+ million students worldwide
1 out of 18
Related Documents


Your All-in-One AI-Powered Toolkit for Academic Success.
+13062052269
info@desklib.com
Available 24*7 on WhatsApp / Email
![[object Object]](/_next/static/media/star-bottom.7253800d.svg)
Unlock your academic potential
Copyright © 2020–2026 A2Z Services. All Rights Reserved. Developed and managed by ZUCOL.