MAF759 Assignment: Analyzing RIO Stock, S&P 500, and ASX 200 Data

Verified

Added on  2023/03/17

|8
|660
|98
Project
AI Summary
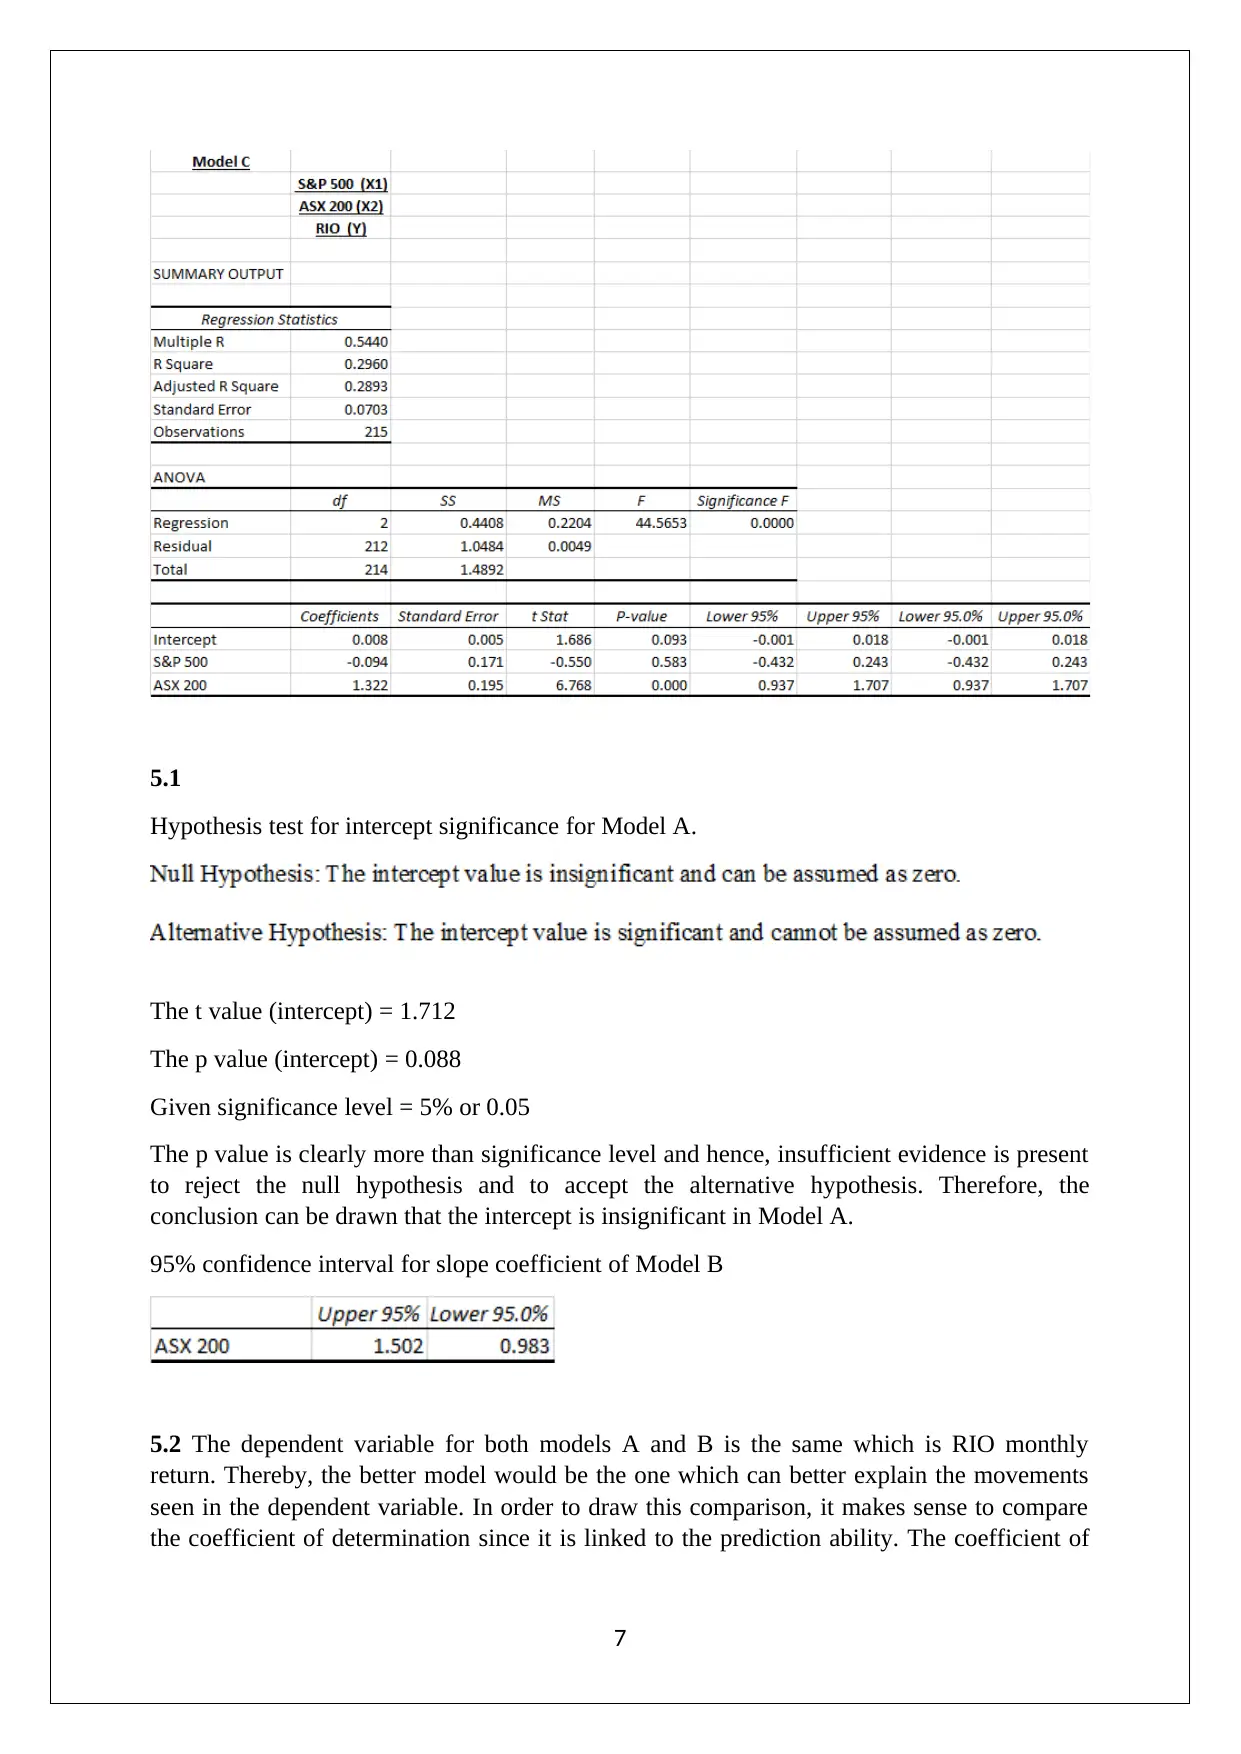
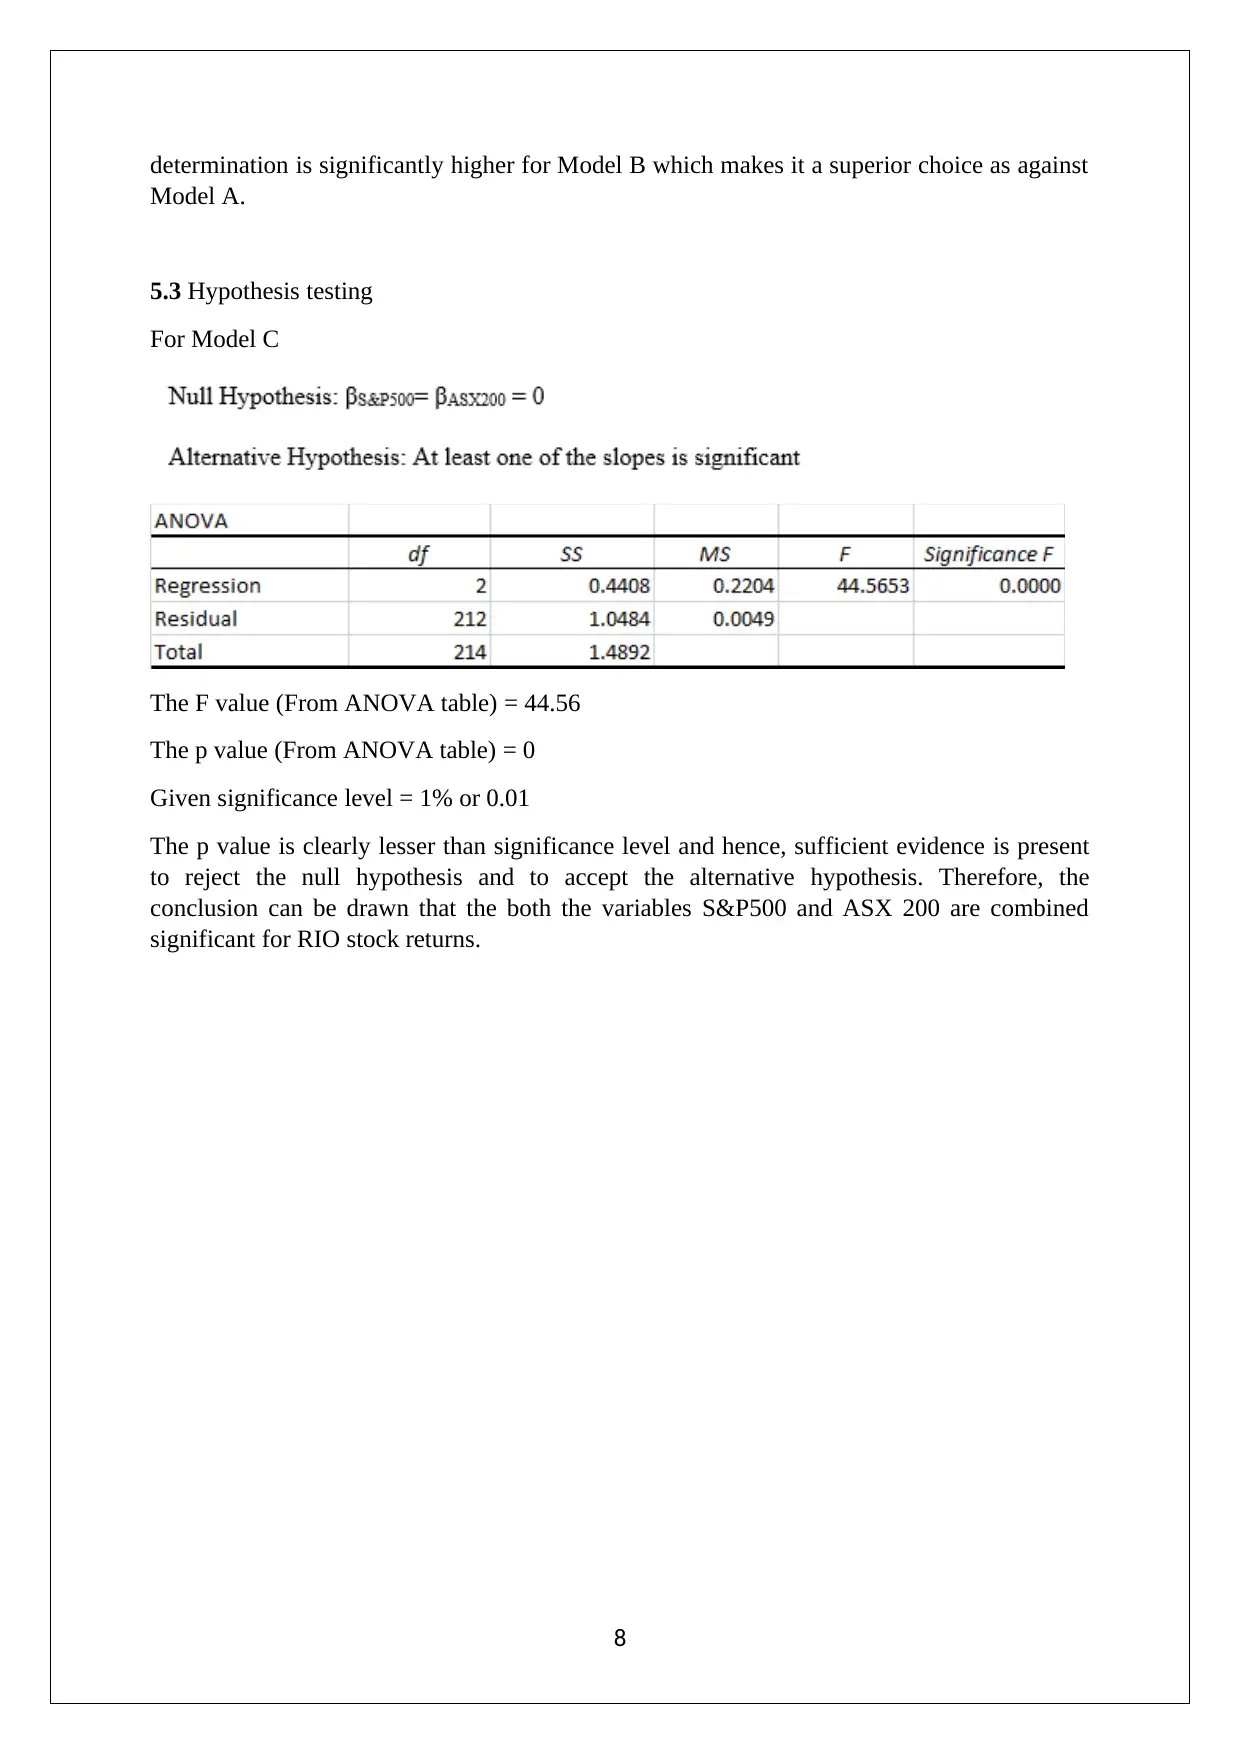
This assignment analyzes the performance of Rio Tinto Limited (RIO) stock, along with the S&P 500 and ASX 200 indices, using monthly data from January 2001 to December 2018. The solution begins with computing descriptive statistics for the monthly prices of RIO, S&P 500, and ASX 200. It then calculates monthly discrete returns and constructs frequency distributions. Probability computations are performed to assess average returns, followed by covariance and correlation analysis. Hypothesis testing is conducted to assess the significance of the correlation. The assignment further explores regression models, testing intercept significance and comparing model performance. Model A is run between S&P 500 and RIO, Model B between ASX 200 and RIO, and Model C uses both S&P 500 and ASX 200 as independent variables. The document includes detailed calculations, interpretations, and conclusions drawn from the statistical analyses, including F-tests and confidence intervals.
Document Page
ANALYTICAL METHODS
STUDENT ID:
[Pick the date]
tabler-icon-diamond-filled.svg

Secure Best Marks with AI Grader

Need help grading? Try our AI Grader for instant feedback on your assignments.
Document Page
Question 1
Numerical summary (Descriptive statistics) of monthly prices of index and stock
Question 2
Frequency tables of monthly prices of index and stock
2
Document Page
Question 3
Probability computations
Mean, standard deviation and sample would be required to find the requisite probabilities.
Probability that average return of S&P 500 is more than 5%
P (X>0.05) =?
3
Document Page
Hence, there is 0.1335 probability that average return of S&P 500 is more than 5%.
Probability that average return of ASX 200would between -2% and 2%.
P (-0.02<X<0.02) =?
Hence, there is 0.4129 probability that average return of ASX 200 would between -2%
and 2%.
4
tabler-icon-diamond-filled.svg

Secure Best Marks with AI Grader

Need help grading? Try our AI Grader for instant feedback on your assignments.
Document Page
Question 4
Covariance between ASX 200 and S&P 500 index has computed through COVAR function
of excel and output is show below.
Correlation coefficient (R) between ASX 200 and S&P 500 index has computed through
CORREL function of excel and output is show below.
Hypothesis testing
Degree of freedom = 215 – 2 = 213
P value for (for above two inputs) = 0 (two tailed)
Given significance level = 0.01
According to the decision rule, null hypothesis will only be rejected when the p value of is
lesser than the given significance level. In present case, the p value comes out to be 0 which
is clearly lesser than the significance level and thus, sufficient statistical evidence is present
to reject null hypothesis. Due to the rejection of null hypothesis, alternative hypothesis would
be accepted and the conclusion can be drawn that the correlation coefficient between ASX
200 and S&P 500 index is statistically significant and is not zero.
Question 5
Regression models
Model A has been run between S&P 500 (independent variable) and RIO (dependent
variable).
5
Document Page
Model B has been run between ASX 200 (independent variable) and RIO (dependent
variable).
Model C has been run between S&P500 and ASX 200 (independent variable) and RIO
(dependent variable).
6
Document Page
5.1
Hypothesis test for intercept significance for Model A.
The t value (intercept) = 1.712
The p value (intercept) = 0.088
Given significance level = 5% or 0.05
The p value is clearly more than significance level and hence, insufficient evidence is present
to reject the null hypothesis and to accept the alternative hypothesis. Therefore, the
conclusion can be drawn that the intercept is insignificant in Model A.
95% confidence interval for slope coefficient of Model B
5.2 The dependent variable for both models A and B is the same which is RIO monthly
return. Thereby, the better model would be the one which can better explain the movements
seen in the dependent variable. In order to draw this comparison, it makes sense to compare
the coefficient of determination since it is linked to the prediction ability. The coefficient of
7
tabler-icon-diamond-filled.svg

Paraphrase This Document

Need a fresh take? Get an instant paraphrase of this document with our AI Paraphraser
Document Page
determination is significantly higher for Model B which makes it a superior choice as against
Model A.
5.3 Hypothesis testing
For Model C
The F value (From ANOVA table) = 44.56
The p value (From ANOVA table) = 0
Given significance level = 1% or 0.01
The p value is clearly lesser than significance level and hence, sufficient evidence is present
to reject the null hypothesis and to accept the alternative hypothesis. Therefore, the
conclusion can be drawn that the both the variables S&P500 and ASX 200 are combined
significant for RIO stock returns.
8
chevron_up_icon
1 out of 8
circle_padding
hide_on_mobile
zoom_out_icon
[object Object]