Deakin University MIS784: Market Analysis of Sony Televisions
VerifiedAdded on 2022/11/01
|11
|2935
|352
Report
AI Summary
This report presents a market analysis conducted by Sony to assess customer preferences for curved televisions, leveraging conjoint analysis to understand the relative importance of various product attributes. The study involved a sample of 20 customers, employing both qualitative and quantitative data collection methods to gather insights into preferences regarding refresh rates, screen sizes, prices, and display features. The analysis aimed to determine part-worth values, purchase patterns, and market share, ultimately guiding Sony in making informed decisions about product offerings and pricing strategies. The report highlights the significance of conjoint analysis in identifying the most profitable product configurations and making recommendations based on the findings, such as prioritizing the sale of larger-screen televisions to maximize profit. The report also discusses the methodology, including the use of a fractional factorial design and regression analysis to interpret the data and derive actionable insights for Sony's marketing and product development strategies.

Running Head: MARKET ANALYSIS 1
MARKET ANALYSIS
Name
Institution
Date
MARKET ANALYSIS
Name
Institution
Date
Paraphrase This Document
Need a fresh take? Get an instant paraphrase of this document with our AI Paraphraser
MARKET ANALYSIS 2
Abstract
Companies produce very similar products today which call for each one of them to devise
alternative methods in order to compete for the market share. These methods may include proper
advertising among others. Besides this challenge, the companies also face another major one
which is regular changes in customers’ preferences and tastes hence the most effective way to
ensure that a company attracts more customers while still retaining the existing ones is the most
crucial thing. Given that the customers may have different preferences on the same product at the
same time, it is even harder for a single company to produce products with all the attributes that
the customers require. To curb this challenge, SONY, a company that sells curved televisions,
performed a conjoint analysis to analyze what the preferences for the customers were.
The company used a sample of 20 customers and by applying both qualitative and
quantitative data collection methods, they were able to induce important information as well as
choosing the product that would yield the highest profits.
MARKET ANALYSIS 3
Purpose of report
The main purpose for this report is to give the findings of the conjoint analysis held by the
SONY Company as well as discussing its findings. Its impacts on the company are also
discussed in this report.
Introduction
In any market, the entry of new players is a common trend which leads to stiff
competitions among business organizations dealing in similar brands or the same line of products
(Sadeghirad, 2016). This is still the case with companies such as Sony, Samsung and LG that are
currently competing for the highest market share for the customers who purchase curved
televisions. Differences in screen sizes, system speeds and prizes have been the outstanding
factors that these companies have been using to attract more customers while still retaining the
existing ones. One of the oldest strategies for surviving in the market, especially a highly
competitive market is that one has to know the strengths and the weaknesses of their competitors
(Fan, 2015).
One way of achieving this is carrying out a conjoin market analysis as it was the case
with SONY. There are numerous reasons as well as advantages of doing this for any business
organization. In conjunction to this, it is definite that there are major reasons for comparing
different Tv attributes in choosing the user preferences. First, different customers consider
different attributes in the same product. For example, a customer may feel satisfied by a
particular Tv brand due to its price while another customer may feel completely dissatisfied by
the same product because of its screen size (Dangelico, 2016). When manufactures or the TV
brand sellers learn about different Tv preferences in relation to the customer preference, they can
⊘ This is a preview!⊘
Do you want full access?
Subscribe today to unlock all pages.
Trusted by 1+ million students worldwide
MARKET ANALYSIS 4
be able to design Tv products with high range of attributes to cater for a wide range of customers
which also increases the market share and profit.
Analyzing different TV attributes is also key as it will help the organizations to
understand the attributes which the customers prefer hence focus on that brand for increased
profits. Understanding the attributes helps both the manufactures and the sellers to make sound
choices about which products they will next manufacture and sell respectively based on the
consumer patterns and behavior (Cultrera, 2017).
In a bid to ensure that it has the right view of the market, Sony carried out a conjunction
analysis which was crucial as the company obtained firsthand information from the customers
who provided their decision about the market. Also, the company was able to measure the price
the sensitivity and noted that, besides the price, other factors still affected the customers purchase
preferences (Kortler et.al. 2015). The company was also able to determine the interaction
between the price of curved televisions and their brand as well as other competitor brands.
Methodology
Research Strategy
Data for this research was obtained from the customers who are the real consumers of the
television brands. A total number of 20 customers were sampled form the population and their
feedback analyzed. They were interviewed about their preferences towards different television
attributes such as refresh rates, brands, prices and screen sizes and the information recorded on a
scale of 1-7.
Data Collection and Sampling
The method used for data collection in this case was the fractional factorial design. Data
was collected from 20 customers who were allowed to choose on a scale of 1 – 7 on the
Paraphrase This Document
Need a fresh take? Get an instant paraphrase of this document with our AI Paraphraser
MARKET ANALYSIS 5
attributes they preferred in a curved television. “1” represented the least preferred attribute while
‘7’ represented the mostly preferred products. The data was then analyzed using the regression
method where important aspects such as purchase patterns, purchase frequencies, market share
and sales were depicted. The data was also analyzed in tables and pie charts for ease or
interpretation and for further reference by the company manager. Storing the data was also good
for future planning of the company.
Research Method
In order for the company to meet its goals both qualitative and quantitative research methods
were applied.
Research Approach
An inductive research approach was used in the study. In this case the researching firm,
SONY, only took a specific observation from only 20 customers to draw a general conclusion
from that sample.
Discussion
There are four attributes that Sonny has to consider when determining the consumer
preferences in this case which include the refresh rate, screen size, price and display. Although
each company have offer products with difference in these four attributes, the data collected by
SONY can be analyzed and increase its sales based on the real insights from the data.
Determining the Part Worth
Part-worth is among the first values that a company has to determine while carrying out a
conjoint analysis (Visconti, 2017). As many features can be added to any product, determining
the part worth will help the organization carrying out the conjoint analysis to determine the
products which it can be able to offer in the market as well as the features that the company can
MARKET ANALYSIS 6
in cooperate in their products. These values are very sensitive for the any organization since a
wrong guess may end up into massive losses. However, once proper analysis is made and the
right decision made an organization will be guaranteed for profits. A wrong guess may result
from wrong information given to customers through ways such as wrong advertisement brand
over engineering (Oswald, 2015). The part-worth is also crucial as is used as a measure of telling
both the manufactures and the sellers and particularly Sony Company in this case how the
customers are prepared in spending for a particular product attribute over another.
Once Sony has analyzed the results and also based on the results from the conjoint
analysis, the Company can be able to make brand equity. This will be achieved as the company
will be able to measure the value of competing firms’ and names as well as their product features
(Leventhal, 2015). While still analyzing other firm’s products to make good out of them, any
information regarding brand popularity and strength are also obtained. In a bid to achieve this,
the part-worth of each customer who was part of the sample was calculated using the regression
method. The main reason for calculating each responds data separately is to construct the
purchase profiles which at a very high percentage; depict the purchase patterns of the customers.
The purchase profiles will be very critical in market segmentation (Koksal, 2015).
Both perceived and actual benefits are achieved by determine the purchase profiles. The
major benefit that Sony will get from analyzing the purchase profiles of the data is that the
Company will have a better insights about the value that the customers put in their services and
will be able to make the necessary decisions if it has to stay in the market or increase the its
market share (Koksal, 2017). The company will also be in a position to redesign its products to
meet the preferences of the customers if possible (Hassan et.al, 2017).
⊘ This is a preview!⊘
Do you want full access?
Subscribe today to unlock all pages.
Trusted by 1+ million students worldwide

MARKET ANALYSIS 7
The next step is determining the purchase patterns (Sadeghirad, 2016). As earlier noted,
this is the immediate positive effect of analyzing the purchase profiles. Any company that is
aware of the purchase patterns of the customers will definitely never lose them. the Company
will be able to understand what portion of customers require what type of features based on
aspects such as the customers’ believes, origin or spending habits (Jun et.al, 2015). Once the
purchase patterns of the customers are known, the company will be able to determine its share in
the ever competitive market (Pareto, 2017). In case the market share is too small, then the
Company will be able to design as steps it will take to increase it otherwise will be operating on
losses which may force it out of the market (Deodhar, 2018).
From the data collected the market share of Sony Company can be determined. With such
a market share and given that the company can only offer only 4000 pixels and 120 HZ TV,
there is need for an immediate decision to be taken if the company has to cope up with the
completion from other big companies such as LG and Samsung who deal with similar products.
When the company is aware of the market share it commands, it will then be able to determine
the number of sales it can make in a given area (Lamberton et.al.2015). This will still be the case
with SONY Company. Having a proper knowledge about the number of sales you can make in a
given area at a specific time reduces the cases the excess demands or supply’s. Sony Company
could now determine the amount of profits they could make from the sales they make since all
these can be calculated if the market share and the sales are known.
Recommendations
Based on the information provided in the case study as well as the analysis of the
collected data, the company has to make crucial decisions requiring their sales. Currently, the
company can only produce televisions of a resolution of four thousand pixels at a refresh speed
Paraphrase This Document
Need a fresh take? Get an instant paraphrase of this document with our AI Paraphraser
MARKET ANALYSIS 8
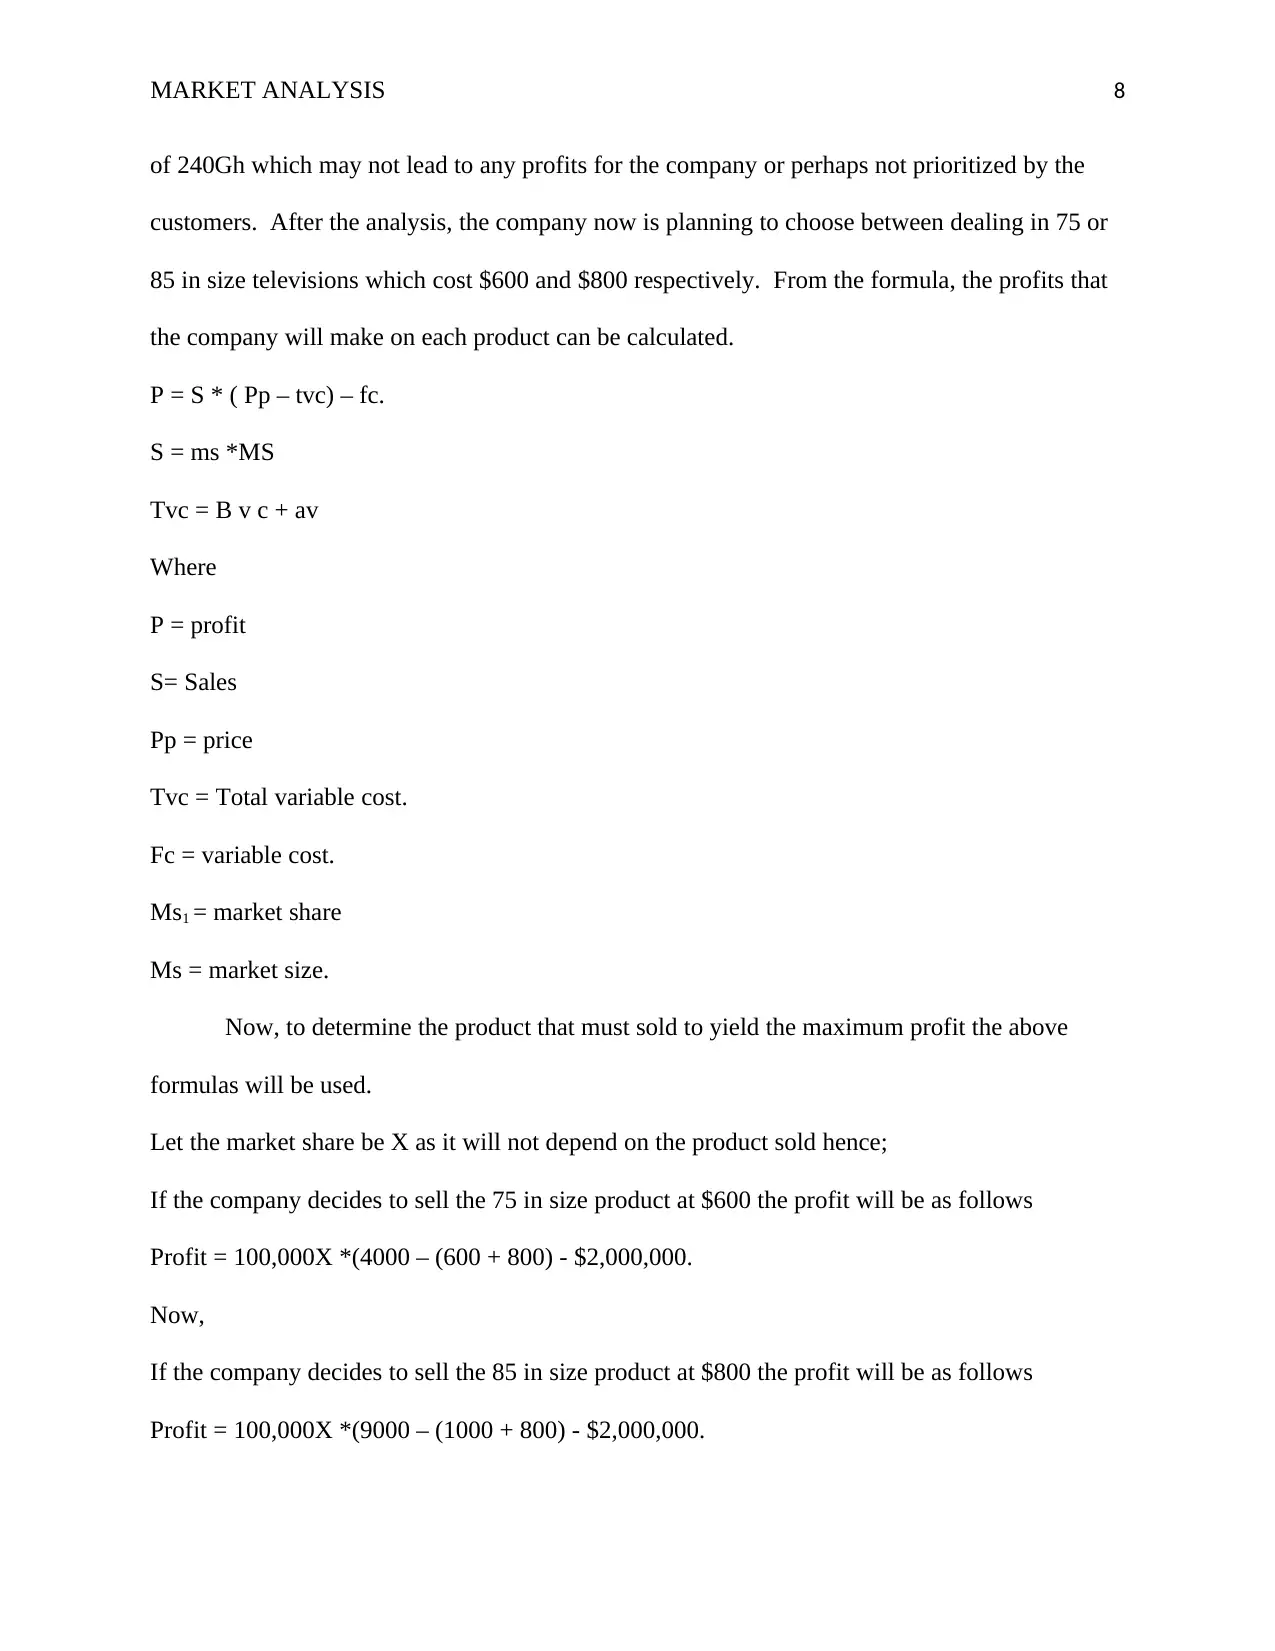
of 240Gh which may not lead to any profits for the company or perhaps not prioritized by the
customers. After the analysis, the company now is planning to choose between dealing in 75 or
85 in size televisions which cost $600 and $800 respectively. From the formula, the profits that
the company will make on each product can be calculated.
P = S * ( Pp – tvc) – fc.
S = ms *MS
Tvc = B v c + av
Where
P = profit
S= Sales
Pp = price
Tvc = Total variable cost.
Fc = variable cost.
Ms1 = market share
Ms = market size.
Now, to determine the product that must sold to yield the maximum profit the above
formulas will be used.
Let the market share be X as it will not depend on the product sold hence;
If the company decides to sell the 75 in size product at $600 the profit will be as follows
Profit = 100,000X *(4000 – (600 + 800) - $2,000,000.
Now,
If the company decides to sell the 85 in size product at $800 the profit will be as follows
Profit = 100,000X *(9000 – (1000 + 800) - $2,000,000.
MARKET ANALYSIS 9
Hence the recommendation is that the company should sell the 85 in size Television to make
more profits.
Conclusion
Although the entire data collection by SONY may have been time consuming, it is evident that
they the company benefited a lot from it. First, it has been able to identify the product that it can
sell in the market to yield the highest profit amongst many other choices and can use this profit
to increase the production or the market share. Just like SONY, other companies can also adopt
conjoint analysis the same benefits. The results that were obtained from the analysis can also be
used for future references while still having adequate information about the customers’
preferences and tastes, the market share, purchase patterns, sales and the profits that a company
can make from a given brand of product.
⊘ This is a preview!⊘
Do you want full access?
Subscribe today to unlock all pages.
Trusted by 1+ million students worldwide
MARKET ANALYSIS 10
References
Alalwan, A. A., Rana, N. P., Dwivedi, Y. K., & Algharabat, R. (2017). Social media in
marketing: A review and analysis of the existing literature. Telematics and
Informatics, 34(7), 1177-1190.
Cultrera, L., Croquet, M., & Jospin, J. (2017). Predicting Bankruptcy of Belgian SMEs: A
Hybrid Approach Based on Factorial Analysi. International Business Research, 10(3),
33-41.
Dangelico, R. M., & Vocalelli, D. (2017). “Green Marketing”: an analysis of definitions, strategy
steps, and tools through a systematic review of the literature. Journal of Cleaner
production, 165, 1263-1279.
Deodhar, A., Miceli-Richard, C., Baraliakos, X., Marzo-Ortega, H., Gladman, D. D., Martin,
R., ... & Shete, A. (2018). SAT0270 Low incidence of both new-onset and flares of
uveitis in secukinumab-treated patients with ankylosing spondylitis: clinical trial and
post-marketing safety analysis.
Fan, S., Lau, R. Y., & Zhao, J. L. (2015). Demystifying big data analytics for business
intelligence through the lens of marketing mix. Big Data Research, 2(1), 28-32.
Hasan, R., Prodhan, M. D. H., Rahman, S. M. M., Khanom, R., & Ullah, A. (2017).
Determination of Organophosphorus Insecticide Residues in Country Bean Collected
from Different Markets of Dhaka. J. Env. Anal. Toxicol, 7, 489.
Jun, S., Park, S., & Jang, D. (2015). A technology valuation model using quantitative patent
analysis: A case study of technology transfer in big data marketing. Emerging Markets
finance and trade, 51(5), 963-974.
Paraphrase This Document
Need a fresh take? Get an instant paraphrase of this document with our AI Paraphraser
MARKET ANALYSIS 11
Koksal, M. A., & Valasai, G. D. (2015). Modelling and Analysi Power Generation Opti.
Kotler, P., Burton, S., Deans, K., Brown, L., & Armstrong, G. (2015). Marketing. Pearson
Higher Education AU.
Lamberton, C. P., & Stephen, A. T. (2015). Taking stock of the digital revolution: A critical
analysis and agenda for digital, social media, and mobile marketing research. Saïd
Business School WP, 16.
Leventhal, B. (2016). Geodemographics for marketers: Using location analysis for research and
marketing. Kogan Page Publishers.
Oswald, L. R. (2015). The structural semiotics paradigm for marketing research: Theory,
methodology, and case analysis. Semiotica, 2015(205), 115-148.
Pareto, V. (2017). The rise of professionalism: Monopolies of competence and sheltered markets.
Routledge.
Sadeghirad, B., Duhaney, T., Motaghipisheh, S., Campbell, N. R. C., & Johnston, B. C. (2016).
Influence of unhealthy food and beverage marketing on children's dietary intake and
preference: a systematic review and meta‐analysis of randomized trials. Obesity
Reviews, 17(10), 945-959.
Visconti, P., Sbarro, B., & Primiceri, P. (2017). a st x-nucleo-based telemetry unit for detection
and wifi transmission of competition car sensors data: firmware development, sensors
testing and real-time data analysi. International Journal on Smart Sensing & Intelligent
Systems, 10(4).
Voorhees, C. M., Brady, M. K., Calantone, R., & Ramirez, E. (2016). Discriminant validity
testing in marketing: an analysis, causes for concern, and proposed remedies. Journal of
the Academy of Marketing Science, 44(1), 119-134.
1 out of 11
Related Documents


Your All-in-One AI-Powered Toolkit for Academic Success.
+13062052269
info@desklib.com
Available 24*7 on WhatsApp / Email
![[object Object]](/_next/static/media/star-bottom.7253800d.svg)
Unlock your academic potential
Copyright © 2020–2026 A2Z Services. All Rights Reserved. Developed and managed by ZUCOL.