Corporate Financial Strategy Report
VerifiedAdded on 2020/02/05
|24
|6240
|32
Report
AI Summary
This report provides a comprehensive analysis of Debenhams' corporate financial strategy. It examines various aspects, including the calculation of the weighted average cost of capital (WACC), capital structure, dividend policy, and stock valuation using multiple methods. The report critically assesses Debenhams' capital structure and its repayment ability, analyzing the debt-to-equity ratio and interest coverage ratio. It also delves into the company's dividend policy, examining changes in dividends over five years, critically assessing dividend payouts and analyzing dividend consistency. Furthermore, the report employs static valuation multiples and absolute valuation methods to assess Debenhams' valuation. Finally, it evaluates Debenhams' position within the corporate life cycle, considering revenue and profit growth, financing structure, free cash flow, and dividend decisions. The report uses various financial ratios and models to support its analysis and concludes with an overall assessment of Debenhams' financial health and strategic direction.

CORPORATE FINANCIAL
STRATEGY
STRATEGY
Paraphrase This Document
Need a fresh take? Get an instant paraphrase of this document with our AI Paraphraser
Table of Contents
INTRODUCTION...........................................................................................................................1
(A) DISCOUNT RATES AND CAPITAL STRUCTURE.............................................................1
(i) Calculation of cost of debt (Kd), cost of equity (Ke) and weighted average cost of capital1
Cost of debt.............................................................................................................................1
Cost of equity.........................................................................................................................2
Wweighted average cost of capital.........................................................................................2
(ii) Critical assessment of capital structure & its repayment ability......................................3
(B) DIVIDEND POLICY................................................................................................................4
(i) Change in dividend over 5 historical years........................................................................5
(ii) Critical assessment of dividend pay-outs.........................................................................5
(iii) Critical analysis of dividend consistency........................................................................6
(C) VALUATION............................................................................................................................7
Static valuation multiples.......................................................................................................7
Absolute valuation method.....................................................................................................7
(D) DEBANHAMS POSITION IN THE CORPORATE LIFE CYCLE........................................8
(i) Revenue and profit growth................................................................................................8
(ii) Financing........................................................................................................................10
(iii) Free cash flow................................................................................................................10
(iv) Dividend payout ratio....................................................................................................11
(E) SHAREHOLDER VALUE PERFORMANCE.......................................................................12
Reapport Analysis................................................................................................................12
Revenue growth...............................................................................................................12
EBITDA margin..............................................................................................................12
Cash tax rate....................................................................................................................13
Working capital investment.............................................................................................13
Fixed capital investment..................................................................................................13
Cost of capital..................................................................................................................14
Value/Growth/Duration/Terminal...................................................................................14
CONCLUSION..............................................................................................................................14
REFERENCES..............................................................................................................................16
APPENDIX....................................................................................................................................18
Appendix 1...........................................................................................................................18
Appendix 2...........................................................................................................................18
Appendix 3...........................................................................................................................18
Appendix 4...........................................................................................................................19
Appendix 5...........................................................................................................................19
⊘ This is a preview!⊘
Do you want full access?
Subscribe today to unlock all pages.
Trusted by 1+ million students worldwide
Index of Tables
Table 1 Calculation of cost of debt (Kd)..........................................................................................1
Table 2 Calculation of cost of equity (Ke).......................................................................................2
Table 3 Calculation of weighted average cost of capital (WACC).................................................2
Table 4 Debt to equity ratio and interest coverage ratio..................................................................3
Table 5 Dividend per share and total cash dividend........................................................................5
Table 6 Dividend pay-out ratio of Debanhams................................................................................6
Table 7 Required rate of return table for M&S...............................................................................8
Table 8 Equity value by using Gordon model.................................................................................8
Table 9 Percentage change in revenue and profit over last 5 years.................................................8
Table 10 Calculation of Debt and equity proportion in total capital.............................................10
Table 11 Calculation of FCF in last 5 year....................................................................................10
Table 12 Dividend payout ratio from FY2012 to FY2016............................................................11
Table 13 Calculation of Terminal value and enterprise value.......................................................14
Table 14 Revenue growth of Debanhams and Marks and Spencer...............................................18
Table 15 EBITDA growth and EBITDA margin of Debanhams and M&S..................................18
Table 16 Working capital of Debanhams Plc from 2012 to 2016.................................................18
Table 17 Fixed assets turnover ratio of Debanhams and M&S.....................................................19
Table 18 WACC and ROCE analysis............................................................................................19
Index of Figures
Figure 1 Debt to equity ratio for 5 years..........................................................................................4
Figure 2 Debanhams dividend per share from FY2013 to FY2017................................................5
Figure 3 Debanham revenue and profitability from 2012 to 2016.................................................9
Figure 4 Debt and equity composition of Debanhams..................................................................10
Figure 5 Debanhams and Marks and Spencer' sales performance.................................................12
Paraphrase This Document
Need a fresh take? Get an instant paraphrase of this document with our AI Paraphraser
INTRODUCTION
In today’s era, establishments are facing number of financial challenges due to volatile
external market conditions. Funds are the key requirement for every enterprises regardless their
size and nature of business because none of the entity can run their daily activities without
enough financial resources. Therefore, in every organization, Certified Financial Officer (CFO)
is responsible to handle, monitor and administrate financial functions. They make policies &
plans to procure required capital to finance their operations and put control over its use for
paying off their monetary obligations and financial commitment. Debanhams is a UK-based
multinational retailer which is operating in the fashion industry. Its product portfolio covers
designer cloth, accessories, cosmetics, home & furniture products, electrical equipments and
gifts & toys. The report here purposes at examining its corporate financial strategy through the
analysis of weighted average cost of capital and capital structure. Moreover, dividend policy and
stock valuation will be made using valuation multiples and absolute valuation technique. Lastly,
it will make evaluation of its position under the corporate life cycle i.e. start-up, growth, maturity
and decline through revenue & profit, financing structure, free cash flow and dividend decisions.
(A) DISCOUNT RATES AND CAPITAL STRUCTURE
(i) Calculation of cost of debt (Kd), cost of equity (Ke) and weighted average cost of capital
Cost of debt
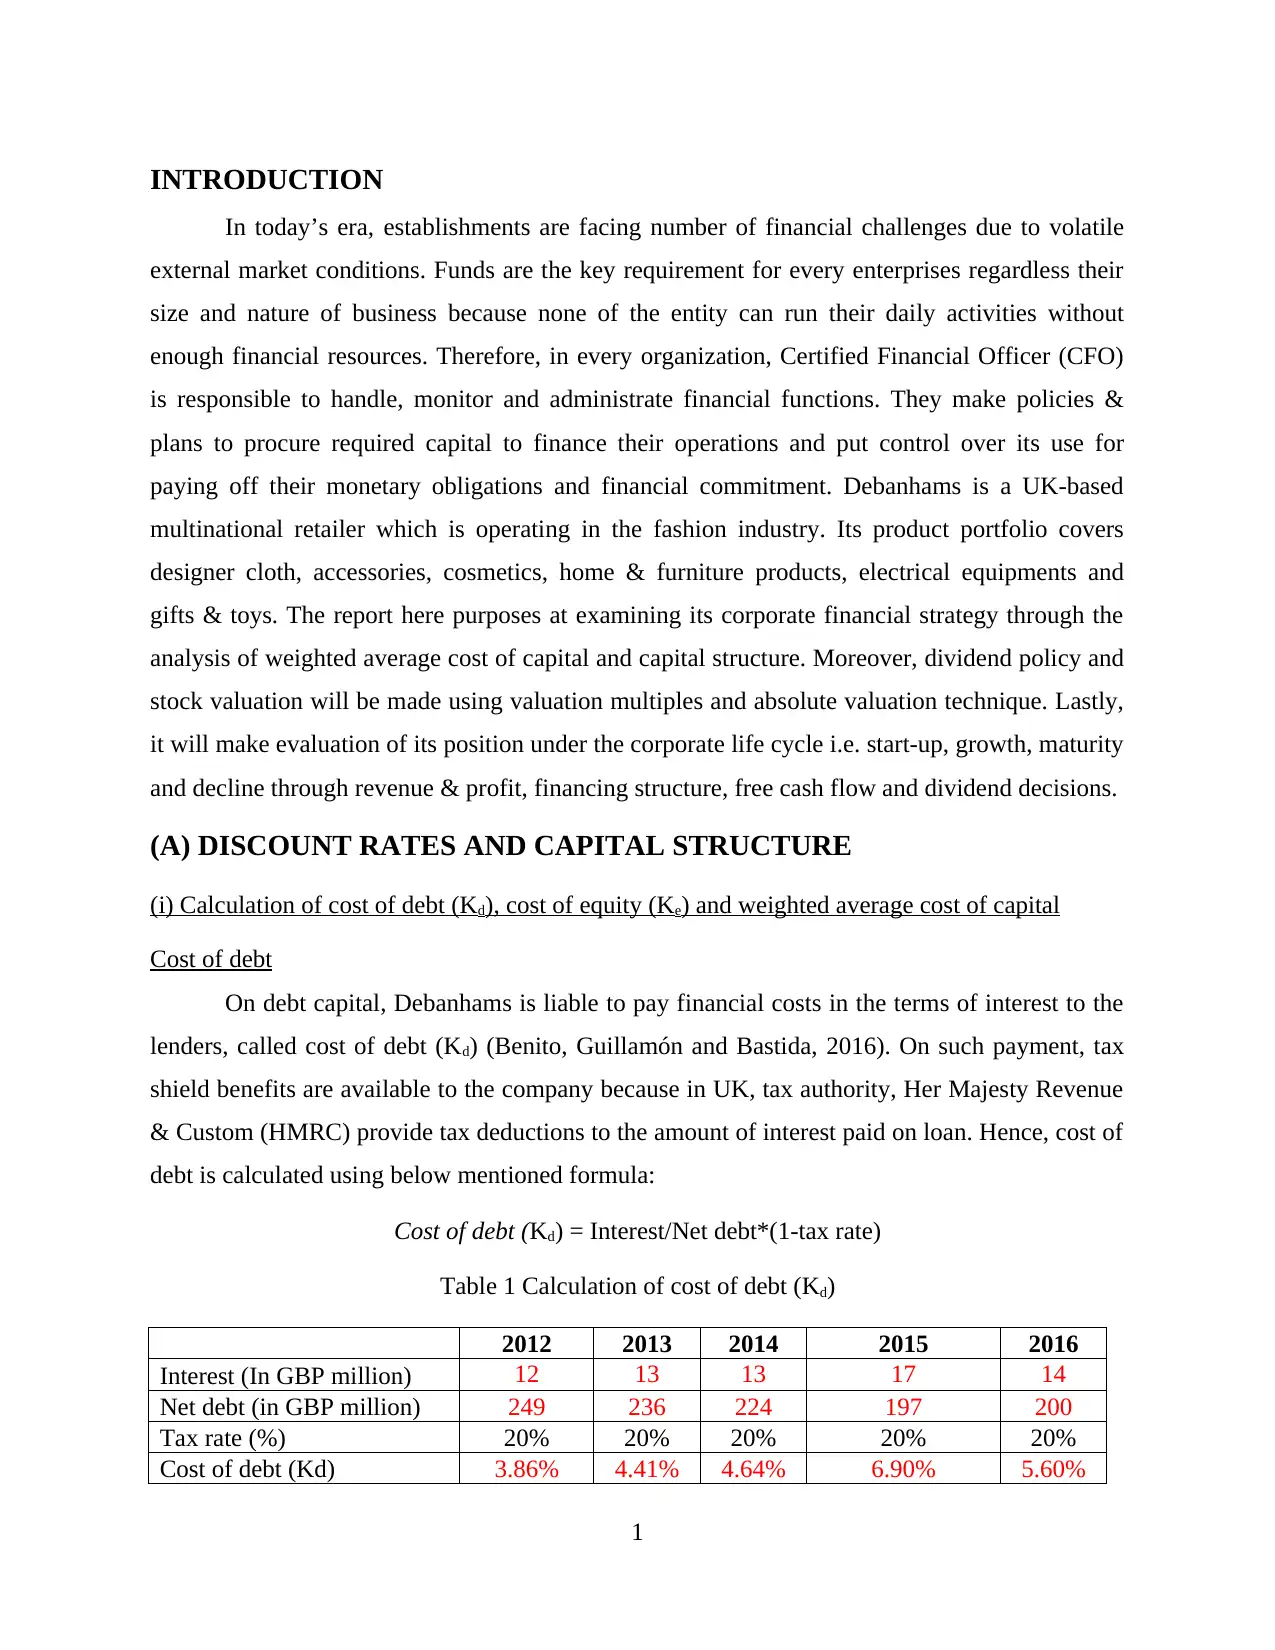
On debt capital, Debanhams is liable to pay financial costs in the terms of interest to the
lenders, called cost of debt (Kd) (Benito, Guillamón and Bastida, 2016). On such payment, tax
shield benefits are available to the company because in UK, tax authority, Her Majesty Revenue
& Custom (HMRC) provide tax deductions to the amount of interest paid on loan. Hence, cost of
debt is calculated using below mentioned formula:
Cost of debt (Kd) = Interest/Net debt*(1-tax rate)
Table 1 Calculation of cost of debt (Kd)
2012 2013 2014 2015 2016
Interest (In GBP million) 12 13 13 17 14
Net debt (in GBP million) 249 236 224 197 200
Tax rate (%) 20% 20% 20% 20% 20%
Cost of debt (Kd) 3.86% 4.41% 4.64% 6.90% 5.60%
1
In today’s era, establishments are facing number of financial challenges due to volatile
external market conditions. Funds are the key requirement for every enterprises regardless their
size and nature of business because none of the entity can run their daily activities without
enough financial resources. Therefore, in every organization, Certified Financial Officer (CFO)
is responsible to handle, monitor and administrate financial functions. They make policies &
plans to procure required capital to finance their operations and put control over its use for
paying off their monetary obligations and financial commitment. Debanhams is a UK-based
multinational retailer which is operating in the fashion industry. Its product portfolio covers
designer cloth, accessories, cosmetics, home & furniture products, electrical equipments and
gifts & toys. The report here purposes at examining its corporate financial strategy through the
analysis of weighted average cost of capital and capital structure. Moreover, dividend policy and
stock valuation will be made using valuation multiples and absolute valuation technique. Lastly,
it will make evaluation of its position under the corporate life cycle i.e. start-up, growth, maturity
and decline through revenue & profit, financing structure, free cash flow and dividend decisions.
(A) DISCOUNT RATES AND CAPITAL STRUCTURE
(i) Calculation of cost of debt (Kd), cost of equity (Ke) and weighted average cost of capital
Cost of debt
On debt capital, Debanhams is liable to pay financial costs in the terms of interest to the
lenders, called cost of debt (Kd) (Benito, Guillamón and Bastida, 2016). On such payment, tax
shield benefits are available to the company because in UK, tax authority, Her Majesty Revenue
& Custom (HMRC) provide tax deductions to the amount of interest paid on loan. Hence, cost of
debt is calculated using below mentioned formula:
Cost of debt (Kd) = Interest/Net debt*(1-tax rate)
Table 1 Calculation of cost of debt (Kd)
2012 2013 2014 2015 2016
Interest (In GBP million) 12 13 13 17 14
Net debt (in GBP million) 249 236 224 197 200
Tax rate (%) 20% 20% 20% 20% 20%
Cost of debt (Kd) 3.86% 4.41% 4.64% 6.90% 5.60%
1
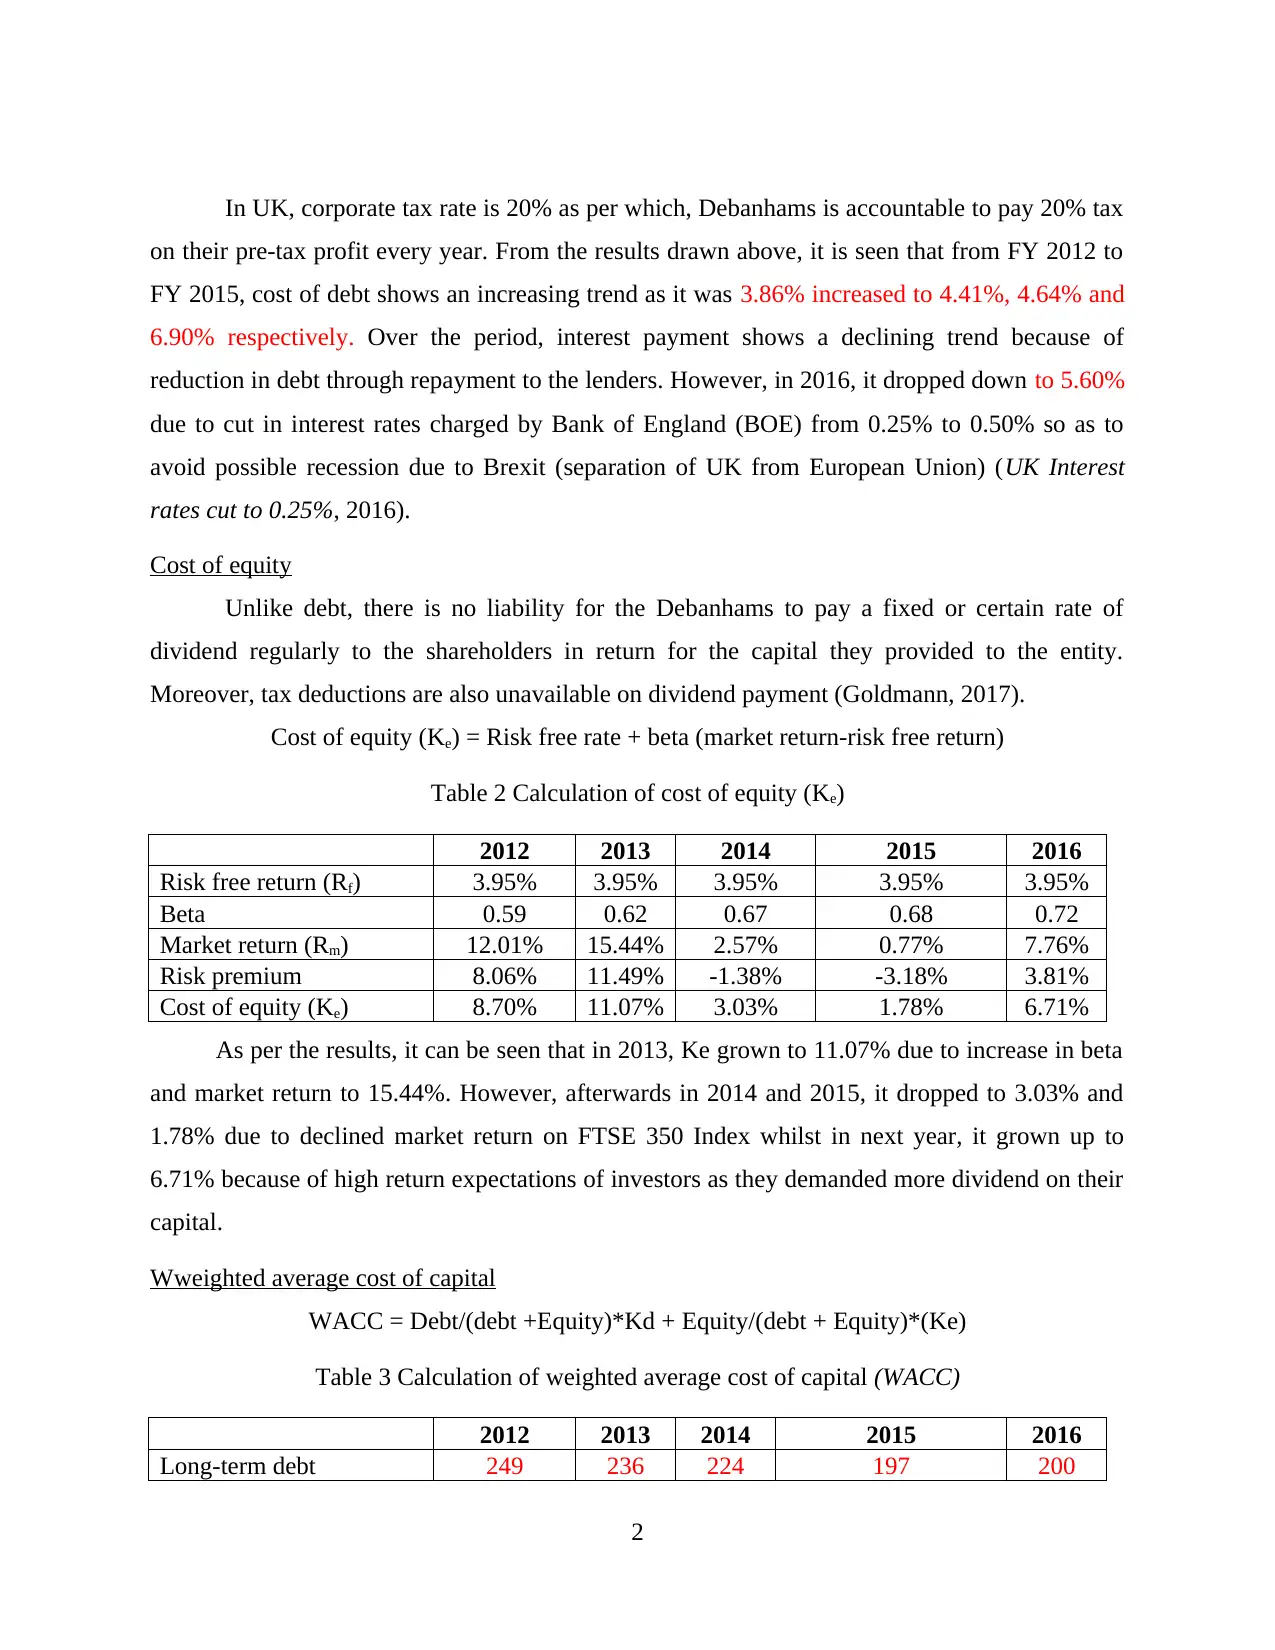
In UK, corporate tax rate is 20% as per which, Debanhams is accountable to pay 20% tax
on their pre-tax profit every year. From the results drawn above, it is seen that from FY 2012 to
FY 2015, cost of debt shows an increasing trend as it was 3.86% increased to 4.41%, 4.64% and
6.90% respectively. Over the period, interest payment shows a declining trend because of
reduction in debt through repayment to the lenders. However, in 2016, it dropped down to 5.60%
due to cut in interest rates charged by Bank of England (BOE) from 0.25% to 0.50% so as to
avoid possible recession due to Brexit (separation of UK from European Union) (UK Interest
rates cut to 0.25%, 2016).
Cost of equity
Unlike debt, there is no liability for the Debanhams to pay a fixed or certain rate of
dividend regularly to the shareholders in return for the capital they provided to the entity.
Moreover, tax deductions are also unavailable on dividend payment (Goldmann, 2017).
Cost of equity (Ke) = Risk free rate + beta (market return-risk free return)
Table 2 Calculation of cost of equity (Ke)
2012 2013 2014 2015 2016
Risk free return (Rf) 3.95% 3.95% 3.95% 3.95% 3.95%
Beta 0.59 0.62 0.67 0.68 0.72
Market return (Rm) 12.01% 15.44% 2.57% 0.77% 7.76%
Risk premium 8.06% 11.49% -1.38% -3.18% 3.81%
Cost of equity (Ke) 8.70% 11.07% 3.03% 1.78% 6.71%
As per the results, it can be seen that in 2013, Ke grown to 11.07% due to increase in beta
and market return to 15.44%. However, afterwards in 2014 and 2015, it dropped to 3.03% and
1.78% due to declined market return on FTSE 350 Index whilst in next year, it grown up to
6.71% because of high return expectations of investors as they demanded more dividend on their
capital.
Wweighted average cost of capital
WACC = Debt/(debt +Equity)*Kd + Equity/(debt + Equity)*(Ke)
Table 3 Calculation of weighted average cost of capital (WACC)
2012 2013 2014 2015 2016
Long-term debt 249 236 224 197 200
2
⊘ This is a preview!⊘
Do you want full access?
Subscribe today to unlock all pages.
Trusted by 1+ million students worldwide
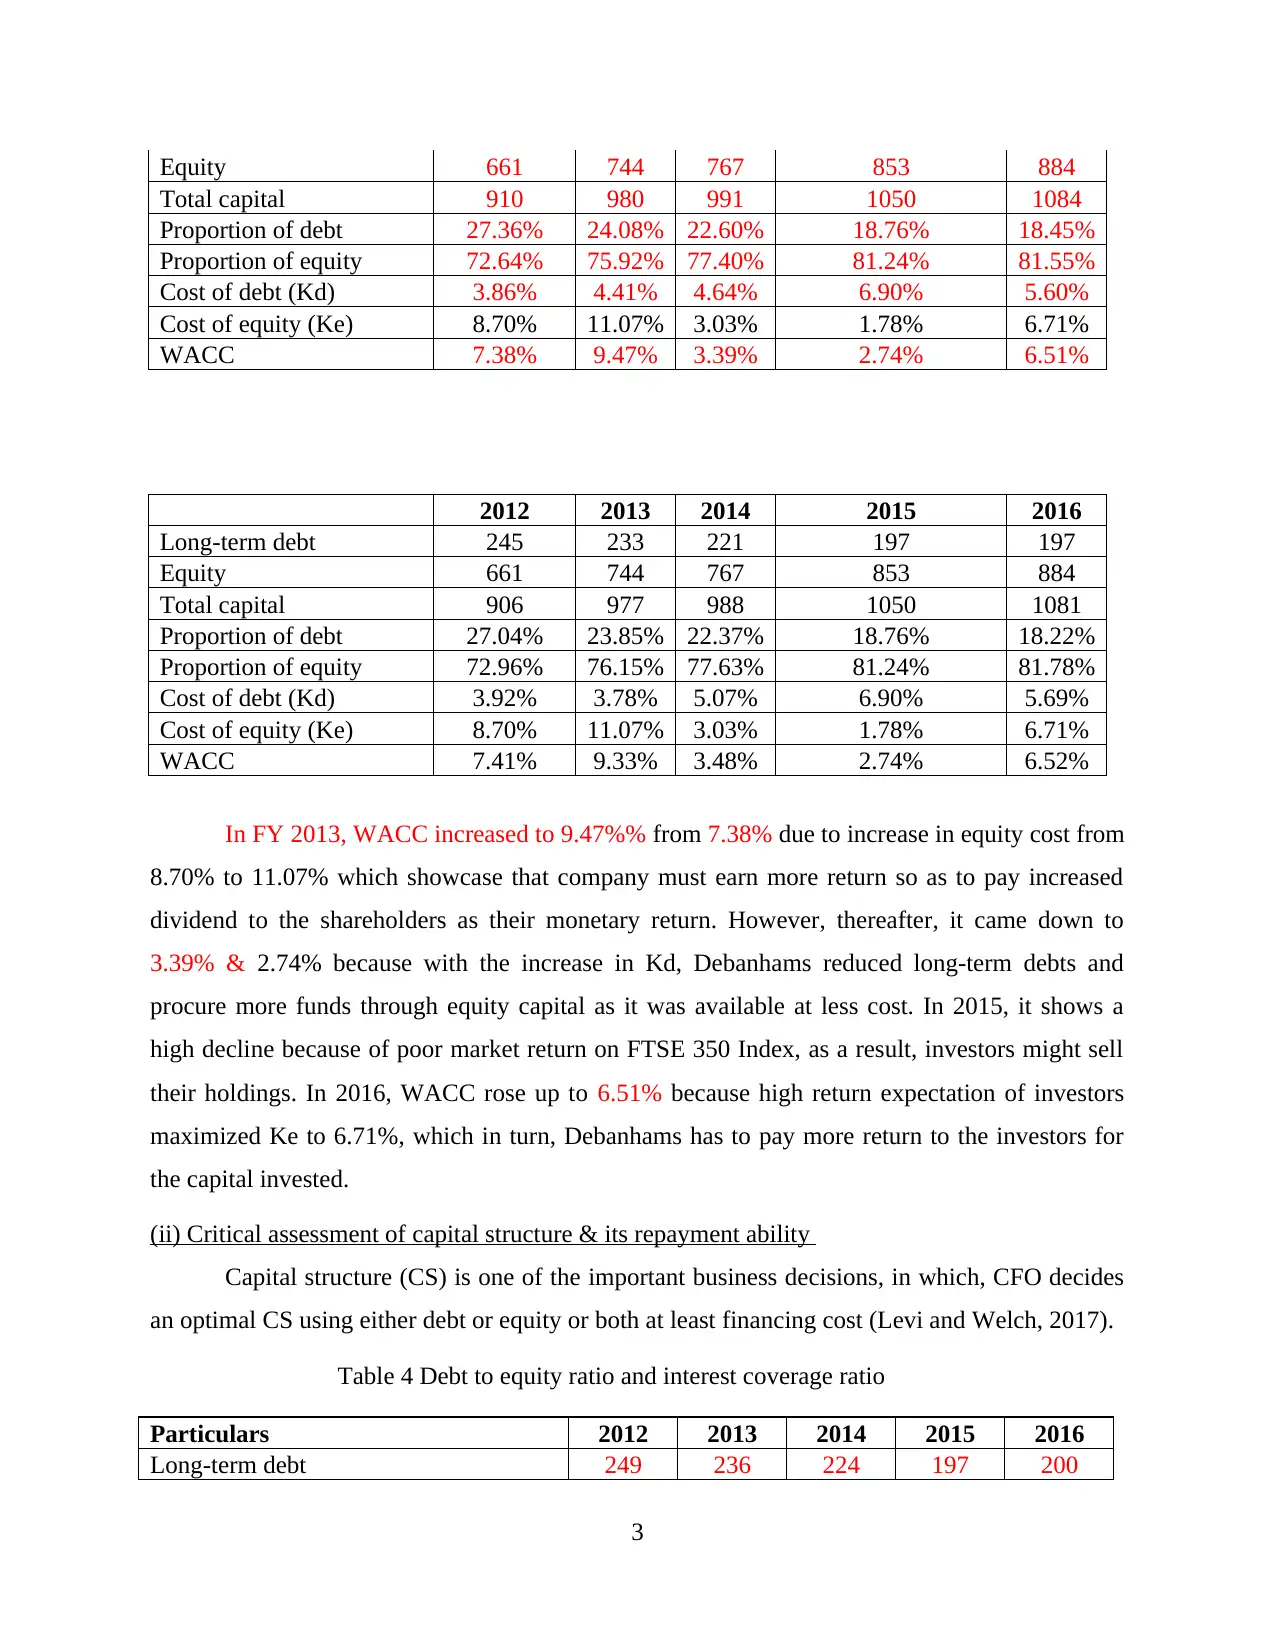
Equity 661 744 767 853 884
Total capital 910 980 991 1050 1084
Proportion of debt 27.36% 24.08% 22.60% 18.76% 18.45%
Proportion of equity 72.64% 75.92% 77.40% 81.24% 81.55%
Cost of debt (Kd) 3.86% 4.41% 4.64% 6.90% 5.60%
Cost of equity (Ke) 8.70% 11.07% 3.03% 1.78% 6.71%
WACC 7.38% 9.47% 3.39% 2.74% 6.51%
2012 2013 2014 2015 2016
Long-term debt 245 233 221 197 197
Equity 661 744 767 853 884
Total capital 906 977 988 1050 1081
Proportion of debt 27.04% 23.85% 22.37% 18.76% 18.22%
Proportion of equity 72.96% 76.15% 77.63% 81.24% 81.78%
Cost of debt (Kd) 3.92% 3.78% 5.07% 6.90% 5.69%
Cost of equity (Ke) 8.70% 11.07% 3.03% 1.78% 6.71%
WACC 7.41% 9.33% 3.48% 2.74% 6.52%
In FY 2013, WACC increased to 9.47%% from 7.38% due to increase in equity cost from
8.70% to 11.07% which showcase that company must earn more return so as to pay increased
dividend to the shareholders as their monetary return. However, thereafter, it came down to
3.39% & 2.74% because with the increase in Kd, Debanhams reduced long-term debts and
procure more funds through equity capital as it was available at less cost. In 2015, it shows a
high decline because of poor market return on FTSE 350 Index, as a result, investors might sell
their holdings. In 2016, WACC rose up to 6.51% because high return expectation of investors
maximized Ke to 6.71%, which in turn, Debanhams has to pay more return to the investors for
the capital invested.
(ii) Critical assessment of capital structure & its repayment ability
Capital structure (CS) is one of the important business decisions, in which, CFO decides
an optimal CS using either debt or equity or both at least financing cost (Levi and Welch, 2017).
Table 4 Debt to equity ratio and interest coverage ratio
Particulars 2012 2013 2014 2015 2016
Long-term debt 249 236 224 197 200
3
Paraphrase This Document
Need a fresh take? Get an instant paraphrase of this document with our AI Paraphraser
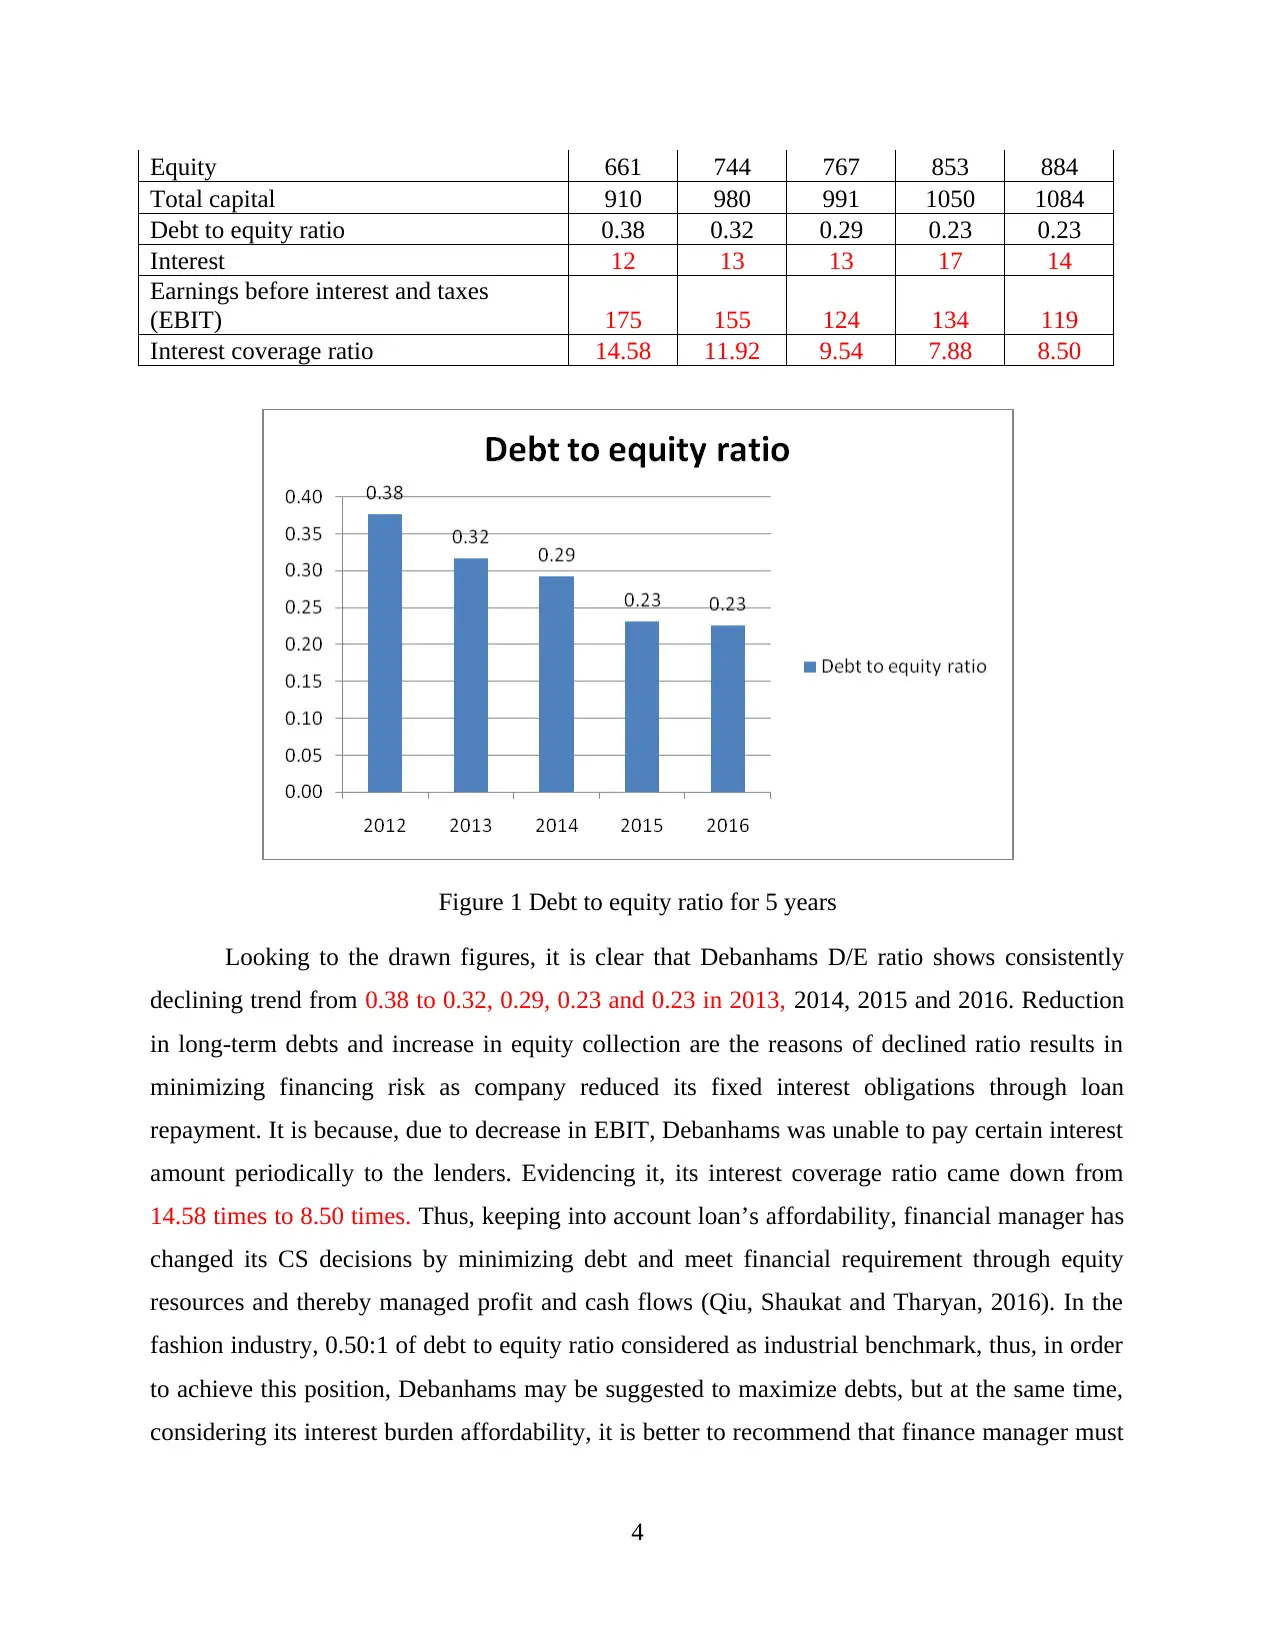
Equity 661 744 767 853 884
Total capital 910 980 991 1050 1084
Debt to equity ratio 0.38 0.32 0.29 0.23 0.23
Interest 12 13 13 17 14
Earnings before interest and taxes
(EBIT) 175 155 124 134 119
Interest coverage ratio 14.58 11.92 9.54 7.88 8.50
Figure 1 Debt to equity ratio for 5 years
Looking to the drawn figures, it is clear that Debanhams D/E ratio shows consistently
declining trend from 0.38 to 0.32, 0.29, 0.23 and 0.23 in 2013, 2014, 2015 and 2016. Reduction
in long-term debts and increase in equity collection are the reasons of declined ratio results in
minimizing financing risk as company reduced its fixed interest obligations through loan
repayment. It is because, due to decrease in EBIT, Debanhams was unable to pay certain interest
amount periodically to the lenders. Evidencing it, its interest coverage ratio came down from
14.58 times to 8.50 times. Thus, keeping into account loan’s affordability, financial manager has
changed its CS decisions by minimizing debt and meet financial requirement through equity
resources and thereby managed profit and cash flows (Qiu, Shaukat and Tharyan, 2016). In the
fashion industry, 0.50:1 of debt to equity ratio considered as industrial benchmark, thus, in order
to achieve this position, Debanhams may be suggested to maximize debts, but at the same time,
considering its interest burden affordability, it is better to recommend that finance manager must
4
look towards maximizing its EBIT to improve interest coverage ratio and thereby gather money
through debt collections for improving its solvency position.
(B) DIVIDEND POLICY
Dividend policies are the guideline that is used by the Debanhams management to make
dividend distribution decisions for the investors (Lundholm and O'keefe, 2011).
(i) Change in dividend over 5 historical years
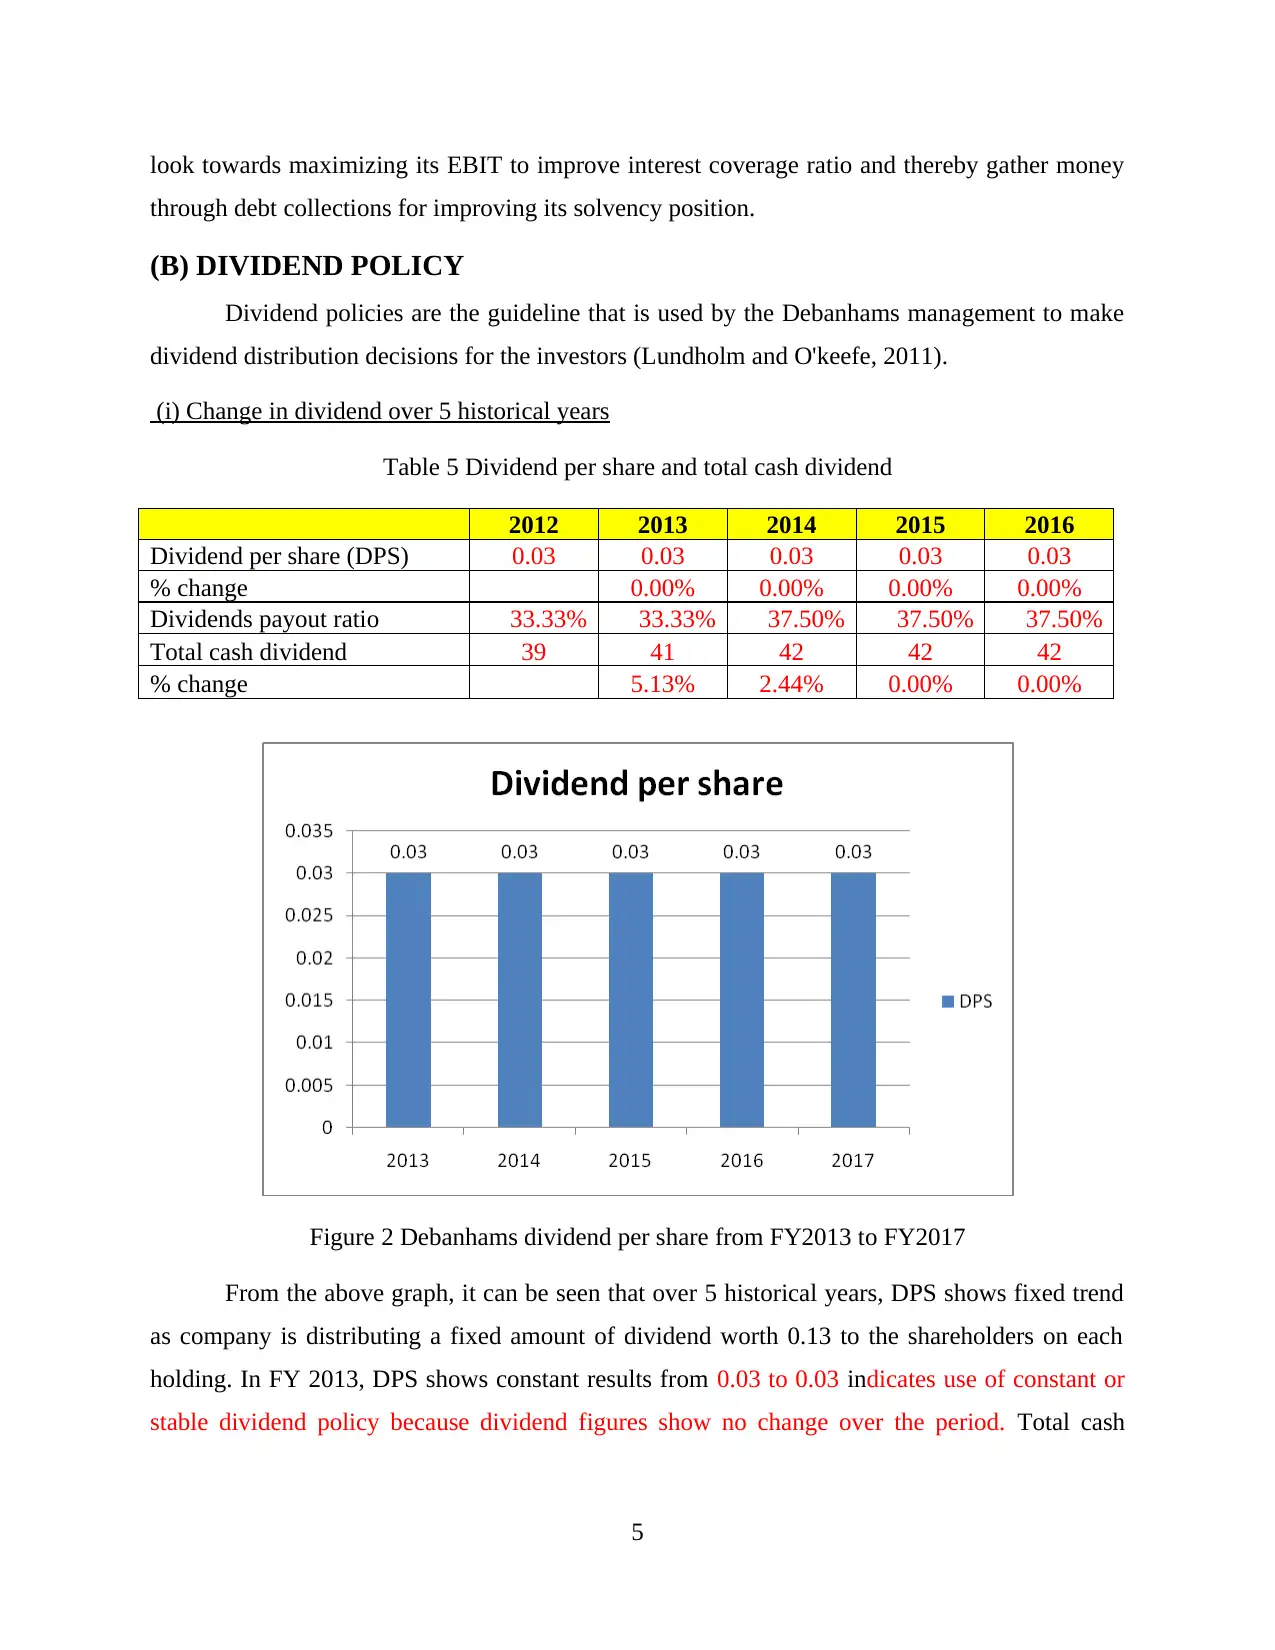
Table 5 Dividend per share and total cash dividend
2012 2013 2014 2015 2016
Dividend per share (DPS) 0.03 0.03 0.03 0.03 0.03
% change 0.00% 0.00% 0.00% 0.00%
Dividends payout ratio 33.33% 33.33% 37.50% 37.50% 37.50%
Total cash dividend 39 41 42 42 42
% change 5.13% 2.44% 0.00% 0.00%
Figure 2 Debanhams dividend per share from FY2013 to FY2017
From the above graph, it can be seen that over 5 historical years, DPS shows fixed trend
as company is distributing a fixed amount of dividend worth 0.13 to the shareholders on each
holding. In FY 2013, DPS shows constant results from 0.03 to 0.03 indicates use of constant or
stable dividend policy because dividend figures show no change over the period. Total cash
5
through debt collections for improving its solvency position.
(B) DIVIDEND POLICY
Dividend policies are the guideline that is used by the Debanhams management to make
dividend distribution decisions for the investors (Lundholm and O'keefe, 2011).
(i) Change in dividend over 5 historical years
Table 5 Dividend per share and total cash dividend
2012 2013 2014 2015 2016
Dividend per share (DPS) 0.03 0.03 0.03 0.03 0.03
% change 0.00% 0.00% 0.00% 0.00%
Dividends payout ratio 33.33% 33.33% 37.50% 37.50% 37.50%
Total cash dividend 39 41 42 42 42
% change 5.13% 2.44% 0.00% 0.00%
Figure 2 Debanhams dividend per share from FY2013 to FY2017
From the above graph, it can be seen that over 5 historical years, DPS shows fixed trend
as company is distributing a fixed amount of dividend worth 0.13 to the shareholders on each
holding. In FY 2013, DPS shows constant results from 0.03 to 0.03 indicates use of constant or
stable dividend policy because dividend figures show no change over the period. Total cash
5
⊘ This is a preview!⊘
Do you want full access?
Subscribe today to unlock all pages.
Trusted by 1+ million students worldwide
dividend in 2013 and 2014 shows £2m and £1m annual increase by 5.13% and 2.44% and
afterwards, it remains constant to £42m.
(ii) Critical assessment of dividend pay-outs
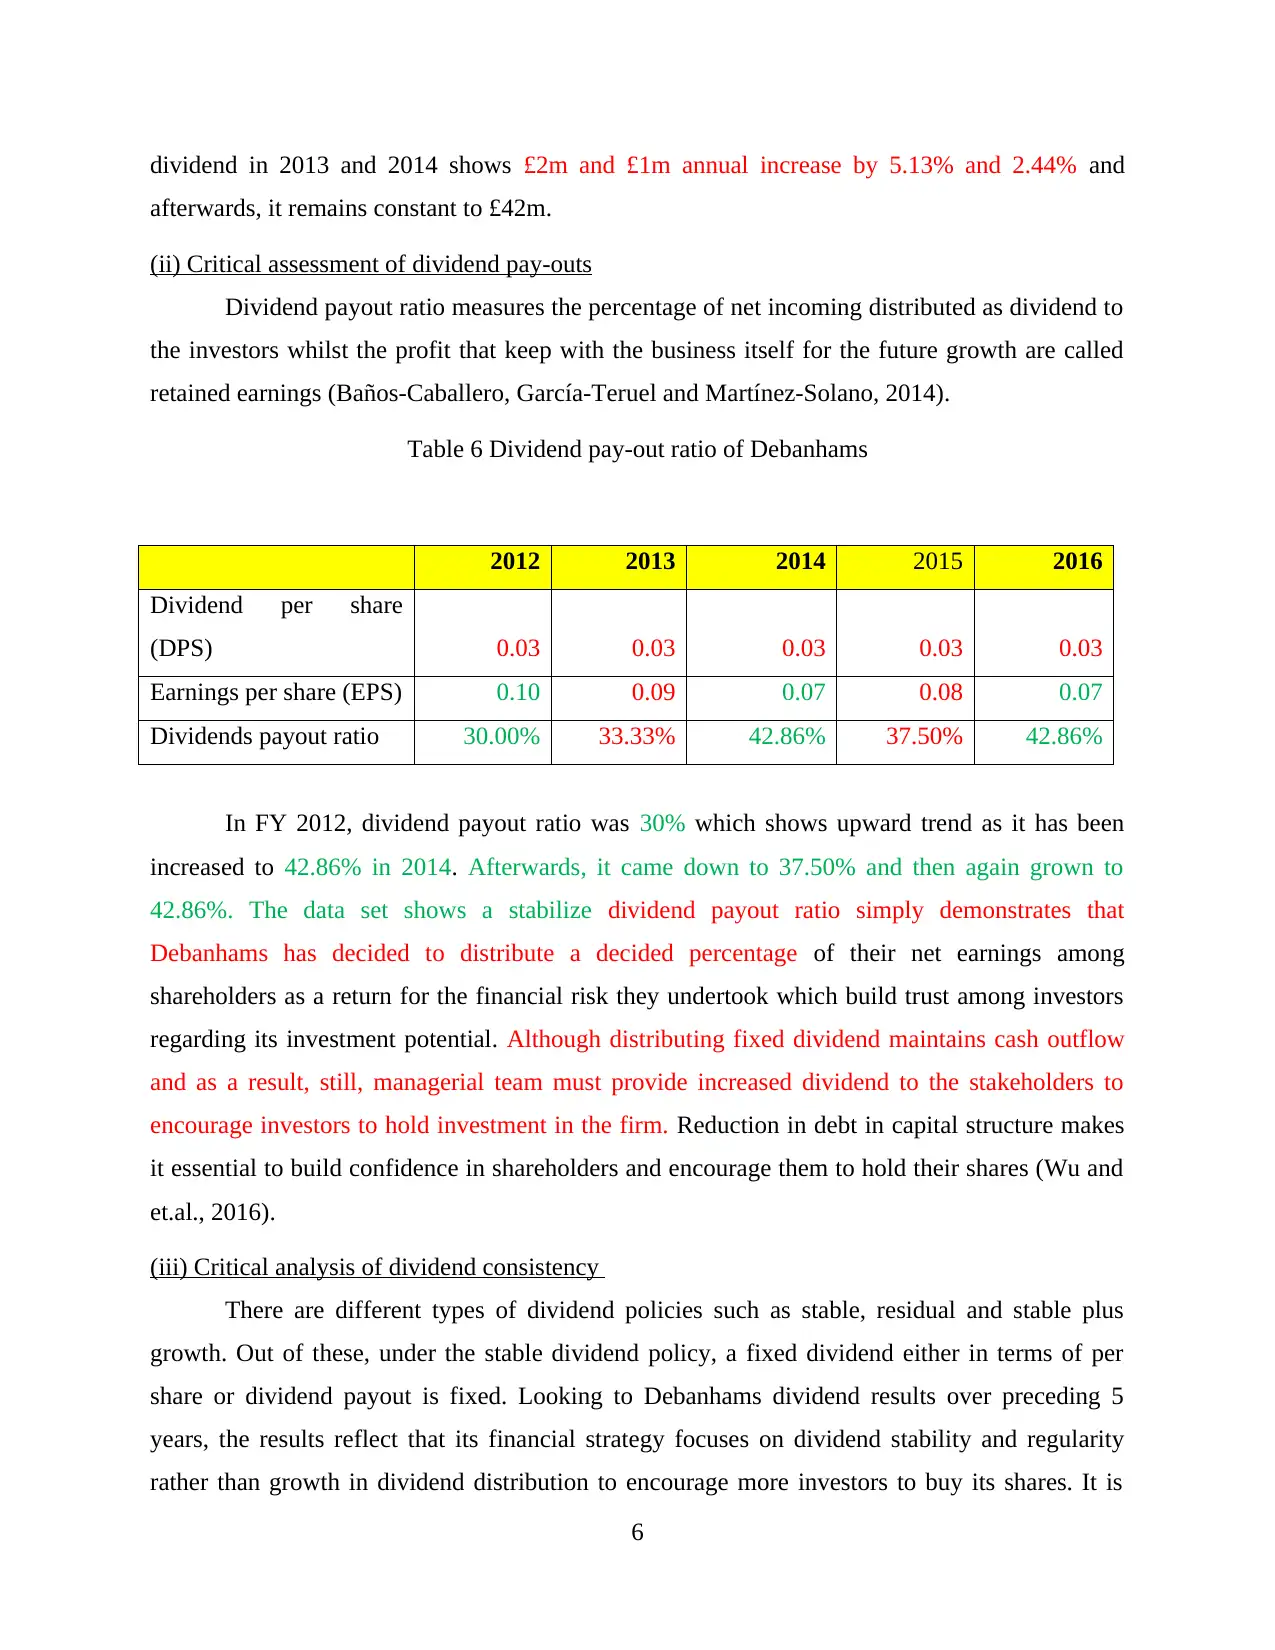
Dividend payout ratio measures the percentage of net incoming distributed as dividend to
the investors whilst the profit that keep with the business itself for the future growth are called
retained earnings (Baños-Caballero, García-Teruel and Martínez-Solano, 2014).
Table 6 Dividend pay-out ratio of Debanhams
2012 2013 2014 2015 2016
Dividend per share
(DPS) 0.03 0.03 0.03 0.03 0.03
Earnings per share (EPS) 0.10 0.09 0.07 0.08 0.07
Dividends payout ratio 30.00% 33.33% 42.86% 37.50% 42.86%
In FY 2012, dividend payout ratio was 30% which shows upward trend as it has been
increased to 42.86% in 2014. Afterwards, it came down to 37.50% and then again grown to
42.86%. The data set shows a stabilize dividend payout ratio simply demonstrates that
Debanhams has decided to distribute a decided percentage of their net earnings among
shareholders as a return for the financial risk they undertook which build trust among investors
regarding its investment potential. Although distributing fixed dividend maintains cash outflow
and as a result, still, managerial team must provide increased dividend to the stakeholders to
encourage investors to hold investment in the firm. Reduction in debt in capital structure makes
it essential to build confidence in shareholders and encourage them to hold their shares (Wu and
et.al., 2016).
(iii) Critical analysis of dividend consistency
There are different types of dividend policies such as stable, residual and stable plus
growth. Out of these, under the stable dividend policy, a fixed dividend either in terms of per
share or dividend payout is fixed. Looking to Debanhams dividend results over preceding 5
years, the results reflect that its financial strategy focuses on dividend stability and regularity
rather than growth in dividend distribution to encourage more investors to buy its shares. It is
6
afterwards, it remains constant to £42m.
(ii) Critical assessment of dividend pay-outs
Dividend payout ratio measures the percentage of net incoming distributed as dividend to
the investors whilst the profit that keep with the business itself for the future growth are called
retained earnings (Baños-Caballero, García-Teruel and Martínez-Solano, 2014).
Table 6 Dividend pay-out ratio of Debanhams
2012 2013 2014 2015 2016
Dividend per share
(DPS) 0.03 0.03 0.03 0.03 0.03
Earnings per share (EPS) 0.10 0.09 0.07 0.08 0.07
Dividends payout ratio 30.00% 33.33% 42.86% 37.50% 42.86%
In FY 2012, dividend payout ratio was 30% which shows upward trend as it has been
increased to 42.86% in 2014. Afterwards, it came down to 37.50% and then again grown to
42.86%. The data set shows a stabilize dividend payout ratio simply demonstrates that
Debanhams has decided to distribute a decided percentage of their net earnings among
shareholders as a return for the financial risk they undertook which build trust among investors
regarding its investment potential. Although distributing fixed dividend maintains cash outflow
and as a result, still, managerial team must provide increased dividend to the stakeholders to
encourage investors to hold investment in the firm. Reduction in debt in capital structure makes
it essential to build confidence in shareholders and encourage them to hold their shares (Wu and
et.al., 2016).
(iii) Critical analysis of dividend consistency
There are different types of dividend policies such as stable, residual and stable plus
growth. Out of these, under the stable dividend policy, a fixed dividend either in terms of per
share or dividend payout is fixed. Looking to Debanhams dividend results over preceding 5
years, the results reflect that its financial strategy focuses on dividend stability and regularity
rather than growth in dividend distribution to encourage more investors to buy its shares. It is
6
Paraphrase This Document
Need a fresh take? Get an instant paraphrase of this document with our AI Paraphraser
because, it pays fixed DPS to the investors at 0.03(3p) at a total cash dividend of £42m. Thus, it
becomes clear that the dividend policy is in line with the payment consistency, in which, a fixed
rate of DPS has paid by the company to the investors to build trust among them (Pfister and
Schwaiger, 2016). This policy has been used because irregularity in distribution lose
shareholders faith in company’s investment potential whereas growth in dividend makes it really
tough for the company to pay high dividend in harder times like in the situation of net loss or
lack of adequate return.
(C) VALUATION
Static valuation multiples
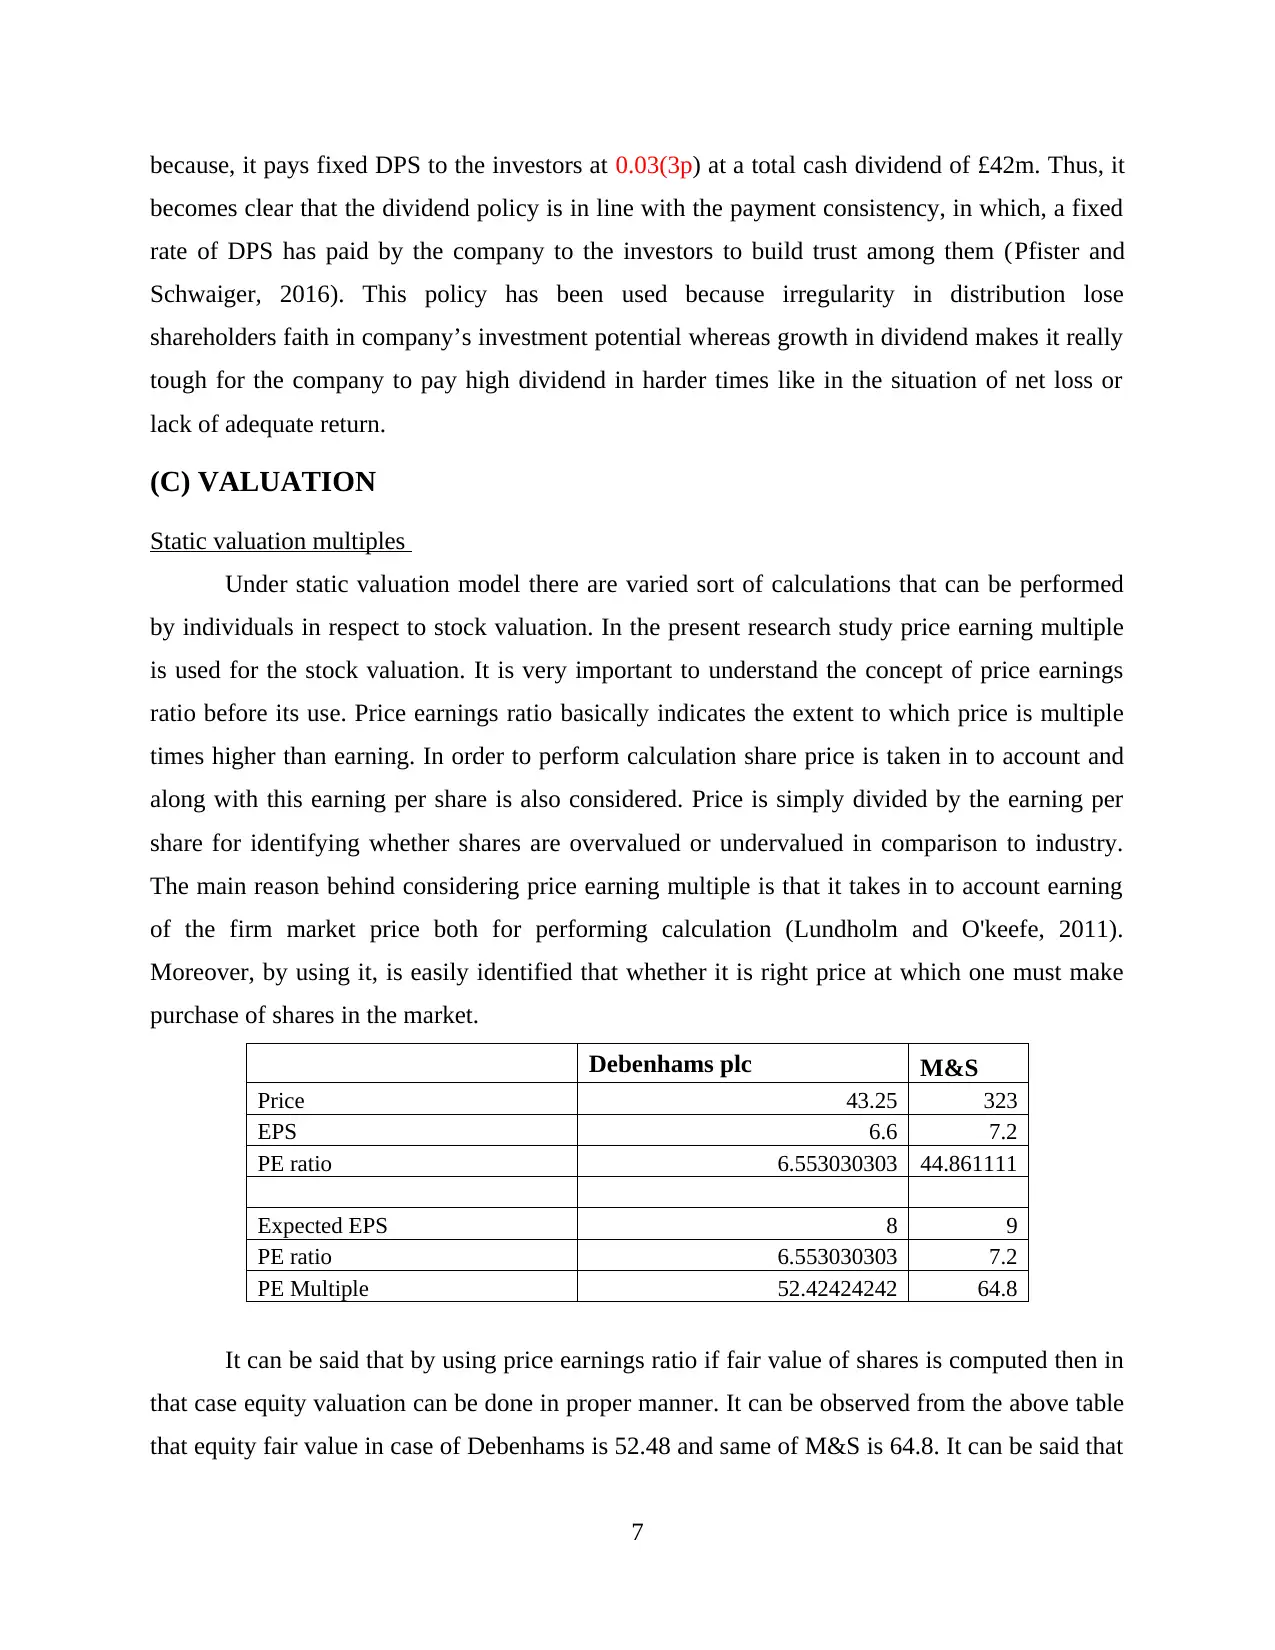
Under static valuation model there are varied sort of calculations that can be performed
by individuals in respect to stock valuation. In the present research study price earning multiple
is used for the stock valuation. It is very important to understand the concept of price earnings
ratio before its use. Price earnings ratio basically indicates the extent to which price is multiple
times higher than earning. In order to perform calculation share price is taken in to account and
along with this earning per share is also considered. Price is simply divided by the earning per
share for identifying whether shares are overvalued or undervalued in comparison to industry.
The main reason behind considering price earning multiple is that it takes in to account earning
of the firm market price both for performing calculation (Lundholm and O'keefe, 2011).
Moreover, by using it, is easily identified that whether it is right price at which one must make
purchase of shares in the market.
Debenhams plc M&S
Price 43.25 323
EPS 6.6 7.2
PE ratio 6.553030303 44.861111
Expected EPS 8 9
PE ratio 6.553030303 7.2
PE Multiple 52.42424242 64.8
It can be said that by using price earnings ratio if fair value of shares is computed then in
that case equity valuation can be done in proper manner. It can be observed from the above table
that equity fair value in case of Debenhams is 52.48 and same of M&S is 64.8. It can be said that
7
becomes clear that the dividend policy is in line with the payment consistency, in which, a fixed
rate of DPS has paid by the company to the investors to build trust among them (Pfister and
Schwaiger, 2016). This policy has been used because irregularity in distribution lose
shareholders faith in company’s investment potential whereas growth in dividend makes it really
tough for the company to pay high dividend in harder times like in the situation of net loss or
lack of adequate return.
(C) VALUATION
Static valuation multiples
Under static valuation model there are varied sort of calculations that can be performed
by individuals in respect to stock valuation. In the present research study price earning multiple
is used for the stock valuation. It is very important to understand the concept of price earnings
ratio before its use. Price earnings ratio basically indicates the extent to which price is multiple
times higher than earning. In order to perform calculation share price is taken in to account and
along with this earning per share is also considered. Price is simply divided by the earning per
share for identifying whether shares are overvalued or undervalued in comparison to industry.
The main reason behind considering price earning multiple is that it takes in to account earning
of the firm market price both for performing calculation (Lundholm and O'keefe, 2011).
Moreover, by using it, is easily identified that whether it is right price at which one must make
purchase of shares in the market.
Debenhams plc M&S
Price 43.25 323
EPS 6.6 7.2
PE ratio 6.553030303 44.861111
Expected EPS 8 9
PE ratio 6.553030303 7.2
PE Multiple 52.42424242 64.8
It can be said that by using price earnings ratio if fair value of shares is computed then in
that case equity valuation can be done in proper manner. It can be observed from the above table
that equity fair value in case of Debenhams is 52.48 and same of M&S is 64.8. It can be said that
7
there is no significant difference between share price of both companies and it can be said that
shares are fairly valued. It can be said that this approach is very useful as task of identifying
value of equity is very easy in case of this method.
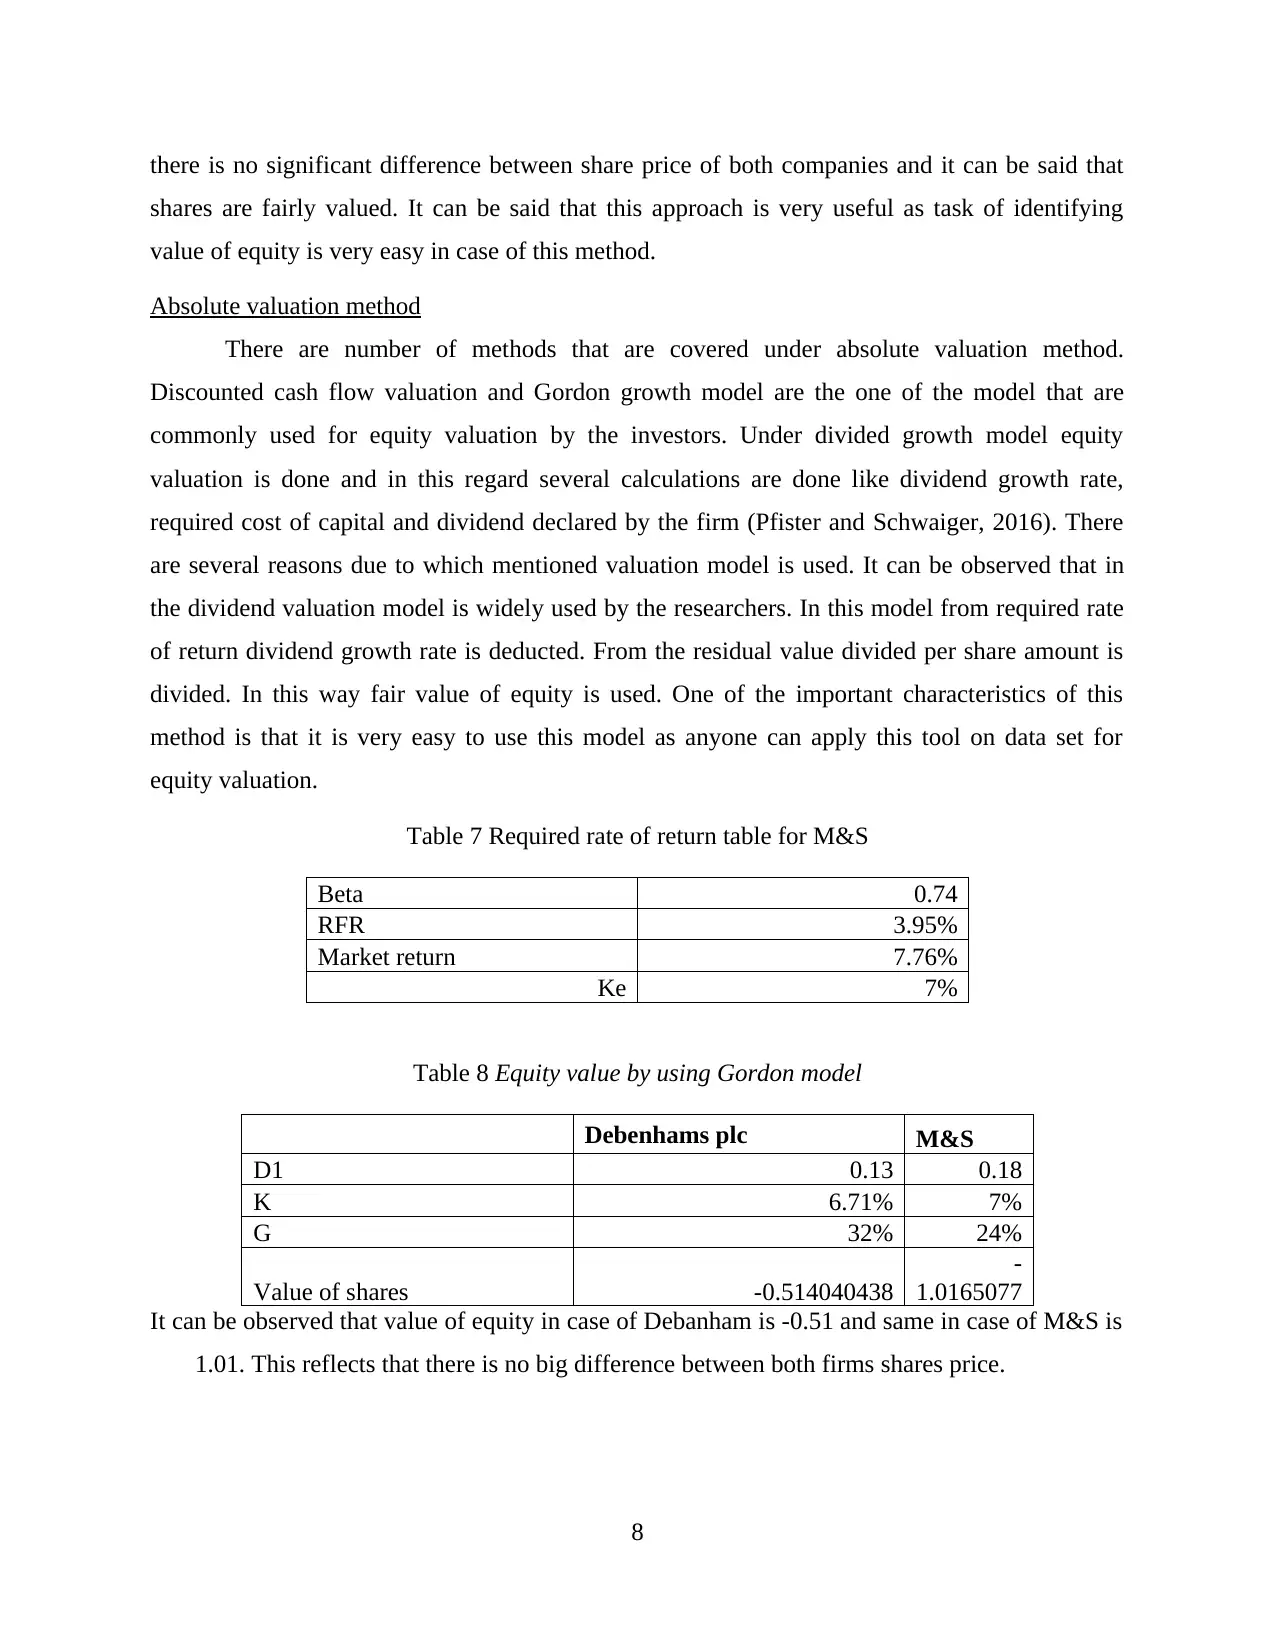
Absolute valuation method
There are number of methods that are covered under absolute valuation method.
Discounted cash flow valuation and Gordon growth model are the one of the model that are
commonly used for equity valuation by the investors. Under divided growth model equity
valuation is done and in this regard several calculations are done like dividend growth rate,
required cost of capital and dividend declared by the firm (Pfister and Schwaiger, 2016). There
are several reasons due to which mentioned valuation model is used. It can be observed that in
the dividend valuation model is widely used by the researchers. In this model from required rate
of return dividend growth rate is deducted. From the residual value divided per share amount is
divided. In this way fair value of equity is used. One of the important characteristics of this
method is that it is very easy to use this model as anyone can apply this tool on data set for
equity valuation.
Table 7 Required rate of return table for M&S
Beta 0.74
RFR 3.95%
Market return 7.76%
Ke 7%
Table 8 Equity value by using Gordon model
Debenhams plc M&S
D1 0.13 0.18
K 6.71% 7%
G 32% 24%
Value of shares -0.514040438
-
1.0165077
It can be observed that value of equity in case of Debanham is -0.51 and same in case of M&S is
1.01. This reflects that there is no big difference between both firms shares price.
8
shares are fairly valued. It can be said that this approach is very useful as task of identifying
value of equity is very easy in case of this method.
Absolute valuation method
There are number of methods that are covered under absolute valuation method.
Discounted cash flow valuation and Gordon growth model are the one of the model that are
commonly used for equity valuation by the investors. Under divided growth model equity
valuation is done and in this regard several calculations are done like dividend growth rate,
required cost of capital and dividend declared by the firm (Pfister and Schwaiger, 2016). There
are several reasons due to which mentioned valuation model is used. It can be observed that in
the dividend valuation model is widely used by the researchers. In this model from required rate
of return dividend growth rate is deducted. From the residual value divided per share amount is
divided. In this way fair value of equity is used. One of the important characteristics of this
method is that it is very easy to use this model as anyone can apply this tool on data set for
equity valuation.
Table 7 Required rate of return table for M&S
Beta 0.74
RFR 3.95%
Market return 7.76%
Ke 7%
Table 8 Equity value by using Gordon model
Debenhams plc M&S
D1 0.13 0.18
K 6.71% 7%
G 32% 24%
Value of shares -0.514040438
-
1.0165077
It can be observed that value of equity in case of Debanham is -0.51 and same in case of M&S is
1.01. This reflects that there is no big difference between both firms shares price.
8
⊘ This is a preview!⊘
Do you want full access?
Subscribe today to unlock all pages.
Trusted by 1+ million students worldwide
1 out of 24
Related Documents


Your All-in-One AI-Powered Toolkit for Academic Success.
+13062052269
info@desklib.com
Available 24*7 on WhatsApp / Email
![[object Object]](/_next/static/media/star-bottom.7253800d.svg)
Unlock your academic potential
Copyright © 2020–2026 A2Z Services. All Rights Reserved. Developed and managed by ZUCOL.