Debenhams Plc: Corporate Finance and Financial Investment Decisions
VerifiedAdded on 2023/06/10
|18
|3811
|468
Report
AI Summary
This report assesses Debenhams Plc's financial performance and investment decisions over the past five years, focusing on shareholder value. It includes an EVA analysis revealing value creation despite challenges like high financial leverage. The report also analyzes the total shareholder return, considering factors like net profit margin, return on equity, and share price movements, comparing Debenhams' performance with Mark and Spenser. The analysis indicates a decrease in profitability and return on equity for Debenhams, impacting shareholder returns, while also highlighting an increase in asset turnover. The report concludes by discussing net asset value and the impact of financial leverage on the company's overall performance, offering insights into the financial health and investment attractiveness of Debenhams Plc.
Debenhams Plc
Financial investment decision
Corporate finance Assignment
Name of the Student-
Financial investment decision
Corporate finance Assignment
Name of the Student-
Paraphrase This Document
Need a fresh take? Get an instant paraphrase of this document with our AI Paraphraser
Executive Summary
With the ramified changes in economic, every organization needs to endeavor toward
providing the possible benefits to its stakeholders. The main objective of company is to
deliver the best possible value to its shareholders. The Debenhams plc is the international
company which has been running its busienss at the international level. However, Debenhams
plc has created value on its investment and provided good amount to its shareholders since
last five years. Company has been facing high financial leverage due to the high debt funding
in its business.
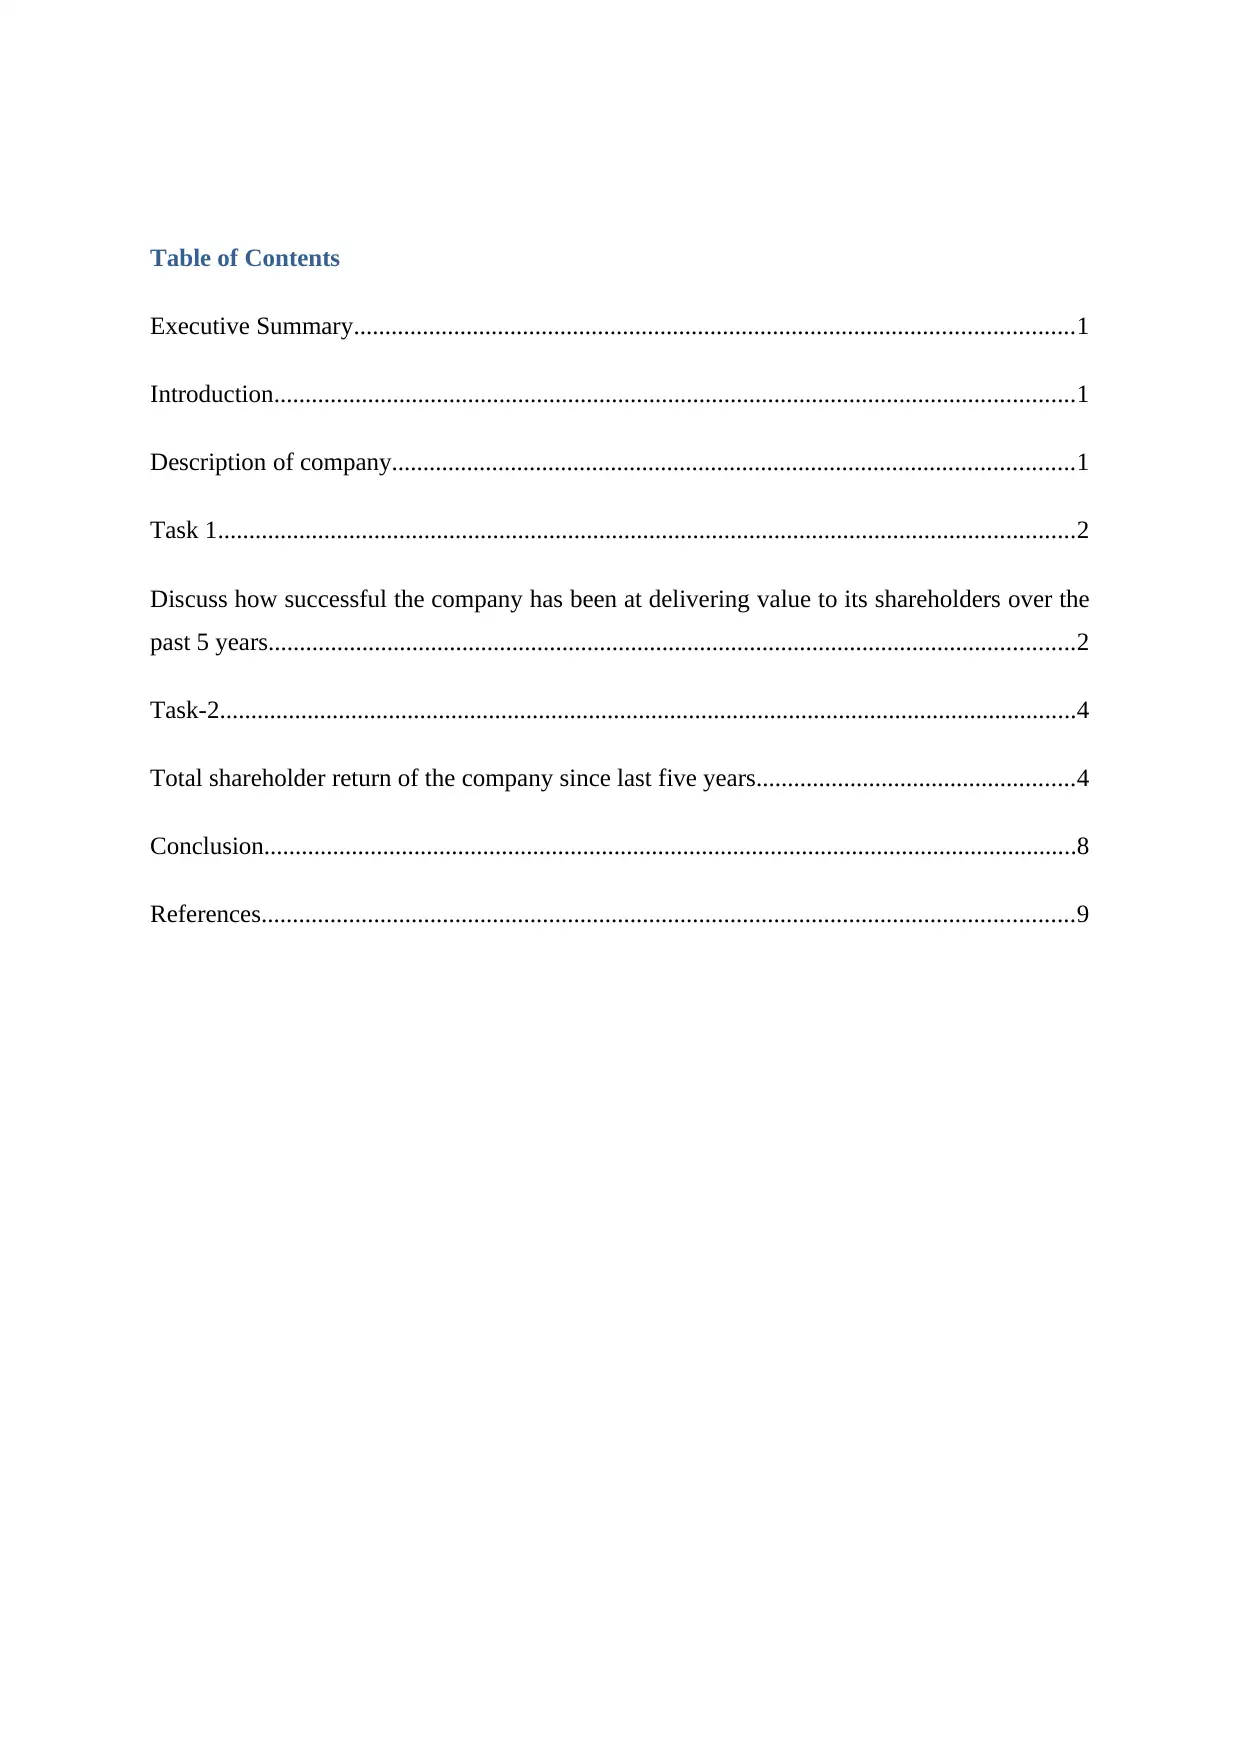
Table of Contents
Executive Summary...................................................................................................................1
Introduction................................................................................................................................1
Description of company.............................................................................................................1
Task 1.........................................................................................................................................2
Discuss how successful the company has been at delivering value to its shareholders over the
past 5 years.................................................................................................................................2
Task-2.........................................................................................................................................4
Total shareholder return of the company since last five years...................................................4
Conclusion..................................................................................................................................8
References..................................................................................................................................9
⊘ This is a preview!⊘
Do you want full access?
Subscribe today to unlock all pages.
Trusted by 1+ million students worldwide
Introduction
Each and every organization needs to take proper steps which could add value for the
invested capital of the shareholders. This report has been prepared in relation to Debenhams
plc to determine whether company has delivered required benefits either in monetary and
non-monetary terms to its shareholders. In this report, EVA analysis of Debenhams plc is
made to identify economic value added to its shareholders. After that, by analyzing the
financial information of company, total shareholder return of the company for the past 5
years including key events and its comparison with the appreciate standard company has been
done (Sriram, 2018). In the end, proper judgment and recommendation have been given in
the context of financial performance of company.
Description of company
It is a British multinational company indulged in retail operating activities and it has
several departmental stores in United Kingdom with its several franchises and stores.
Currently, stock price of company is traded DEB (LON) 12.75 GBX +0.79 (+6.61%). The
last year revenue of company in 2017 was 234.17 billion GBP (2017) which is 12% higher as
compared to last three year data (Debenhams plc.2017).
Task 1
Discuss how successful the company has been at delivering value to its shareholders
over the past 5 years
It is analyzed that company has negative return on equity which divulges that
company has failed to create value on its investment (Goldstein, Jiang, and Ng, 2017). The
profitability of company has decreased throughout the time which has also decreased the
value of its profitability. In order to assess how company has been successful in delivering
value to its shareholders over the past five year, economic value added tool could be used
(Lei, Qiu, and Wan, 2018).
Evaluation of company by using Economic value added analysis
The economic value added is a tool for assessing the amount of value created by the
company. It assists shareholders and other investors to determine how much value company
Paraphrase This Document
Need a fresh take? Get an instant paraphrase of this document with our AI Paraphraser
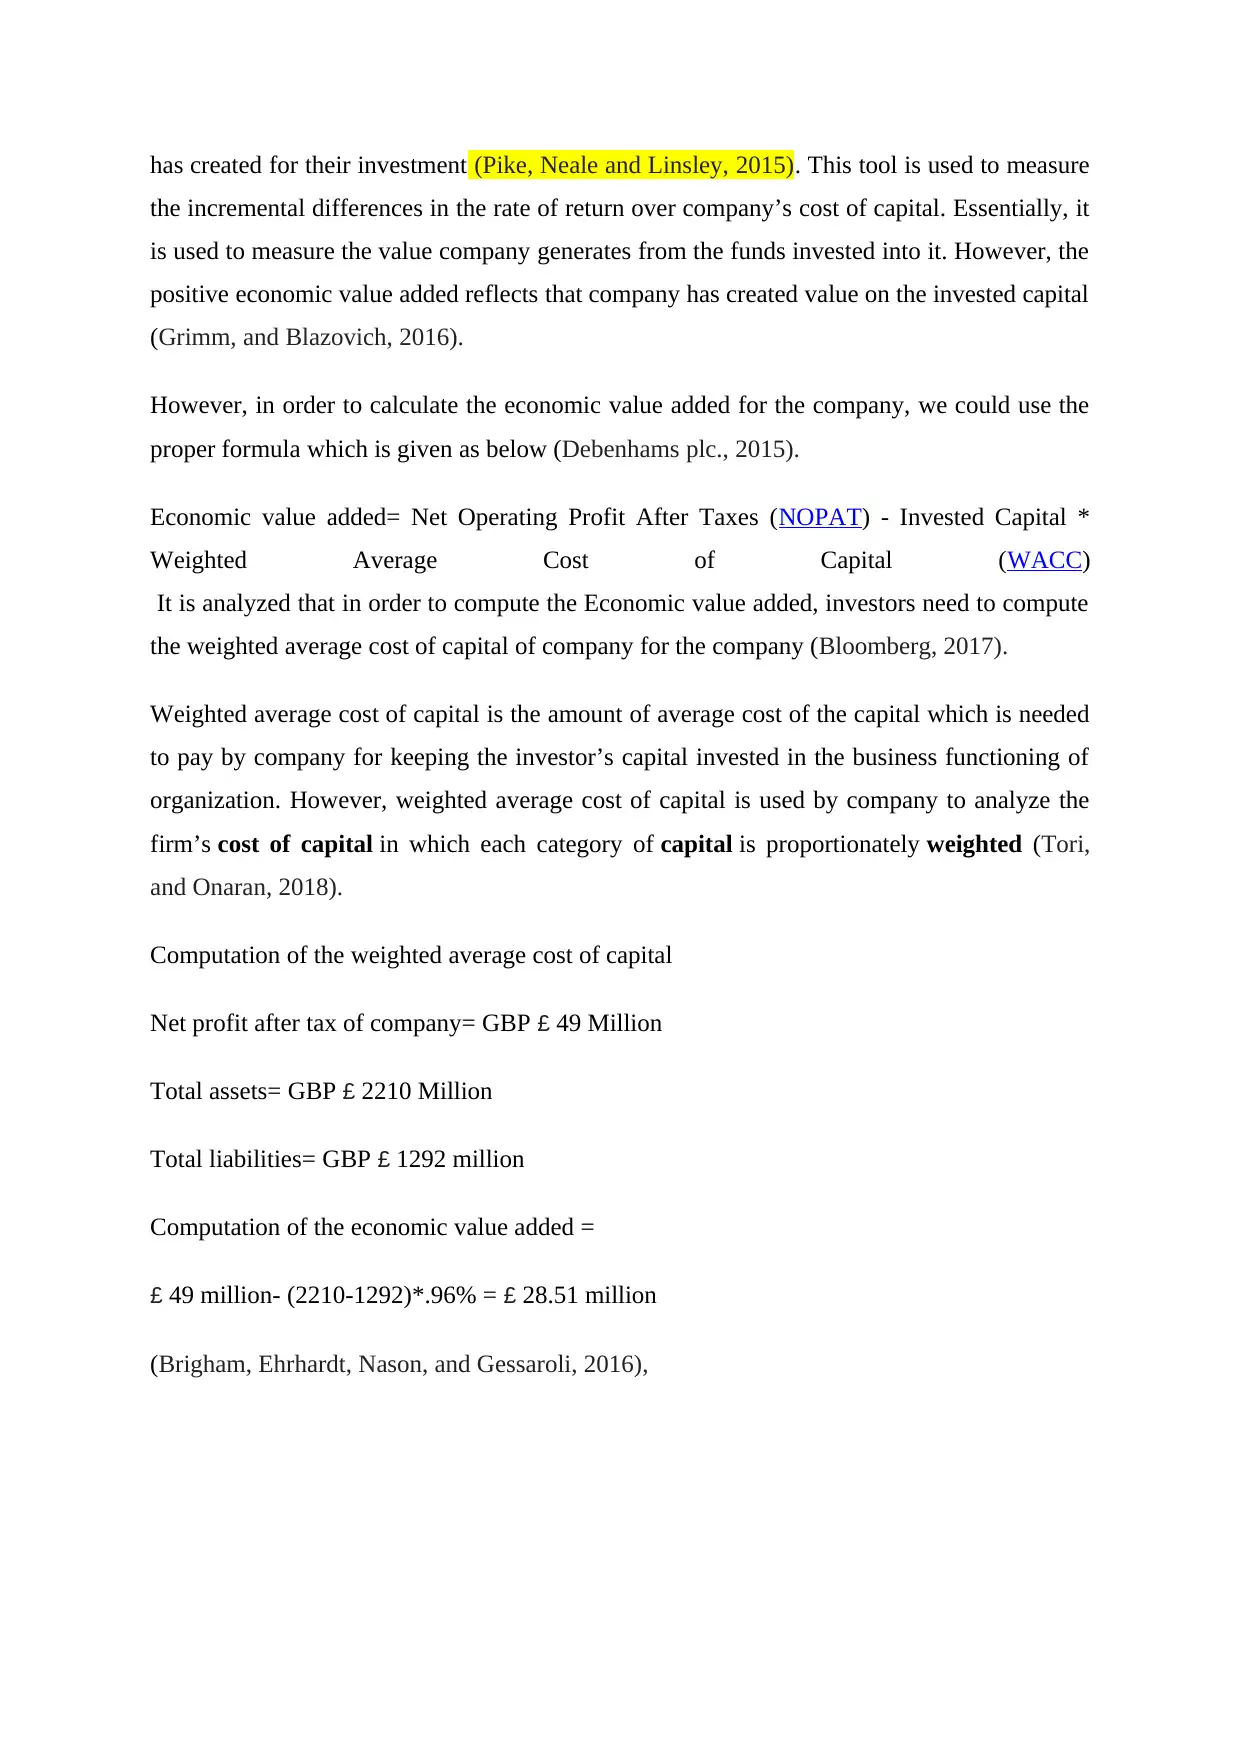
has created for their investment (Pike, Neale and Linsley, 2015). This tool is used to measure
the incremental differences in the rate of return over company’s cost of capital. Essentially, it
is used to measure the value company generates from the funds invested into it. However, the
positive economic value added reflects that company has created value on the invested capital
(Grimm, and Blazovich, 2016).
However, in order to calculate the economic value added for the company, we could use the
proper formula which is given as below (Debenhams plc., 2015).
Economic value added= Net Operating Profit After Taxes (NOPAT) - Invested Capital *
Weighted Average Cost of Capital (WACC)
It is analyzed that in order to compute the Economic value added, investors need to compute
the weighted average cost of capital of company for the company (Bloomberg, 2017).
Weighted average cost of capital is the amount of average cost of the capital which is needed
to pay by company for keeping the investor’s capital invested in the business functioning of
organization. However, weighted average cost of capital is used by company to analyze the
firm’s cost of capital in which each category of capital is proportionately weighted (Tori,
and Onaran, 2018).
Computation of the weighted average cost of capital
Net profit after tax of company= GBP £ 49 Million
Total assets= GBP £ 2210 Million
Total liabilities= GBP £ 1292 million
Computation of the economic value added =
£ 49 million- (2210-1292)*.96% = £ 28.51 million
(Brigham, Ehrhardt, Nason, and Gessaroli, 2016),
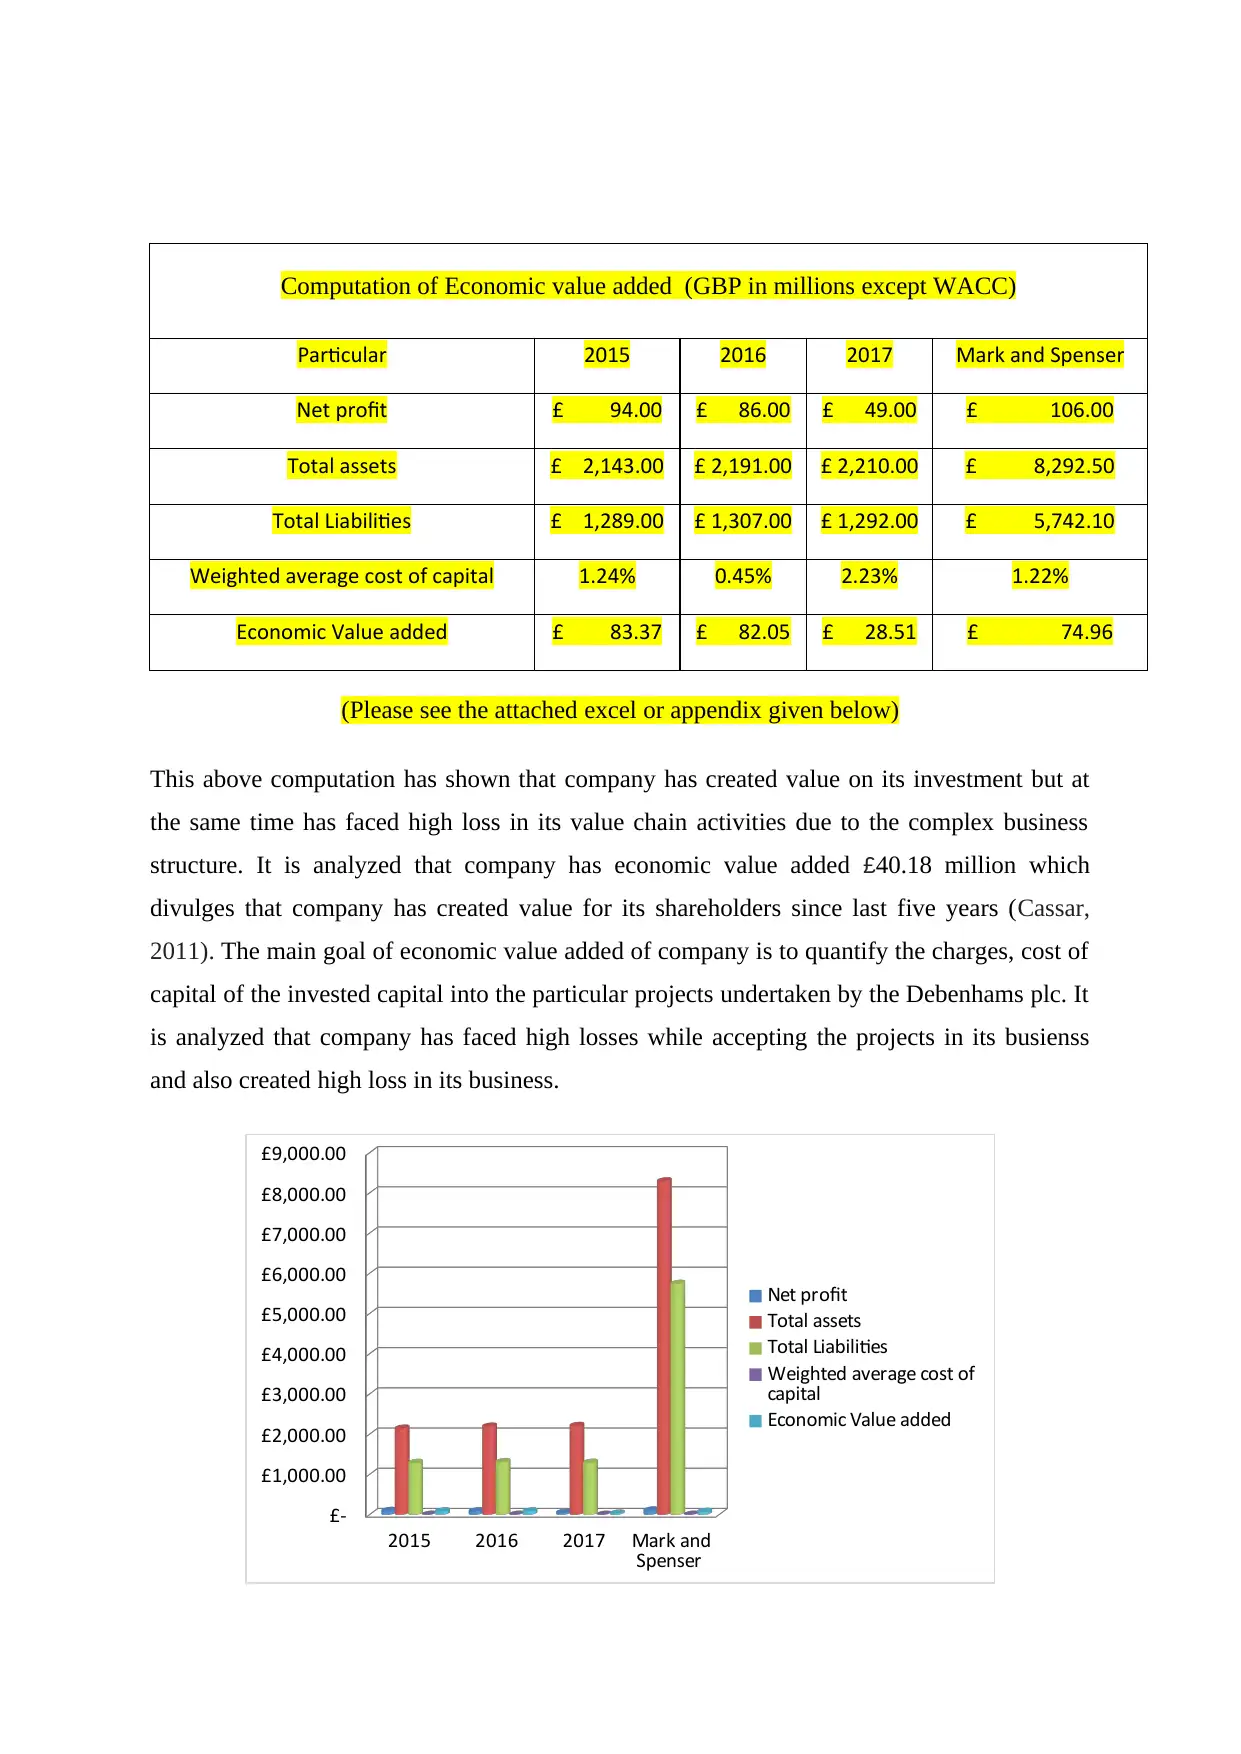
Computation of Economic value added (GBP in millions except WACC)
Particular 2015 2016 2017 Mark and Spenser
Net profit £ 94.00 £ 86.00 £ 49.00 £ 106.00
Total assets £ 2,143.00 £ 2,191.00 £ 2,210.00 £ 8,292.50
Total Liabilities £ 1,289.00 £ 1,307.00 £ 1,292.00 £ 5,742.10
Weighted average cost of capital 1.24% 0.45% 2.23% 1.22%
Economic Value added £ 83.37 £ 82.05 £ 28.51 £ 74.96
(Please see the attached excel or appendix given below)
This above computation has shown that company has created value on its investment but at
the same time has faced high loss in its value chain activities due to the complex business
structure. It is analyzed that company has economic value added £40.18 million which
divulges that company has created value for its shareholders since last five years (Cassar,
2011). The main goal of economic value added of company is to quantify the charges, cost of
capital of the invested capital into the particular projects undertaken by the Debenhams plc. It
is analyzed that company has faced high losses while accepting the projects in its busienss
and also created high loss in its business.
2015 2016 2017 Mark and
Spenser
£-
£1,000.00
£2,000.00
£3,000.00
£4,000.00
£5,000.00
£6,000.00
£7,000.00
£8,000.00
£9,000.00
Net profit
Total assets
Total Liabilities
Weighted average cost of
capital
Economic Value added
⊘ This is a preview!⊘
Do you want full access?
Subscribe today to unlock all pages.
Trusted by 1+ million students worldwide
The positive economic value added has reflected that Debenhams plc has created value on its
all the invested capital and delivered positive results for its shareholders (Acharya, and Xu,
2017). Company has profitable busienss and wealth of the organization has been increased
with the increase in its overall profit. However, the main reason of profitable busienss and
positive EVA of Debenhams plc has been possible as company has very less tangible assets
such as technologies and research and development department. In 2013, company had
£120.84 million which has decreased to £39.25 million in 2017 (Debenhams plc., 2016).
Task-2
Total shareholder return of the company since last five years
It is analyzed that total shareholders return of the company is based on the earning per share
and net profit earned by company. It could be defined as benefits and other capital gain to
shareholders which could add value to shareholders capital. Total shareholder return is the
internal rate of return of all the cash flow of the investors during the holding period of an
investment (Véron, and Wolff, 2016). It could be determined as total amount of returned to
investors. In this case, Debenhams plc has lower down its total shareholder return due to the
decrease amount of profitability. In order to calculate the total shareholder return, firstly
analysis would be made on the dividends received during the time of the shareholders
ownerships (Debenhams plc., 2017).
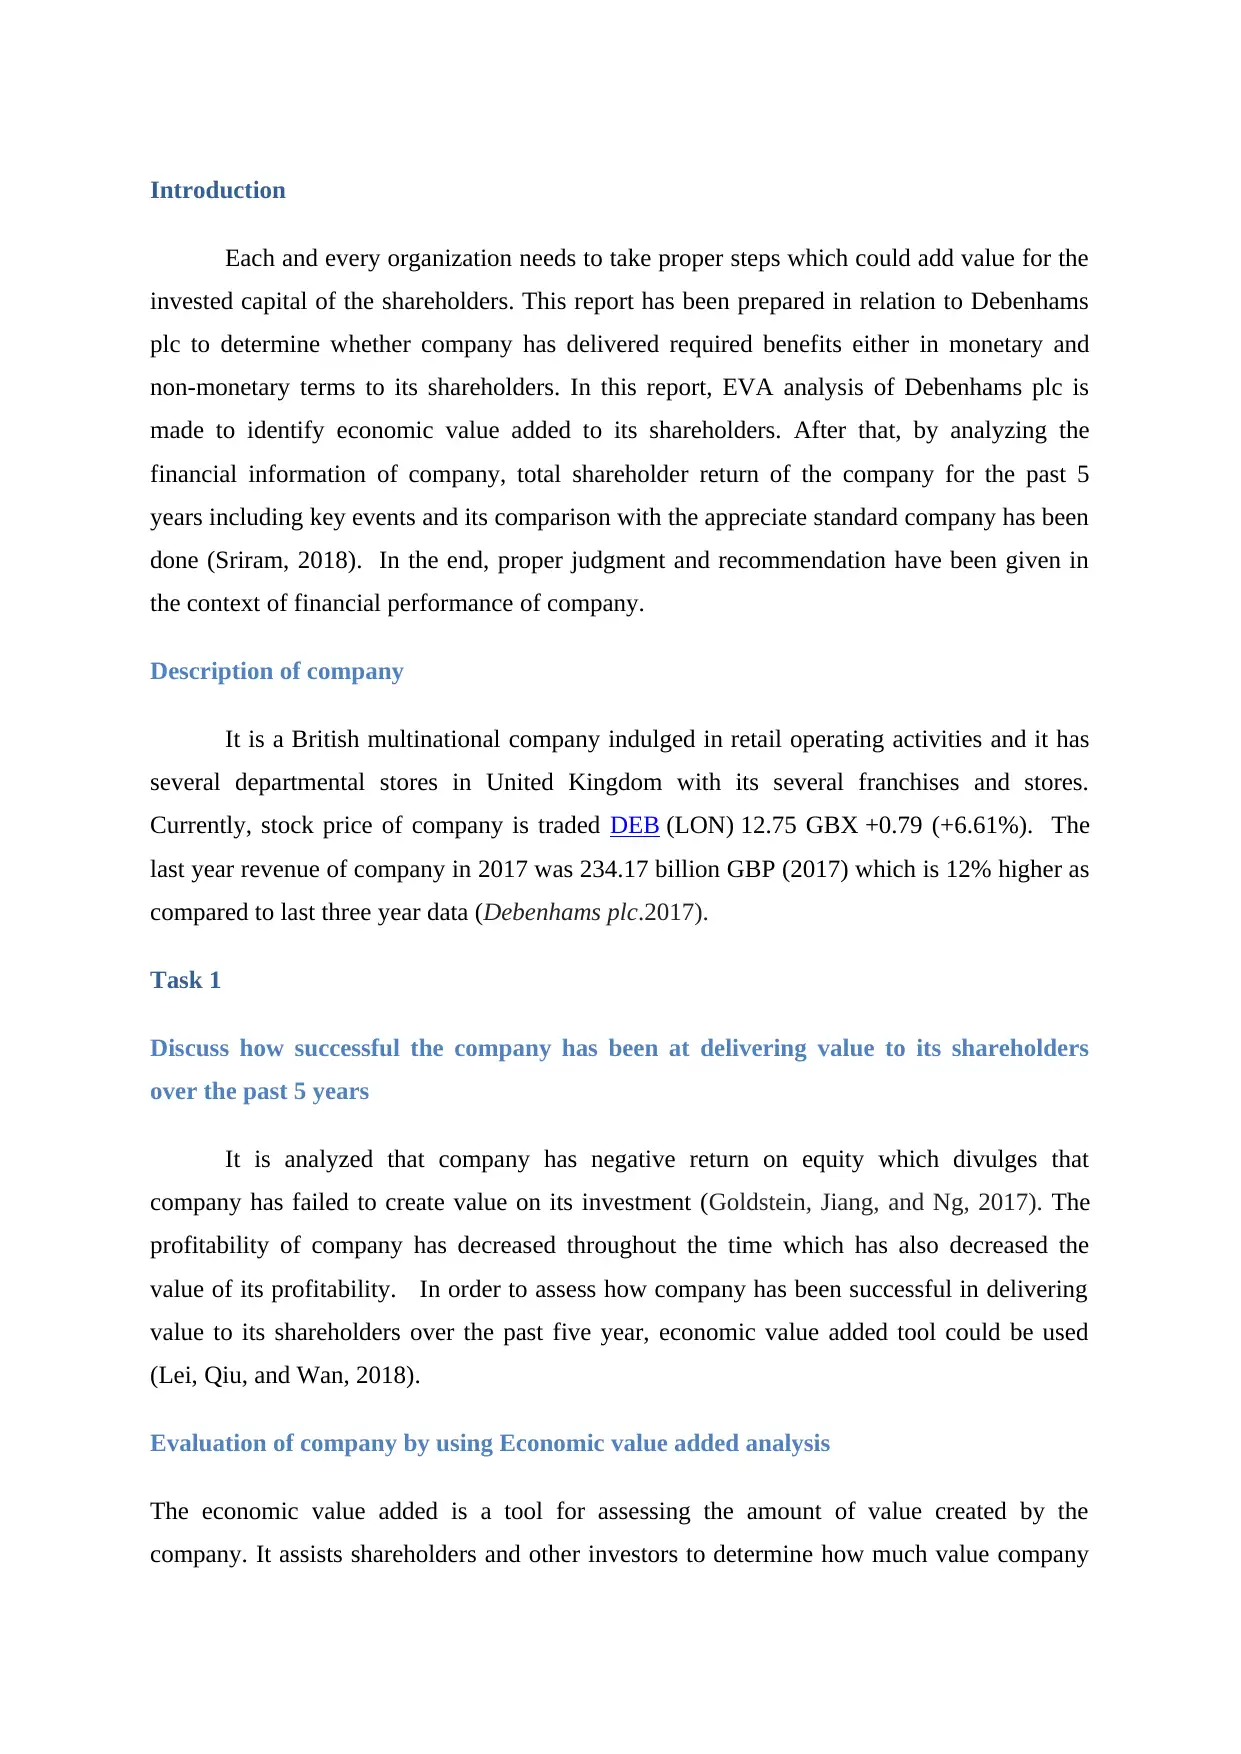
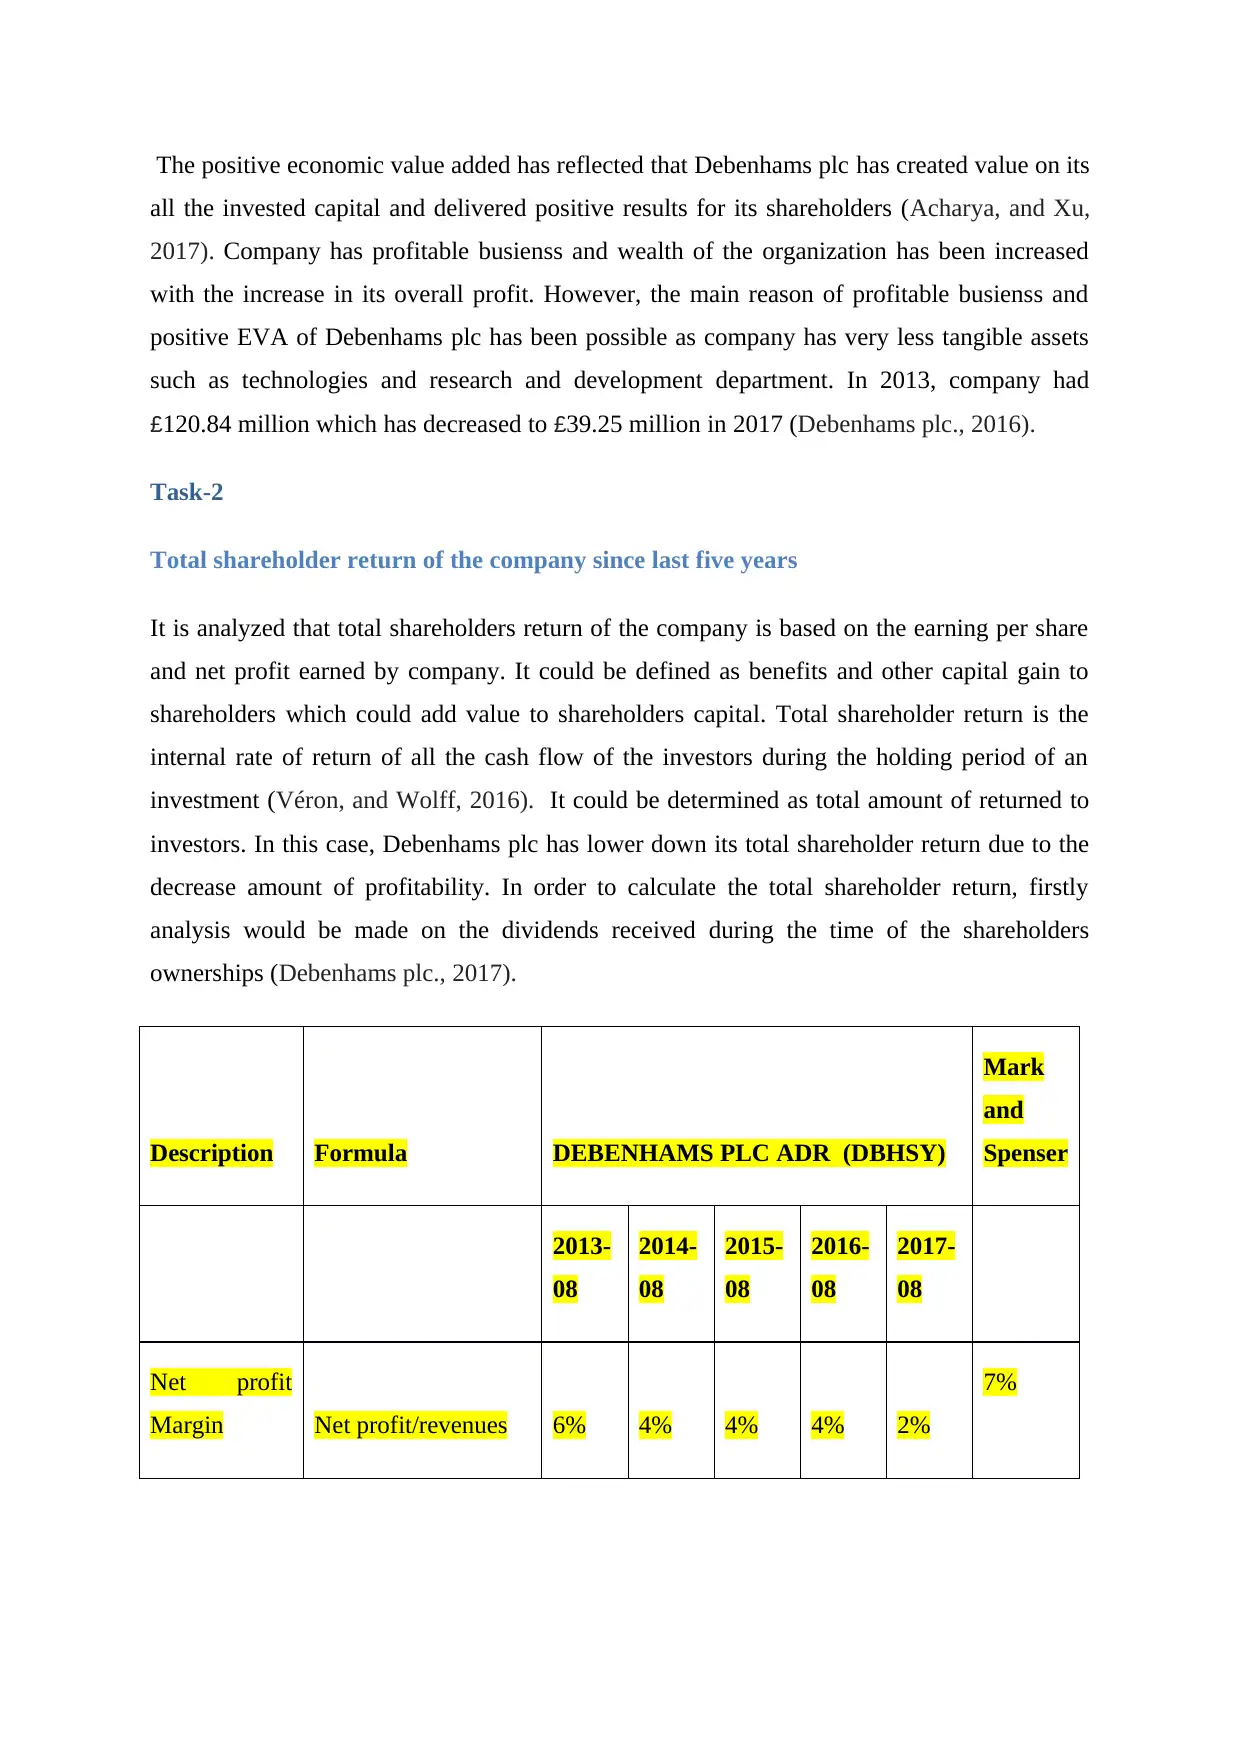
Description Formula DEBENHAMS PLC ADR (DBHSY)
Mark
and
Spenser
2013-
08
2014-
08
2015-
08
2016-
08
2017-
08
Net profit
Margin Net profit/revenues 6% 4% 4% 4% 2%
7%
all the invested capital and delivered positive results for its shareholders (Acharya, and Xu,
2017). Company has profitable busienss and wealth of the organization has been increased
with the increase in its overall profit. However, the main reason of profitable busienss and
positive EVA of Debenhams plc has been possible as company has very less tangible assets
such as technologies and research and development department. In 2013, company had
£120.84 million which has decreased to £39.25 million in 2017 (Debenhams plc., 2016).
Task-2
Total shareholder return of the company since last five years
It is analyzed that total shareholders return of the company is based on the earning per share
and net profit earned by company. It could be defined as benefits and other capital gain to
shareholders which could add value to shareholders capital. Total shareholder return is the
internal rate of return of all the cash flow of the investors during the holding period of an
investment (Véron, and Wolff, 2016). It could be determined as total amount of returned to
investors. In this case, Debenhams plc has lower down its total shareholder return due to the
decrease amount of profitability. In order to calculate the total shareholder return, firstly
analysis would be made on the dividends received during the time of the shareholders
ownerships (Debenhams plc., 2017).
Description Formula DEBENHAMS PLC ADR (DBHSY)
Mark
and
Spenser
2013-
08
2014-
08
2015-
08
2016-
08
2017-
08
Net profit
Margin Net profit/revenues 6% 4% 4% 4% 2%
7%
Paraphrase This Document
Need a fresh take? Get an instant paraphrase of this document with our AI Paraphraser
Return on
equity Net profit/Equity 17% 11% 11% 10% 5%
8.5%
Earnings per
share
Net profit/ Share
outstanding 0.50 0.25 .1.5 0.65 0.45
.79
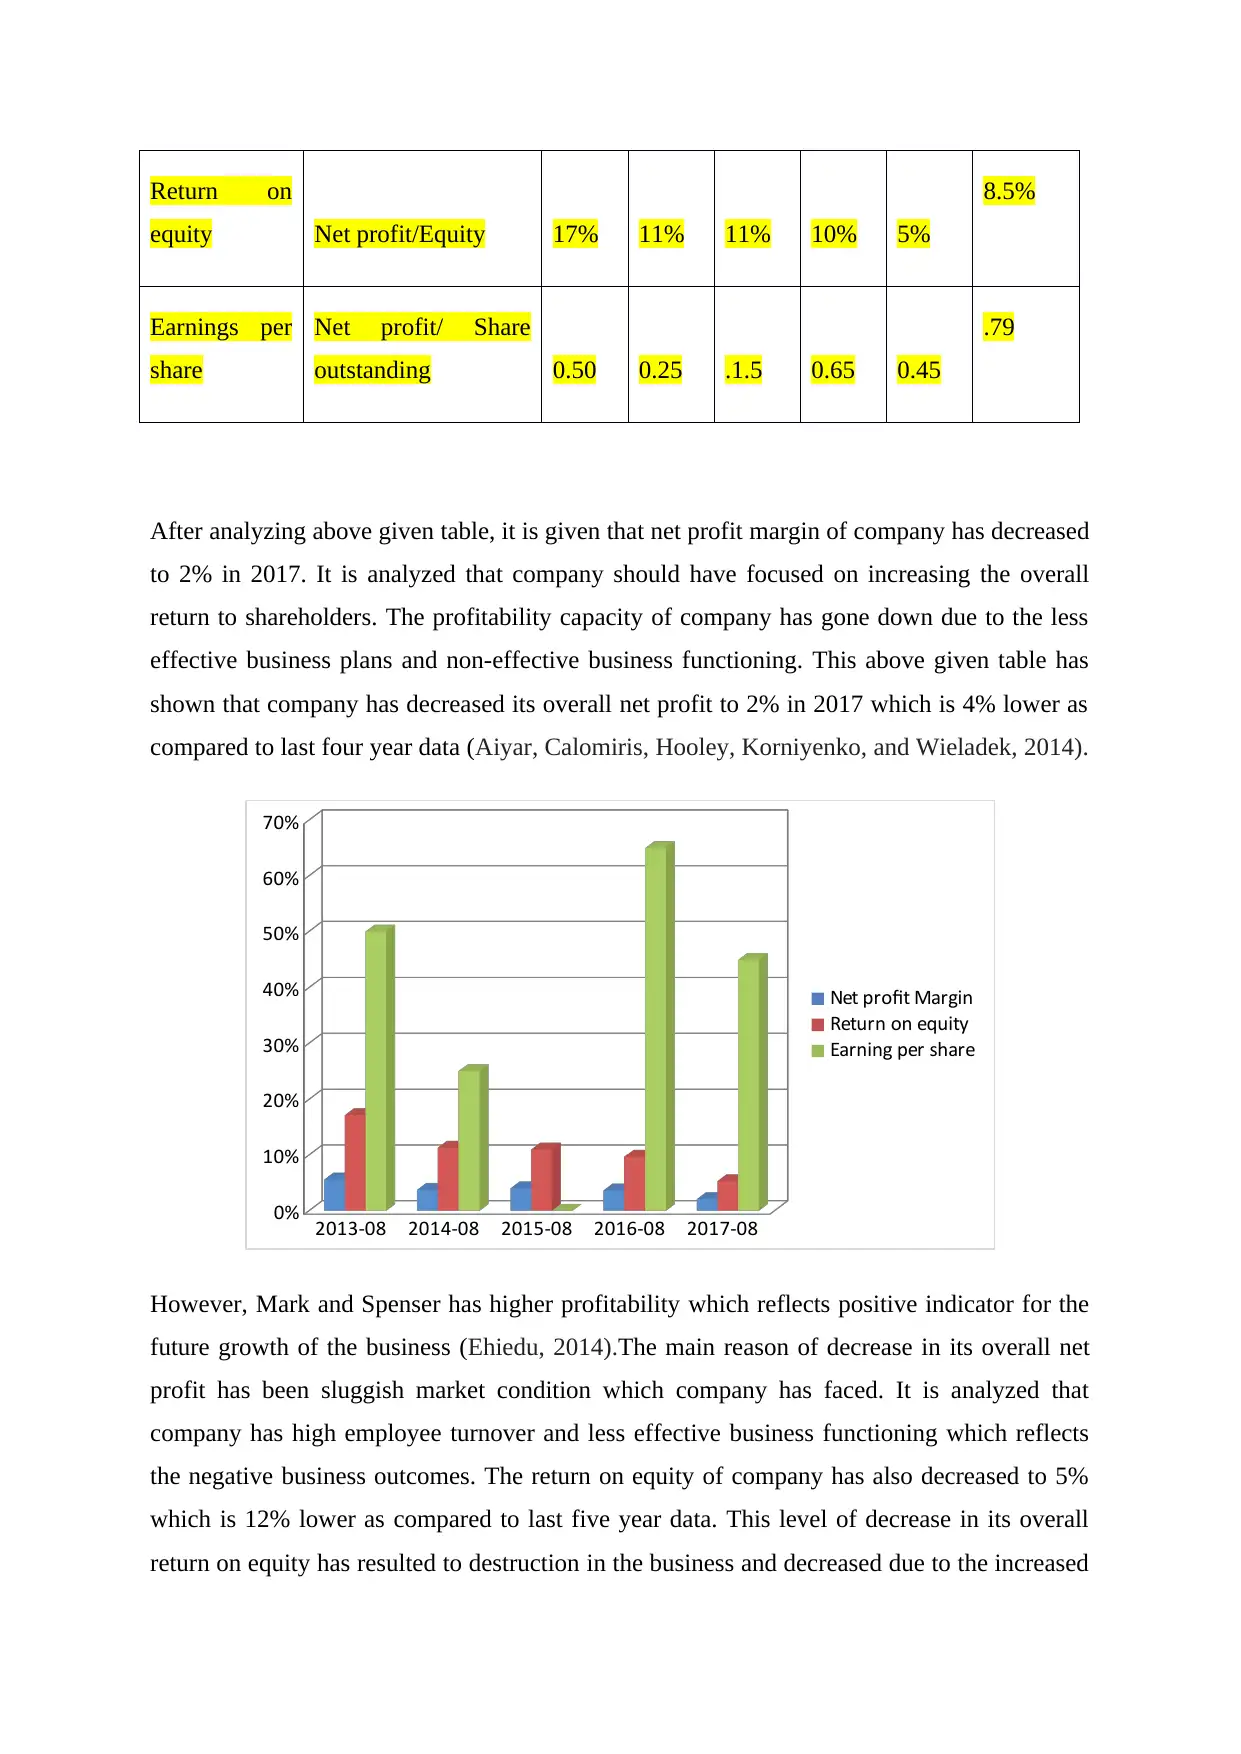
After analyzing above given table, it is given that net profit margin of company has decreased
to 2% in 2017. It is analyzed that company should have focused on increasing the overall
return to shareholders. The profitability capacity of company has gone down due to the less
effective business plans and non-effective business functioning. This above given table has
shown that company has decreased its overall net profit to 2% in 2017 which is 4% lower as
compared to last four year data (Aiyar, Calomiris, Hooley, Korniyenko, and Wieladek, 2014).
2013-08 2014-08 2015-08 2016-08 2017-08
0%
10%
20%
30%
40%
50%
60%
70%
Net profit Margin
Return on equity
Earning per share
However, Mark and Spenser has higher profitability which reflects positive indicator for the
future growth of the business (Ehiedu, 2014).The main reason of decrease in its overall net
profit has been sluggish market condition which company has faced. It is analyzed that
company has high employee turnover and less effective business functioning which reflects
the negative business outcomes. The return on equity of company has also decreased to 5%
which is 12% lower as compared to last five year data. This level of decrease in its overall
return on equity has resulted to destruction in the business and decreased due to the increased
equity Net profit/Equity 17% 11% 11% 10% 5%
8.5%
Earnings per
share
Net profit/ Share
outstanding 0.50 0.25 .1.5 0.65 0.45
.79
After analyzing above given table, it is given that net profit margin of company has decreased
to 2% in 2017. It is analyzed that company should have focused on increasing the overall
return to shareholders. The profitability capacity of company has gone down due to the less
effective business plans and non-effective business functioning. This above given table has
shown that company has decreased its overall net profit to 2% in 2017 which is 4% lower as
compared to last four year data (Aiyar, Calomiris, Hooley, Korniyenko, and Wieladek, 2014).
2013-08 2014-08 2015-08 2016-08 2017-08
0%
10%
20%
30%
40%
50%
60%
70%
Net profit Margin
Return on equity
Earning per share
However, Mark and Spenser has higher profitability which reflects positive indicator for the
future growth of the business (Ehiedu, 2014).The main reason of decrease in its overall net
profit has been sluggish market condition which company has faced. It is analyzed that
company has high employee turnover and less effective business functioning which reflects
the negative business outcomes. The return on equity of company has also decreased to 5%
which is 12% lower as compared to last five year data. This level of decrease in its overall
return on equity has resulted to destruction in the business and decreased due to the increased
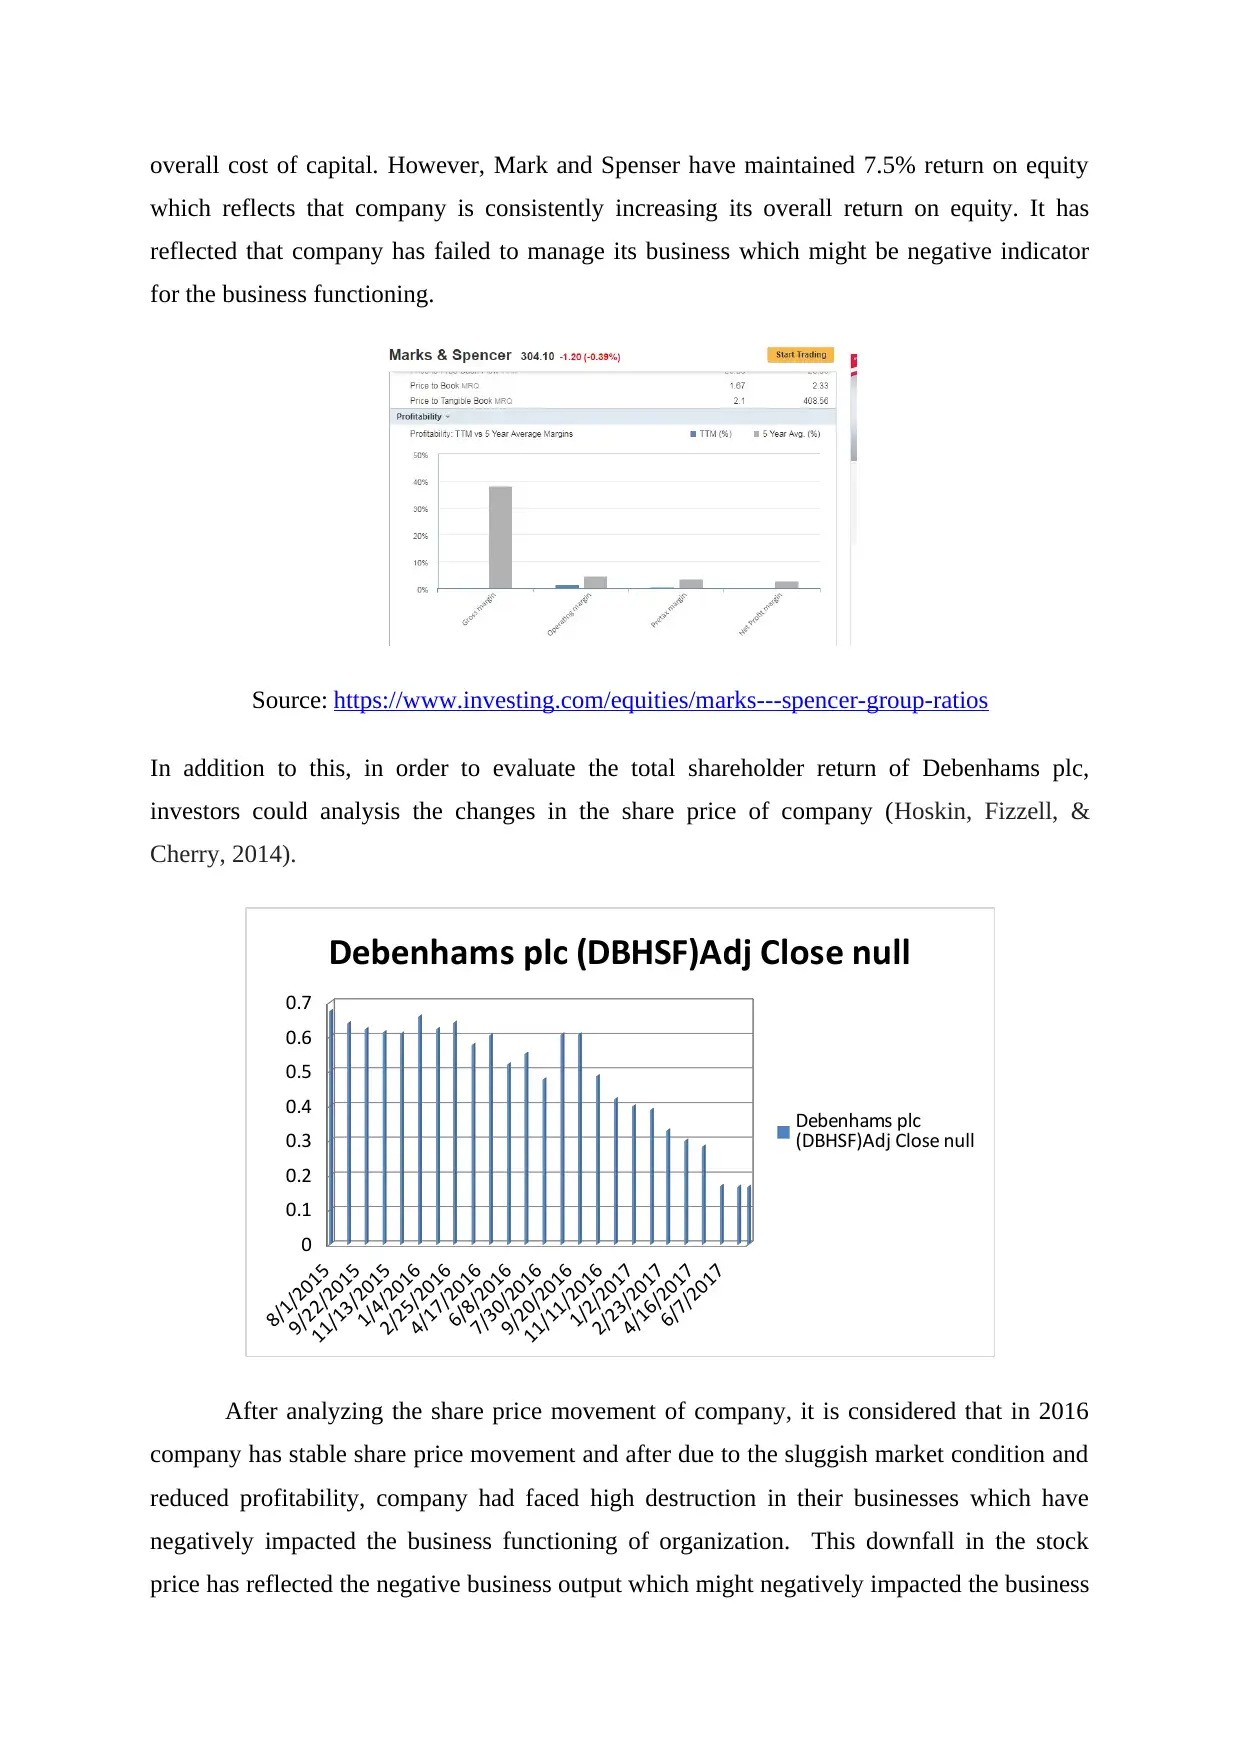
overall cost of capital. However, Mark and Spenser have maintained 7.5% return on equity
which reflects that company is consistently increasing its overall return on equity. It has
reflected that company has failed to manage its business which might be negative indicator
for the business functioning.
Source: https://www.investing.com/equities/marks---spencer-group-ratios
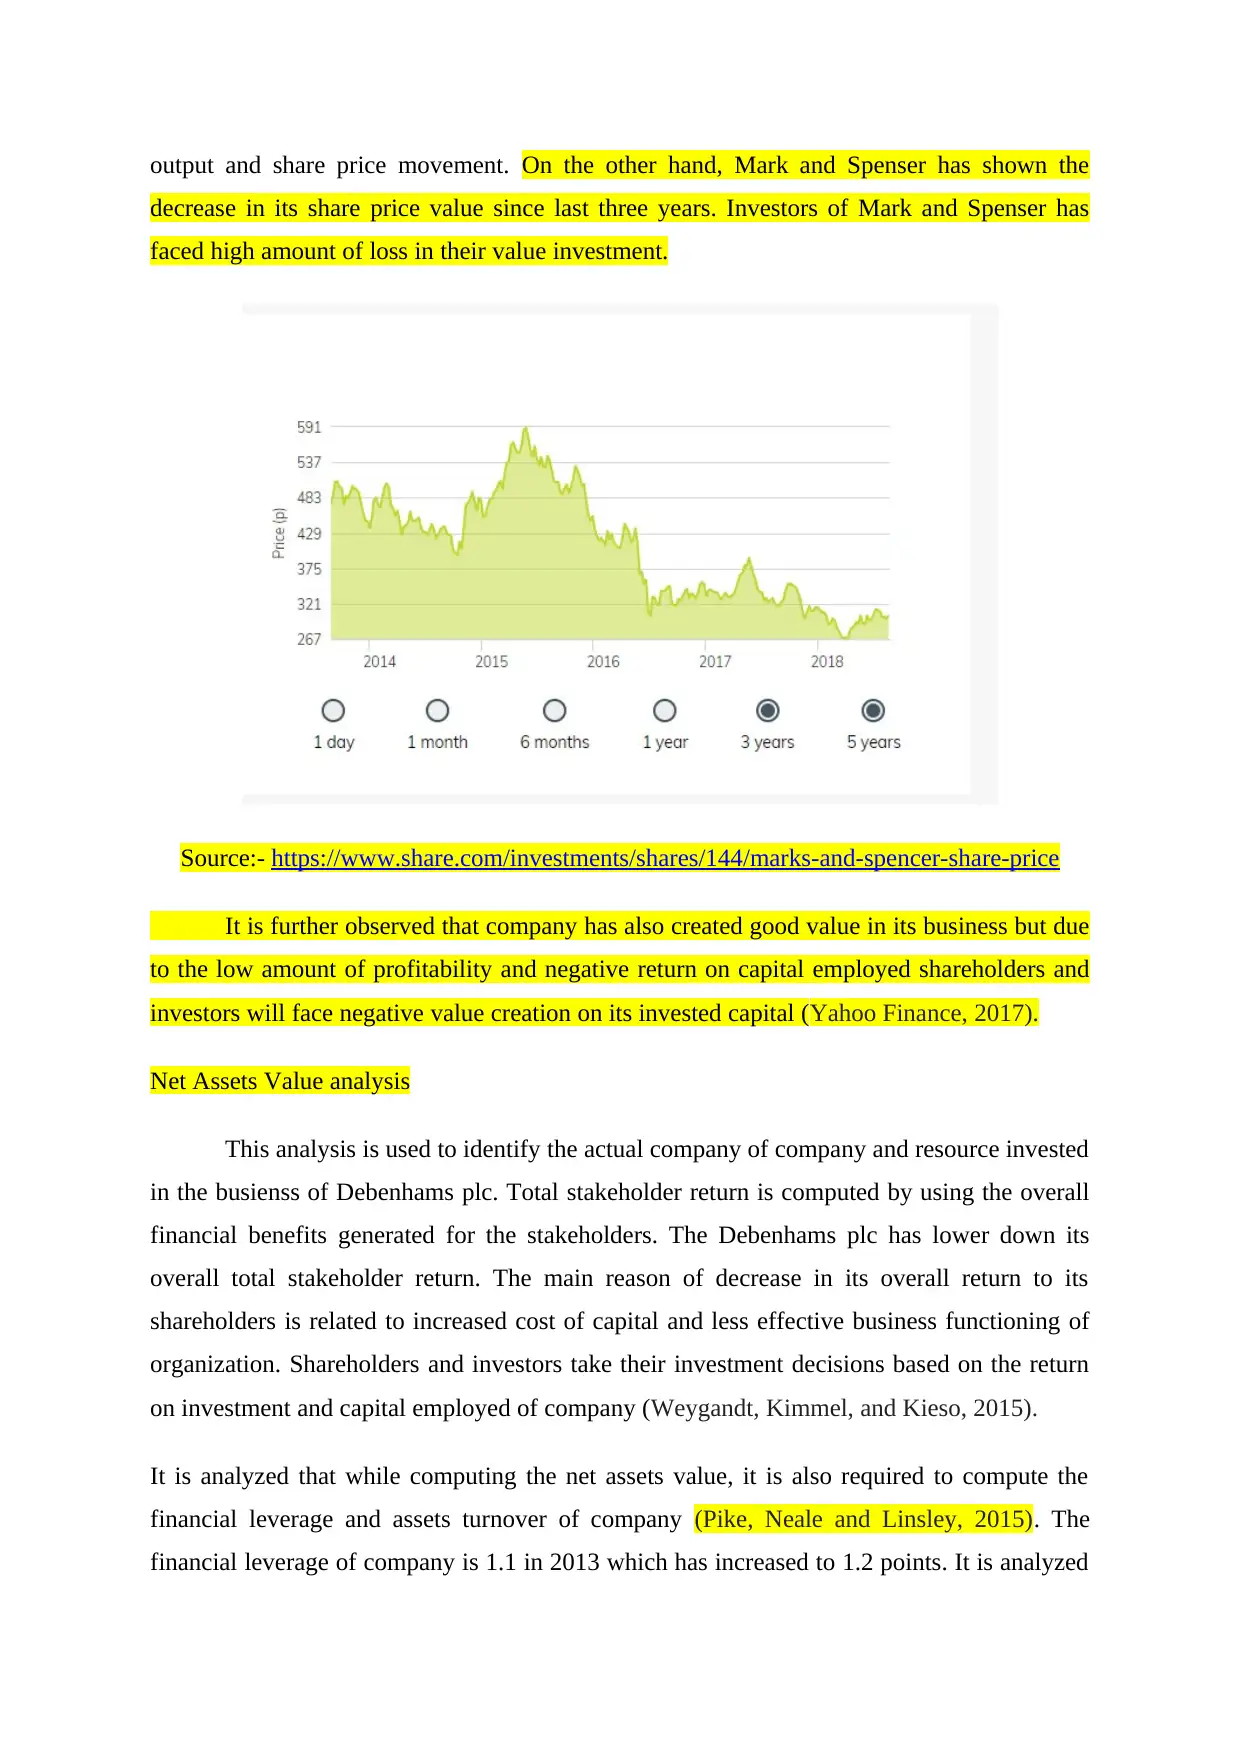
In addition to this, in order to evaluate the total shareholder return of Debenhams plc,
investors could analysis the changes in the share price of company (Hoskin, Fizzell, &
Cherry, 2014).
8/1/2015
9/22/2015
11/13/2015
1/4/2016
2/25/2016
4/17/2016
6/8/2016
7/30/2016
9/20/2016
11/11/2016
1/2/2017
2/23/2017
4/16/2017
6/7/2017
0
0.1
0.2
0.3
0.4
0.5
0.6
0.7
Debenhams plc (DBHSF)Adj Close null
Debenhams plc
(DBHSF)Adj Close null
After analyzing the share price movement of company, it is considered that in 2016
company has stable share price movement and after due to the sluggish market condition and
reduced profitability, company had faced high destruction in their businesses which have
negatively impacted the business functioning of organization. This downfall in the stock
price has reflected the negative business output which might negatively impacted the business
which reflects that company is consistently increasing its overall return on equity. It has
reflected that company has failed to manage its business which might be negative indicator
for the business functioning.
Source: https://www.investing.com/equities/marks---spencer-group-ratios
In addition to this, in order to evaluate the total shareholder return of Debenhams plc,
investors could analysis the changes in the share price of company (Hoskin, Fizzell, &
Cherry, 2014).
8/1/2015
9/22/2015
11/13/2015
1/4/2016
2/25/2016
4/17/2016
6/8/2016
7/30/2016
9/20/2016
11/11/2016
1/2/2017
2/23/2017
4/16/2017
6/7/2017
0
0.1
0.2
0.3
0.4
0.5
0.6
0.7
Debenhams plc (DBHSF)Adj Close null
Debenhams plc
(DBHSF)Adj Close null
After analyzing the share price movement of company, it is considered that in 2016
company has stable share price movement and after due to the sluggish market condition and
reduced profitability, company had faced high destruction in their businesses which have
negatively impacted the business functioning of organization. This downfall in the stock
price has reflected the negative business output which might negatively impacted the business
⊘ This is a preview!⊘
Do you want full access?
Subscribe today to unlock all pages.
Trusted by 1+ million students worldwide
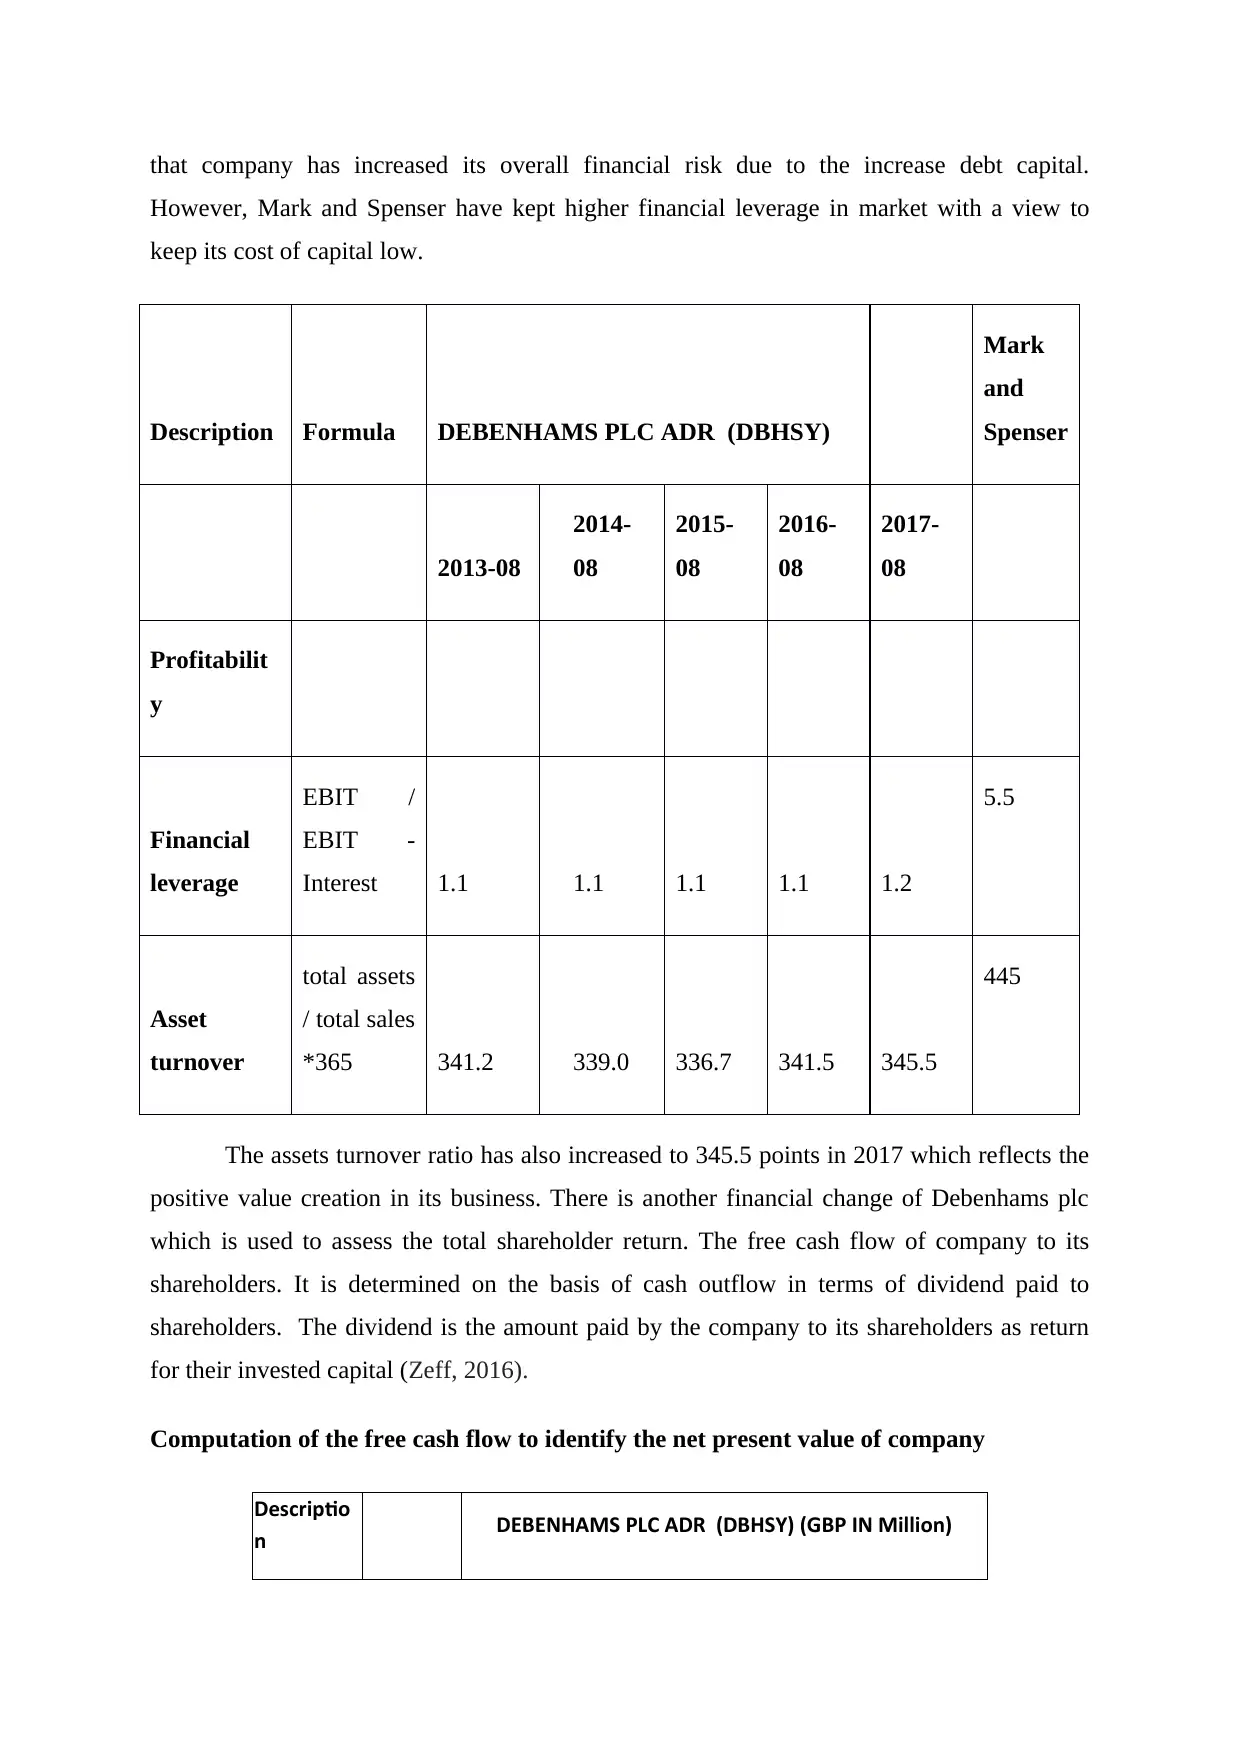
output and share price movement. On the other hand, Mark and Spenser has shown the
decrease in its share price value since last three years. Investors of Mark and Spenser has
faced high amount of loss in their value investment.
Source:- https://www.share.com/investments/shares/144/marks-and-spencer-share-price
It is further observed that company has also created good value in its business but due
to the low amount of profitability and negative return on capital employed shareholders and
investors will face negative value creation on its invested capital (Yahoo Finance, 2017).
Net Assets Value analysis
This analysis is used to identify the actual company of company and resource invested
in the busienss of Debenhams plc. Total stakeholder return is computed by using the overall
financial benefits generated for the stakeholders. The Debenhams plc has lower down its
overall total stakeholder return. The main reason of decrease in its overall return to its
shareholders is related to increased cost of capital and less effective business functioning of
organization. Shareholders and investors take their investment decisions based on the return
on investment and capital employed of company (Weygandt, Kimmel, and Kieso, 2015).
It is analyzed that while computing the net assets value, it is also required to compute the
financial leverage and assets turnover of company (Pike, Neale and Linsley, 2015). The
financial leverage of company is 1.1 in 2013 which has increased to 1.2 points. It is analyzed
Paraphrase This Document
Need a fresh take? Get an instant paraphrase of this document with our AI Paraphraser
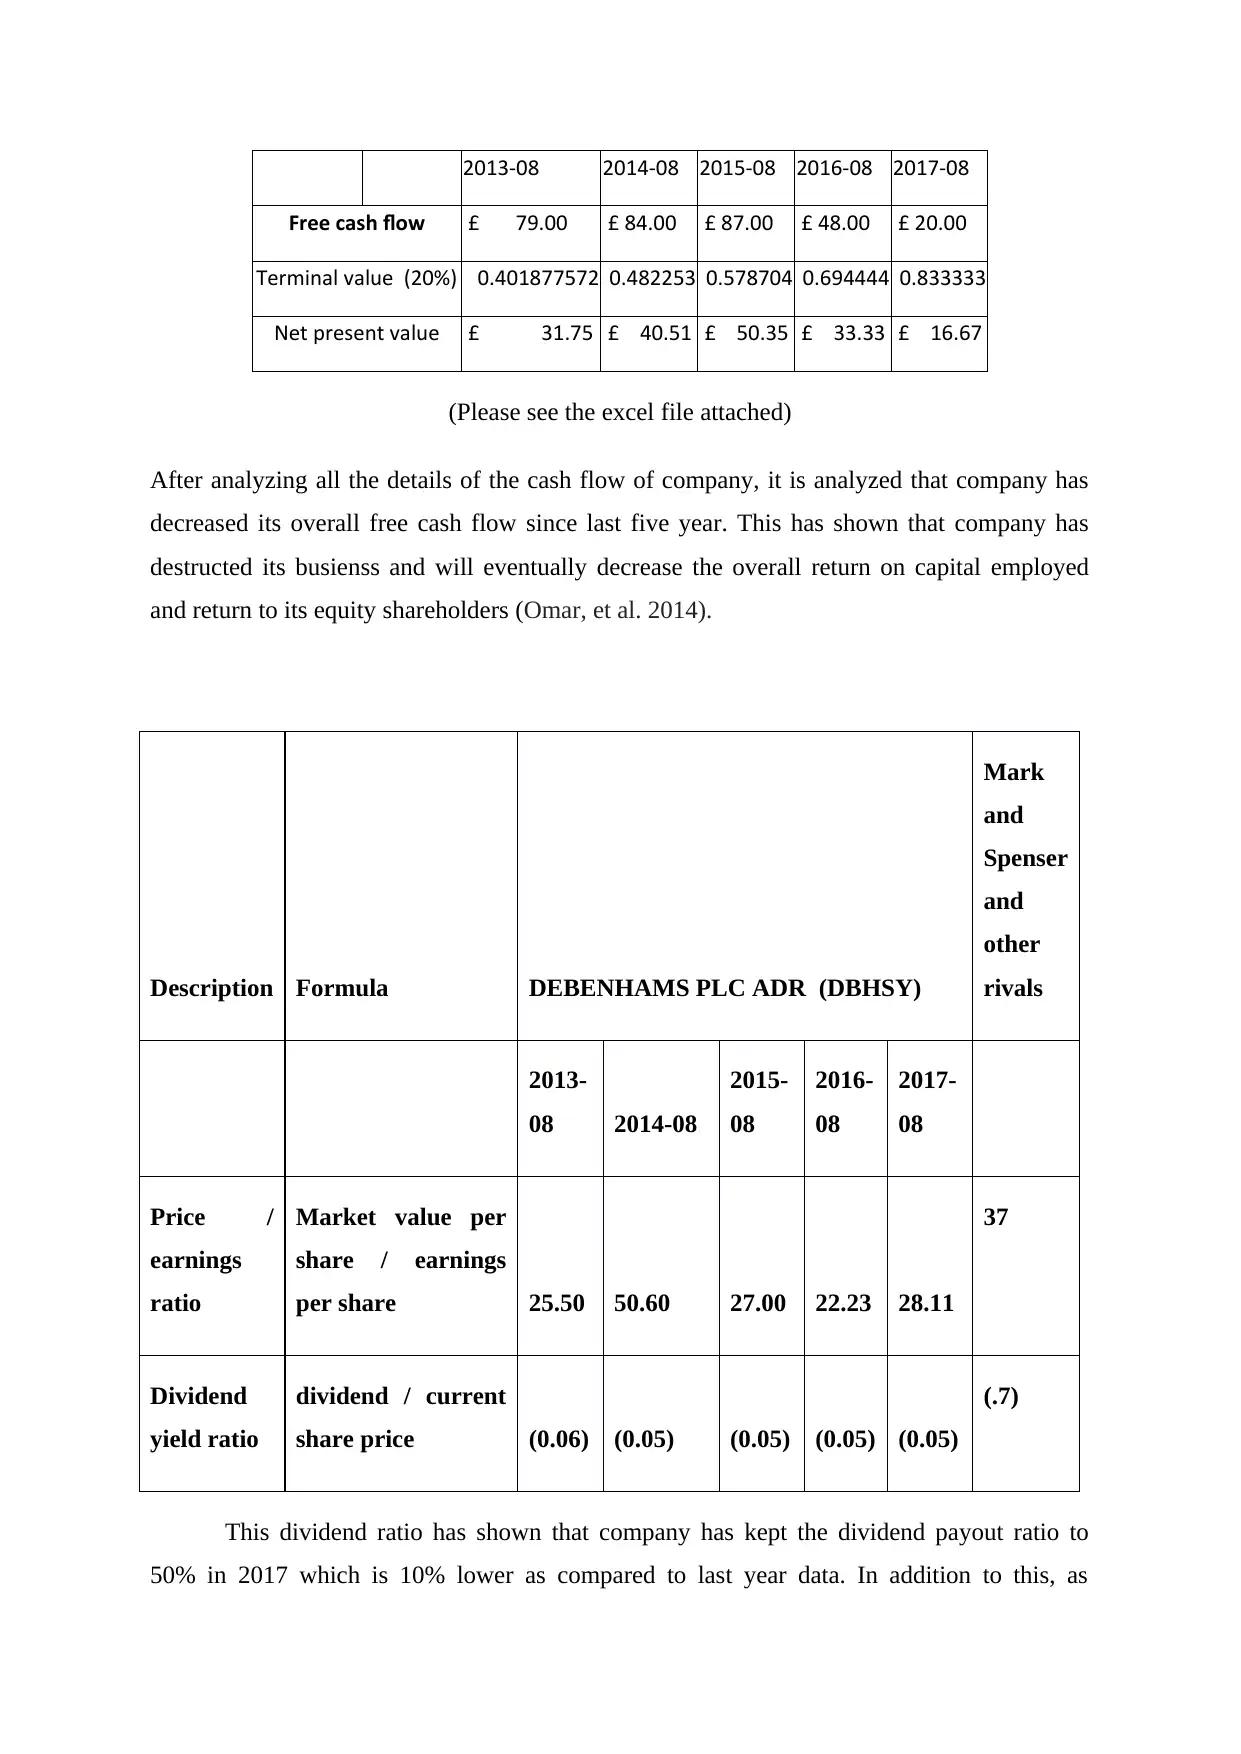
that company has increased its overall financial risk due to the increase debt capital.
However, Mark and Spenser have kept higher financial leverage in market with a view to
keep its cost of capital low.
Description Formula DEBENHAMS PLC ADR (DBHSY)
Mark
and
Spenser
2013-08
2014-
08
2015-
08
2016-
08
2017-
08
Profitabilit
y
Financial
leverage
EBIT /
EBIT -
Interest 1.1 1.1 1.1 1.1 1.2
5.5
Asset
turnover
total assets
/ total sales
*365 341.2 339.0 336.7 341.5 345.5
445
The assets turnover ratio has also increased to 345.5 points in 2017 which reflects the
positive value creation in its business. There is another financial change of Debenhams plc
which is used to assess the total shareholder return. The free cash flow of company to its
shareholders. It is determined on the basis of cash outflow in terms of dividend paid to
shareholders. The dividend is the amount paid by the company to its shareholders as return
for their invested capital (Zeff, 2016).
Computation of the free cash flow to identify the net present value of company
Descriptio
n DEBENHAMS PLC ADR (DBHSY) (GBP IN Million)
2013-08 2014-08 2015-08 2016-08 2017-08
Free cash flow £ 79.00 £ 84.00 £ 87.00 £ 48.00 £ 20.00
Terminal value (20%) 0.401877572 0.482253 0.578704 0.694444 0.833333
Net present value £ 31.75 £ 40.51 £ 50.35 £ 33.33 £ 16.67
(Please see the excel file attached)
After analyzing all the details of the cash flow of company, it is analyzed that company has
decreased its overall free cash flow since last five year. This has shown that company has
destructed its busienss and will eventually decrease the overall return on capital employed
and return to its equity shareholders (Omar, et al. 2014).
Description Formula DEBENHAMS PLC ADR (DBHSY)
Mark
and
Spenser
and
other
rivals
2013-
08 2014-08
2015-
08
2016-
08
2017-
08
Price /
earnings
ratio
Market value per
share / earnings
per share 25.50 50.60 27.00 22.23 28.11
37
Dividend
yield ratio
dividend / current
share price (0.06) (0.05) (0.05) (0.05) (0.05)
(.7)
This dividend ratio has shown that company has kept the dividend payout ratio to
50% in 2017 which is 10% lower as compared to last year data. In addition to this, as
⊘ This is a preview!⊘
Do you want full access?
Subscribe today to unlock all pages.
Trusted by 1+ million students worldwide
1 out of 18
Related Documents


Your All-in-One AI-Powered Toolkit for Academic Success.
+13062052269
info@desklib.com
Available 24*7 on WhatsApp / Email
![[object Object]](/_next/static/media/star-bottom.7253800d.svg)
Unlock your academic potential
Copyright © 2020–2026 A2Z Services. All Rights Reserved. Developed and managed by ZUCOL.