ANZ Bank Financial Analysis & DecaSport Project Viability
VerifiedAdded on 2023/04/21
|14
|2486
|447
Report
AI Summary
This report provides a comprehensive financial analysis of two distinct entities: ANZ Bank and DecaSport. For ANZ Bank, the report examines its capital structure, calculates the weighted average cost of capital (WACC), compares its capital structure with Westpac, and evaluates its financial performance using various ratios like debt-to-equity, return on assets, return on equity, net profit ratio, and earnings per share. The analysis also touches upon corporate governance principles, integrity, and accountability in light of the Royal Commission findings. For DecaSport, the report assesses the viability of a new sport shoe model by calculating after-tax cash flows, net present value, payback period, and profitability index, and also analyzes the impact of varying sales units on cash flows and evaluates different payment options. The report concludes with recommendations based on the financial analysis of both entities.

Running head: ACCOUNTING AND FINANCE
Accounting and finance
Name of the student
Name of the university
Student ID
Author note
Accounting and finance
Name of the student
Name of the university
Student ID
Author note
Paraphrase This Document
Need a fresh take? Get an instant paraphrase of this document with our AI Paraphraser

1ACCOUNTING AND FINANCE
Table of Contents
Part A.........................................................................................................................................2
Requirement (a)......................................................................................................................2
Requirement (b).....................................................................................................................3
Part B..........................................................................................................................................6
Executive summary................................................................................................................6
Introduction............................................................................................................................6
Answer 1................................................................................................................................6
Answer 2................................................................................................................................8
Answer 3..............................................................................................................................10
Answer 4..............................................................................................................................11
Reference..................................................................................................................................12

2ACCOUNTING AND FINANCE
Part A
Requirement (a)
1. After tax cash flows
After tax cash flows is the measure used for measuring the entity’s ability to generate
the positive cash flow after deducting the taxes. After tax cash flows of the company are
calculated as follows –
Total amount of after tax cash flows is $ 34,213,332.19.
2. Net present value
Net present value is present value of the investment’s projected cash inflows reduced
by initial cost expenses for acquiring the asset. The project is generally accepted if the net
present value is positive and is rejected if the net present value is negative (DeFusco et al.,
2015). From the above it can be identified that the net present value of the project is $
11,590,351. Hence, based on the NPV the project shall be accepted.
3. Payback period
⊘ This is a preview!⊘
Do you want full access?
Subscribe today to unlock all pages.
Trusted by 1+ million students worldwide

3ACCOUNTING AND FINANCE
Payback period is the time required by the project to recover the initial investment
cost. It is an important determinant while deciding regarding acceptance of any project. From
the calculation it can be identified that the payback period of the project is 0.86 years that is
the initial investment related to the project will be recovered in 0.86 years and hence the
project is acceptable (Chandra, 2017).
4. Profitability index
It measures the ratio among the present value of the future cash flows and initial
investment. It is considered as an important tool to rank the projects and selecting one
particular project based on the rank. From the calculation it can be identified that the
profitability index of the project is 2.40. As the profitability index is more than 1 it is
indicating that the project will be able to recover its initial outlay amount and therefore
acceptable (Boyd, Epanchin-Niell & Siikamäki, 2015).
5. Viability of project
From all the measures used above it is identified that the project is acceptable from all
the aspects. Hence, the project will be considered as viable.
Requirement (b)
(i) After tax cash flows if sales units are 10% higher
Paraphrase This Document
Need a fresh take? Get an instant paraphrase of this document with our AI Paraphraser

4ACCOUNTING AND FINANCE
(ii) After tax cash flows if sales units are 10% lower
(iii) Findings
It can be identified from above that total cash flows generated when the sales level is
10% higher as compared to estimation for the 1st year is $ 37,522,165.41. On the other hand,
total cash flows generated when the sales level is 10% lower as compared to estimation for

5ACCOUNTING AND FINANCE
the 1st year is $ 30,904,498.97. Hence, cash flow is highest when the sales level is 10% higher
as compared to estimation for the 1st year (Gaudard, 2015).
(iv) Decision regarding payment option
If the payment is paid in full at the time of purchase the payment required to be made
is $ 71,25,000 after getting 5% discount. If the payment is monthly the total amount required
to be paid is $ 71,06,724 and if the payment is made on quarterly basis in 3 years the amount
required to be paid is $ 69,06,360. Hence, the payment is lowest if it is made on quarterly
basis for 3 years. Hence, the company shall choose quarterly payment option.
⊘ This is a preview!⊘
Do you want full access?
Subscribe today to unlock all pages.
Trusted by 1+ million students worldwide

6ACCOUNTING AND FINANCE
Part B
Executive summary
The purpose of the report is to review the capital structure of ANZ bank and reporting
on the ability of the company to generate return for its shareholders. The report will focus on
the debt and equity component of the company’s capital structure for the year ended 2017. It
will further compute the after tax weighted average cost of capital and will compare its
capital structure with any other firm in the same industry. Further, the report will evaluate the
performance of the company through computing the financial ratios. Any significant changes
in the capital structure of the company will also be discussed in the report.
Introduction
Australia and New Zealand Banking Group Limited offers wide range of financial and
banking services and products. The bank’s segments include New Zealand, Australia,
institutional, Wealth Australia, Asia Retail & Pacific, technology, service, operations and the
group centre. Operation span of the bank is in New Zealand, Australia and various countries
in Asia Pacific region, United Kingdom, Germany, France, and United States. It offers
savings, current, premium call, cal deposits, solicitors trust, trust management and other
accounts for international payment, foreign currency and credit and debit cards. It further
offers mortgages, personal loans, overdrafts, home loans, flexible facilities, commercial and
business loans, investment services, rural finances, house, contents, boats, car, credit card
payment, firm and equipment and business (Anz.com, 2019).
Answer 1
(a) Capital structure
Paraphrase This Document
Need a fresh take? Get an instant paraphrase of this document with our AI Paraphraser
7ACCOUNTING AND FINANCE
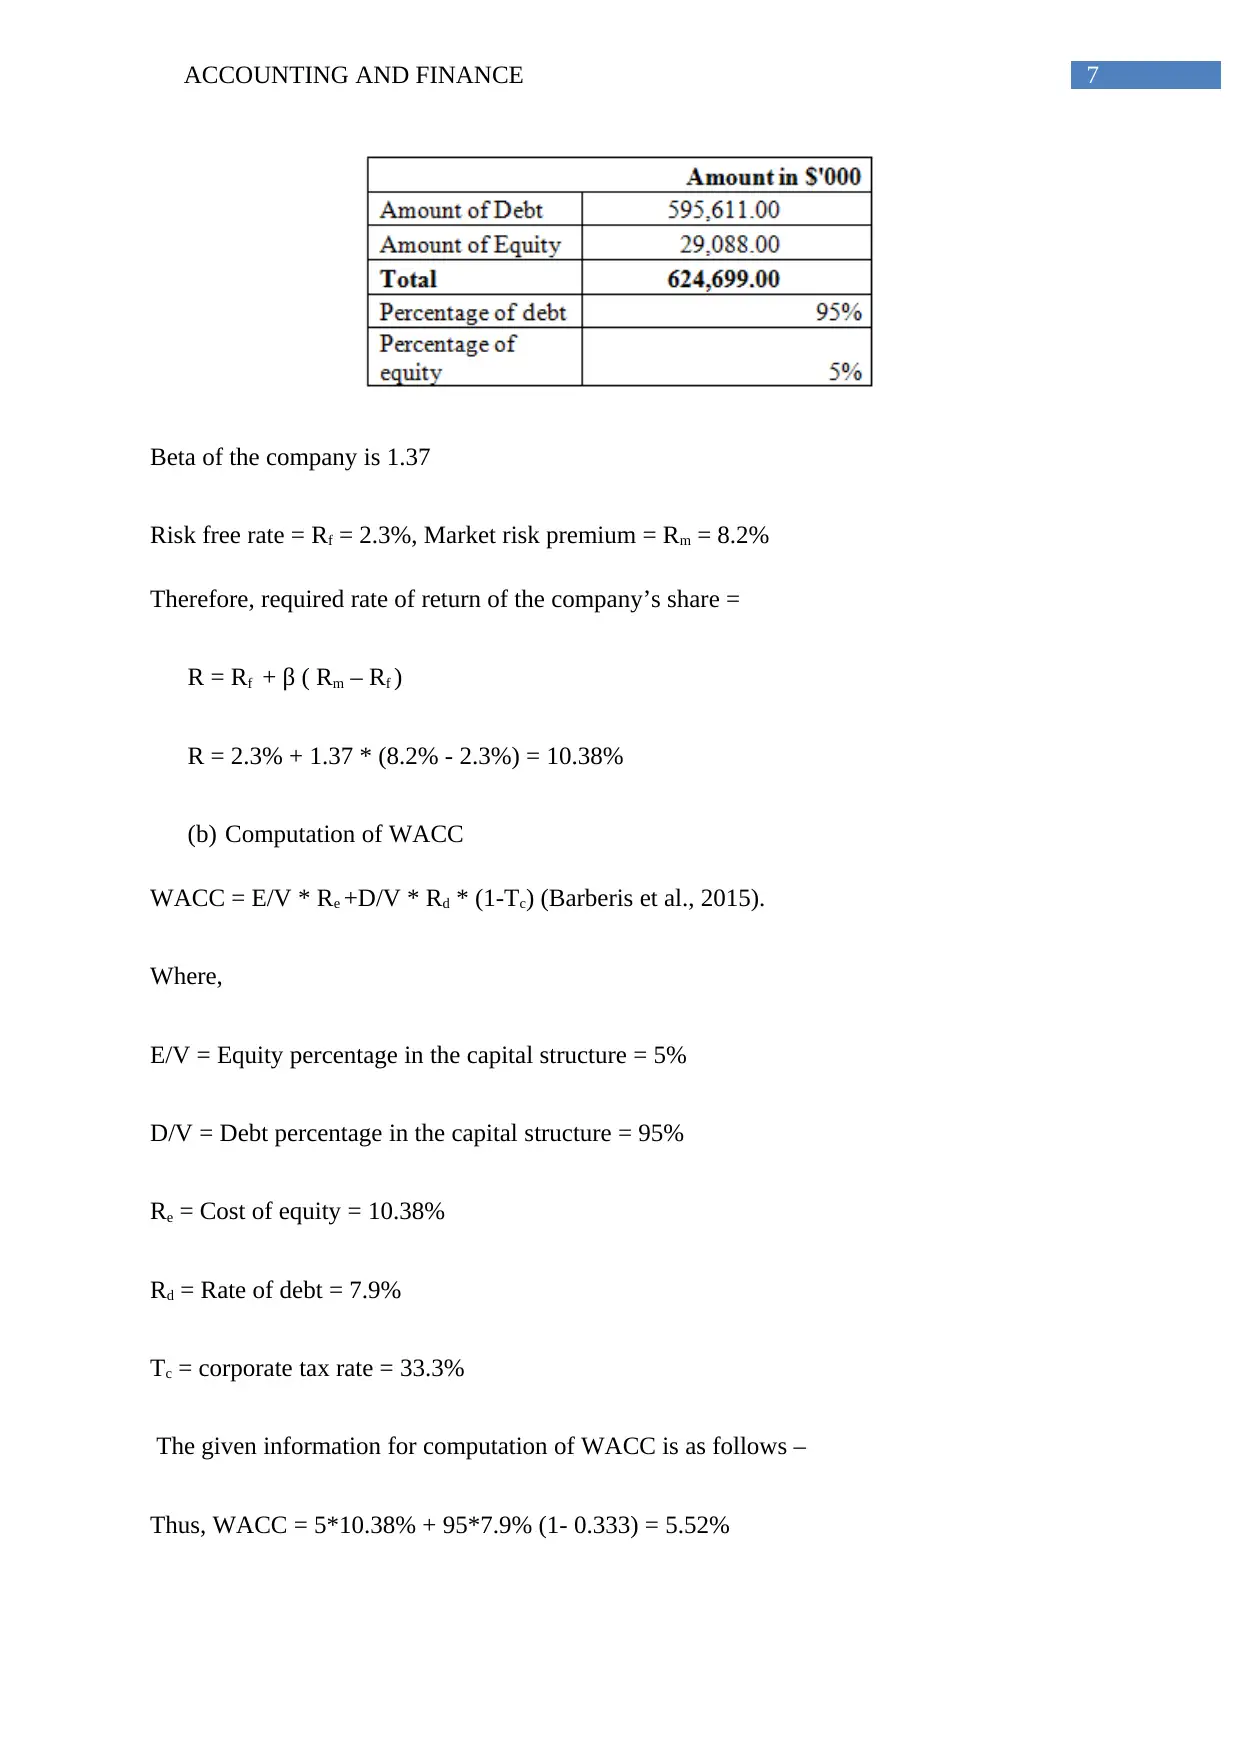
Beta of the company is 1.37
Risk free rate = Rf = 2.3%, Market risk premium = Rm = 8.2%
Therefore, required rate of return of the company’s share =
R = Rf + β ( Rm – Rf )
R = 2.3% + 1.37 * (8.2% - 2.3%) = 10.38%
(b) Computation of WACC
WACC = E/V * Re +D/V * Rd * (1-Tc) (Barberis et al., 2015).
Where,
E/V = Equity percentage in the capital structure = 5%
D/V = Debt percentage in the capital structure = 95%
Re = Cost of equity = 10.38%
Rd = Rate of debt = 7.9%
Tc = corporate tax rate = 33.3%
The given information for computation of WACC is as follows –
Thus, WACC = 5*10.38% + 95*7.9% (1- 0.333) = 5.52%

8ACCOUNTING AND FINANCE
(c) Return as compared to risk
The actual return from the stock of the company is 1.50% whereas the expected return
as per CAPM is 10.38%. Hence, it can be determined that the company’s stock is
underperforming and is not generating given its risk (In.finance.yahoo.com, 2019).
(d) Comparison of capital structure
Capital structure of Westpac bank
Comparing the capital structure of ANZ bank with Westpac bank it can be identified
that both the banks are aggressively depended on debt as compared to equity. However, it can
be stated that Westpac bank is slightly less depended on debt as compared to ANZ as the debt
component of ANZ is 95% whereas the same for Westpac bank is 94%.
Answer 2
Ratio analysis
⊘ This is a preview!⊘
Do you want full access?
Subscribe today to unlock all pages.
Trusted by 1+ million students worldwide

9ACCOUNTING AND FINANCE
Ratio interpretation –
Debt equity ratio – debt to equity ratio is the solvency ratio used for measuring the
percentages of fund raised through debt and percentage raised through equity. It determines
that leverage position of the company as higher debt equity ratio determines that the company
is using aggressive funding from outside for its business operation. Looking into the debt
equity ratio of the company it can be identified that though the debt dependency of the
company has been reduced over the years from 2016 to 2017, significantly high debt equity
ratio of the company is indicating that the company is highly leveraged (Minnis &
Sutherland, 2017).
Return on assets – return on asset is used to indicate the profitability of the entity as
compared to the assets. It provides the analyst, investors and manager an idea regarding how
efficient the management of the company can be in using the assets for generating earnings.
Return on assets for the company is significantly low and has not been improved in 2017 as
compared to 2016. For both the years the return on asset is 0.1 (Brigham et al., 2016)
Return on equity – it is an important ratio as it measures the return rate received by the
owners of company’s common stock received for their shareholdings. It signifies how
efficient the company is with regard to generation of returns on investment received from the
Paraphrase This Document
Need a fresh take? Get an instant paraphrase of this document with our AI Paraphraser

10ACCOUNTING AND FINANCE
shareholders. Looking into the return on equity ratio of the company it can be identified that
though the ratio of the company has been increased slightly over the years from 2016 to
2017, significantly low return ratio is indicating that the company is not able to provide
sufficient return to its shareholders (Weygandt, Kimmel & Kieso, 2015).
Net profit ratio – it establishes the relationship among net profit after taxes and revenues. It is
considered as a major profitability ratio as it assists in determining overall efficiency of
business operation. Further, it indicates how well the trading activities of the company are
performing. Looking into the net profit ratio of the company it can be identified that the net
profit of the company has been increased from 27.84% to 31.67%. Hence, it can be stated that
the profitability position of the company has been improved over the years from 2016 to
2017.
Earnings per share – it represents proportion of the entity’s earnings left with the entity after
paying the taxes, preferred stock dividend and it is allocated to each common stock. Looking
into the EPS of the company it can be identified that it has been increased from 197.40 to
220.10. Hence, it can be stated that the earning position of the company has been improved
over the years from 2016 to 2017 (Gitman, Juchau & Flanagan, 2015).
Answer 3
Changes in capital structure

11ACCOUNTING AND FINANCE
It can be seen from the above table that for all previous 3 years the debt component of
the capital structure was 95% and the equity component was 5%. Hence, there were no
changes in the capital structure of the company.
Answer 4
Conclusion regarding the integrity and accountability
Principle of integrity states that the management are adhered to strict ethical or moral
code notwithstanding from any pressure regarding acting otherwise. It is important concept of
corporate governance as integrity deals with the principle of equitable and fair dealings with
the shareholders. On the other hand accountability and transparency are inter-connected.
Though all the decisions can be shared outside of the business the management are obliged to
use right tone while communicating the shareholders. The shareholders must be able to
understand the decision making process of the board, its challenges, responsibility and its
plan to address the shareholders.
Some of the key findings of Royal Commission were – (i) lenders were preferring
pursuit of the profit over everything else (ii) financial advice ignored the basis standards for
honesty (iii) reluctant upon the changes to the small business laws for lending (iv) basis
transactions made for confusing the indigenous customers (ABC News, 2018). Owing to the
scandal the bank face significant fell in its share value that took a year to recover the pre-
raising value fir A$ 32.58. Looking into the management’s style of operating the business it
can be concluded that the entity is not following the integrity and accountability concept of
corporate governance and they are not successful in managing the operational risks.
⊘ This is a preview!⊘
Do you want full access?
Subscribe today to unlock all pages.
Trusted by 1+ million students worldwide
1 out of 14
Related Documents


Your All-in-One AI-Powered Toolkit for Academic Success.
+13062052269
info@desklib.com
Available 24*7 on WhatsApp / Email
![[object Object]](/_next/static/media/star-bottom.7253800d.svg)
Unlock your academic potential
Copyright © 2020–2026 A2Z Services. All Rights Reserved. Developed and managed by ZUCOL.