Decision Support Tools Assignment: Analysis of Decision-Making Tools
VerifiedAdded on 2023/03/17
|12
|1470
|37
Homework Assignment
AI Summary
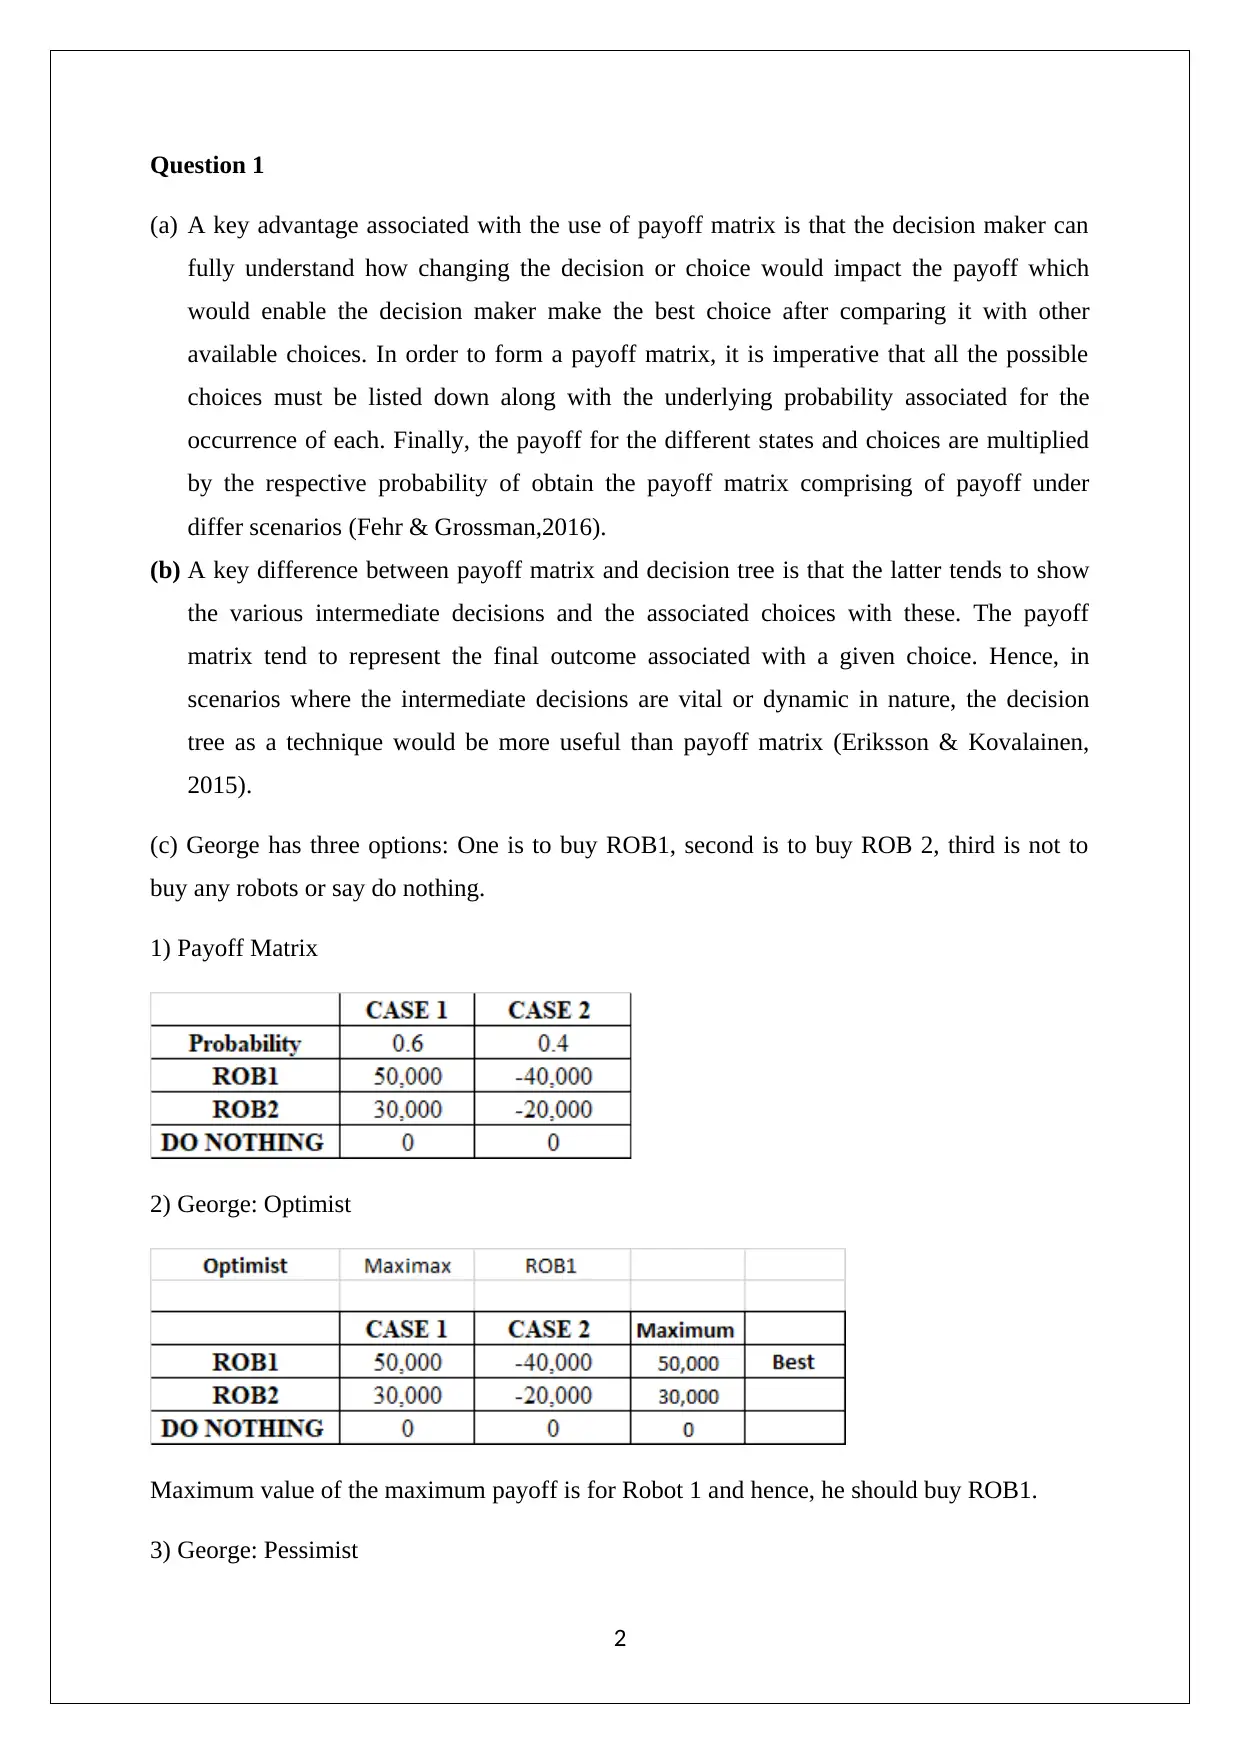
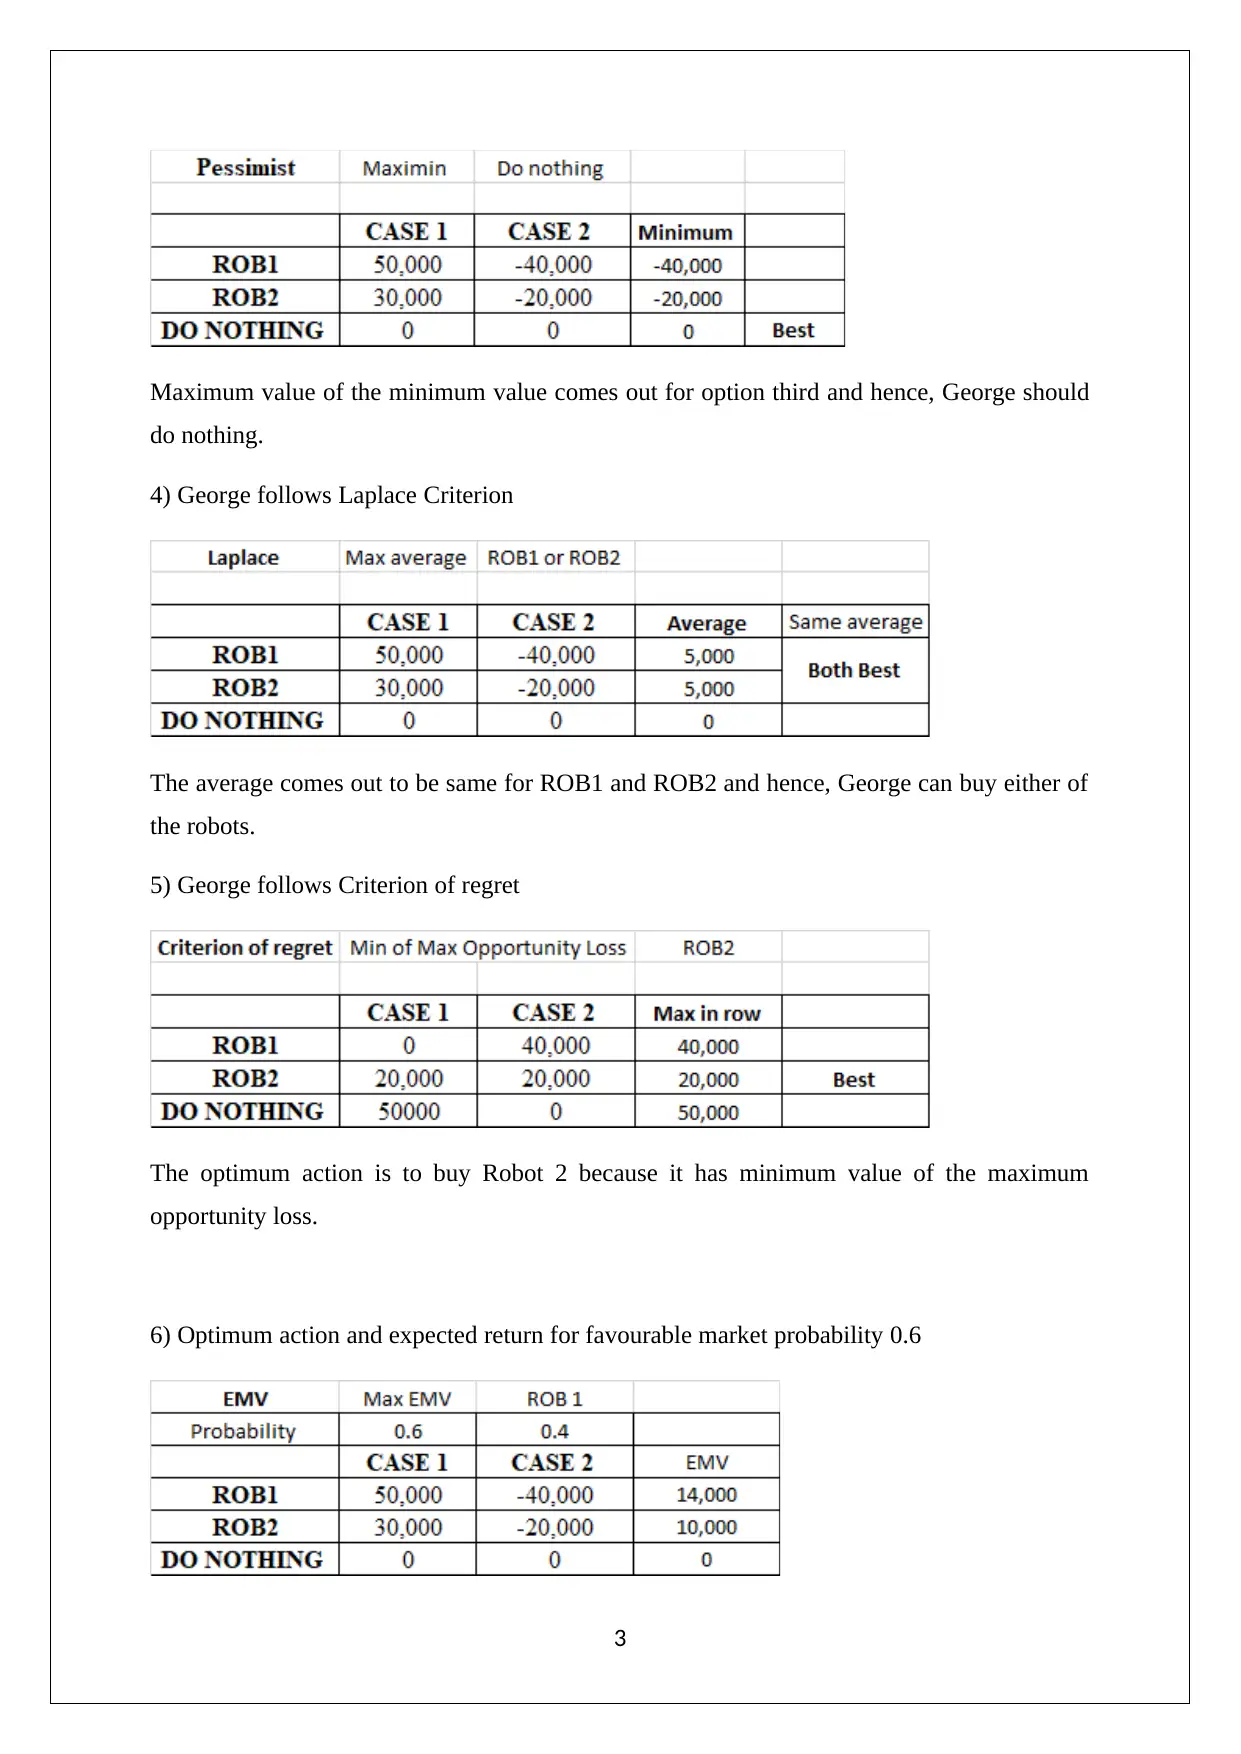
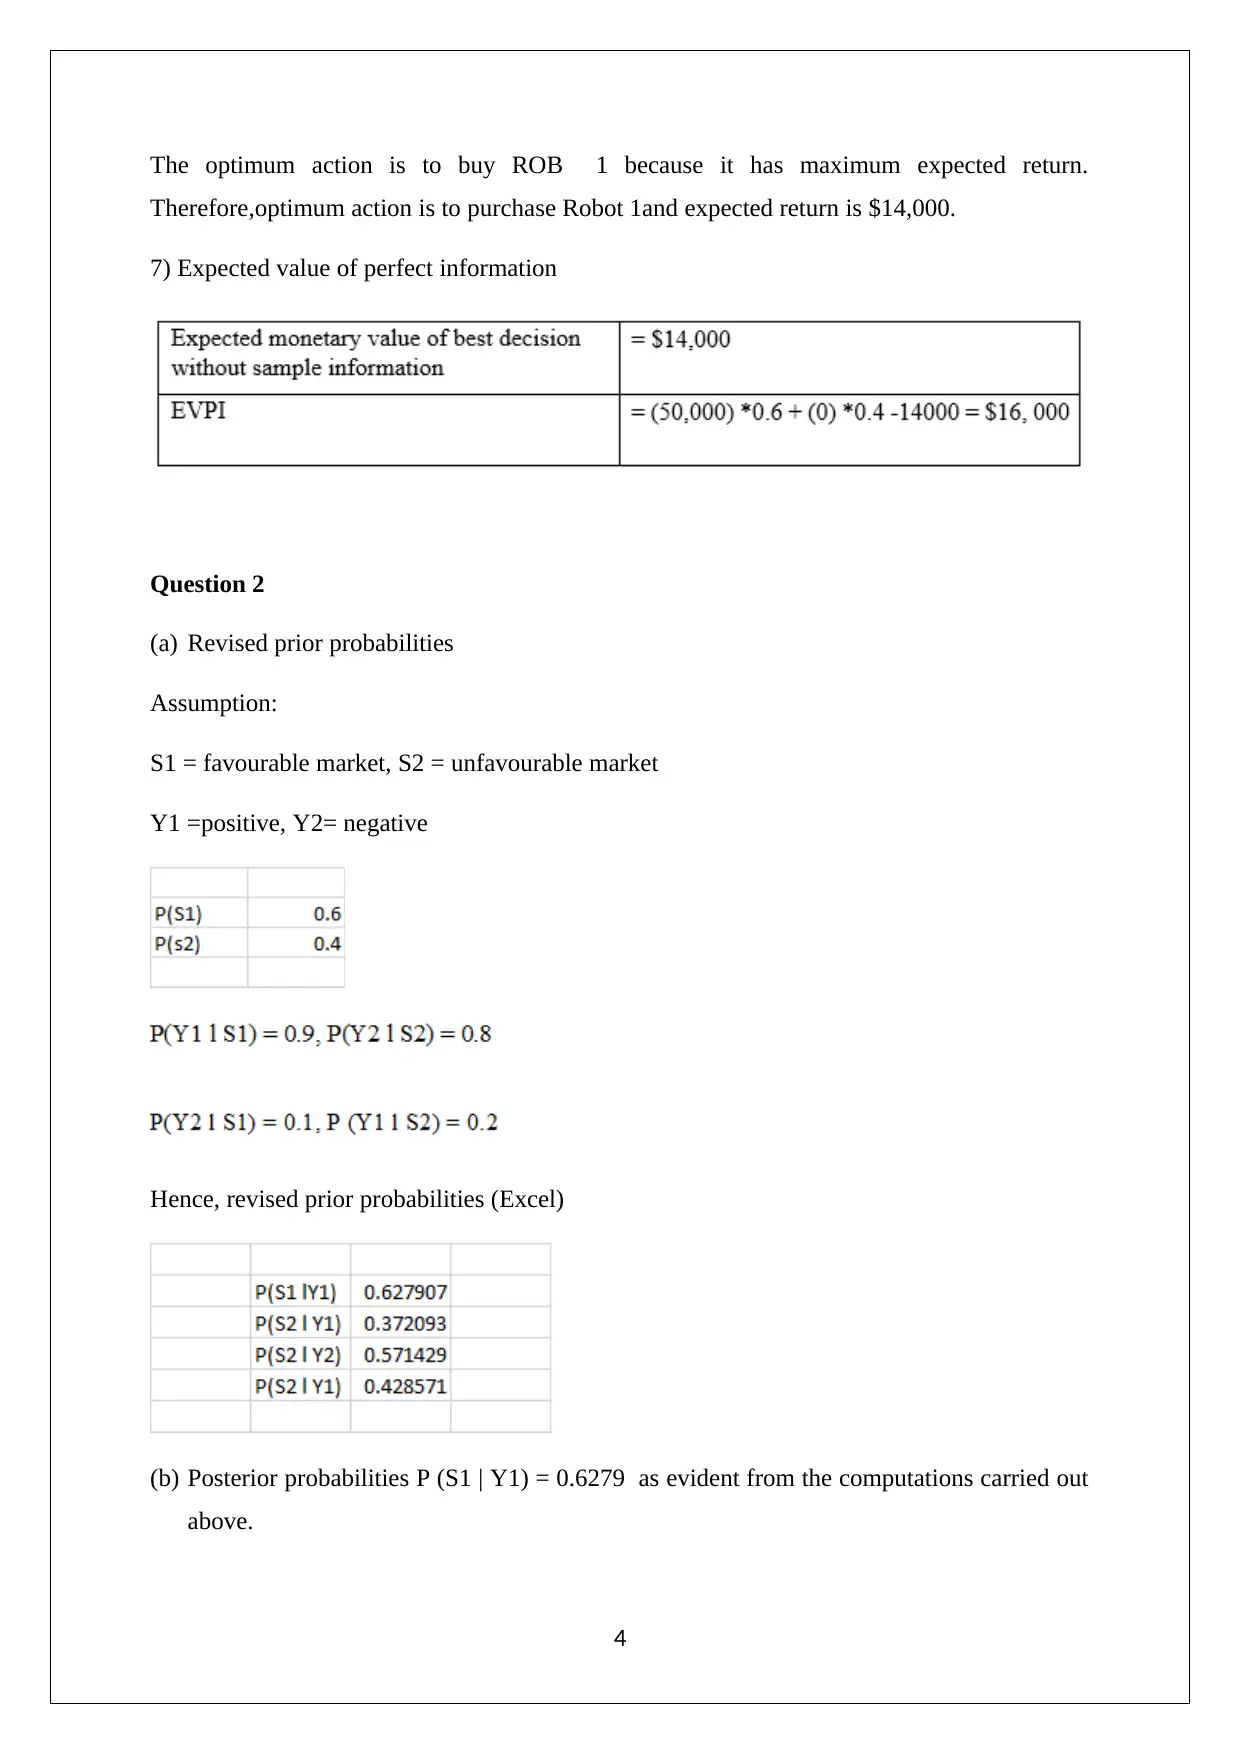
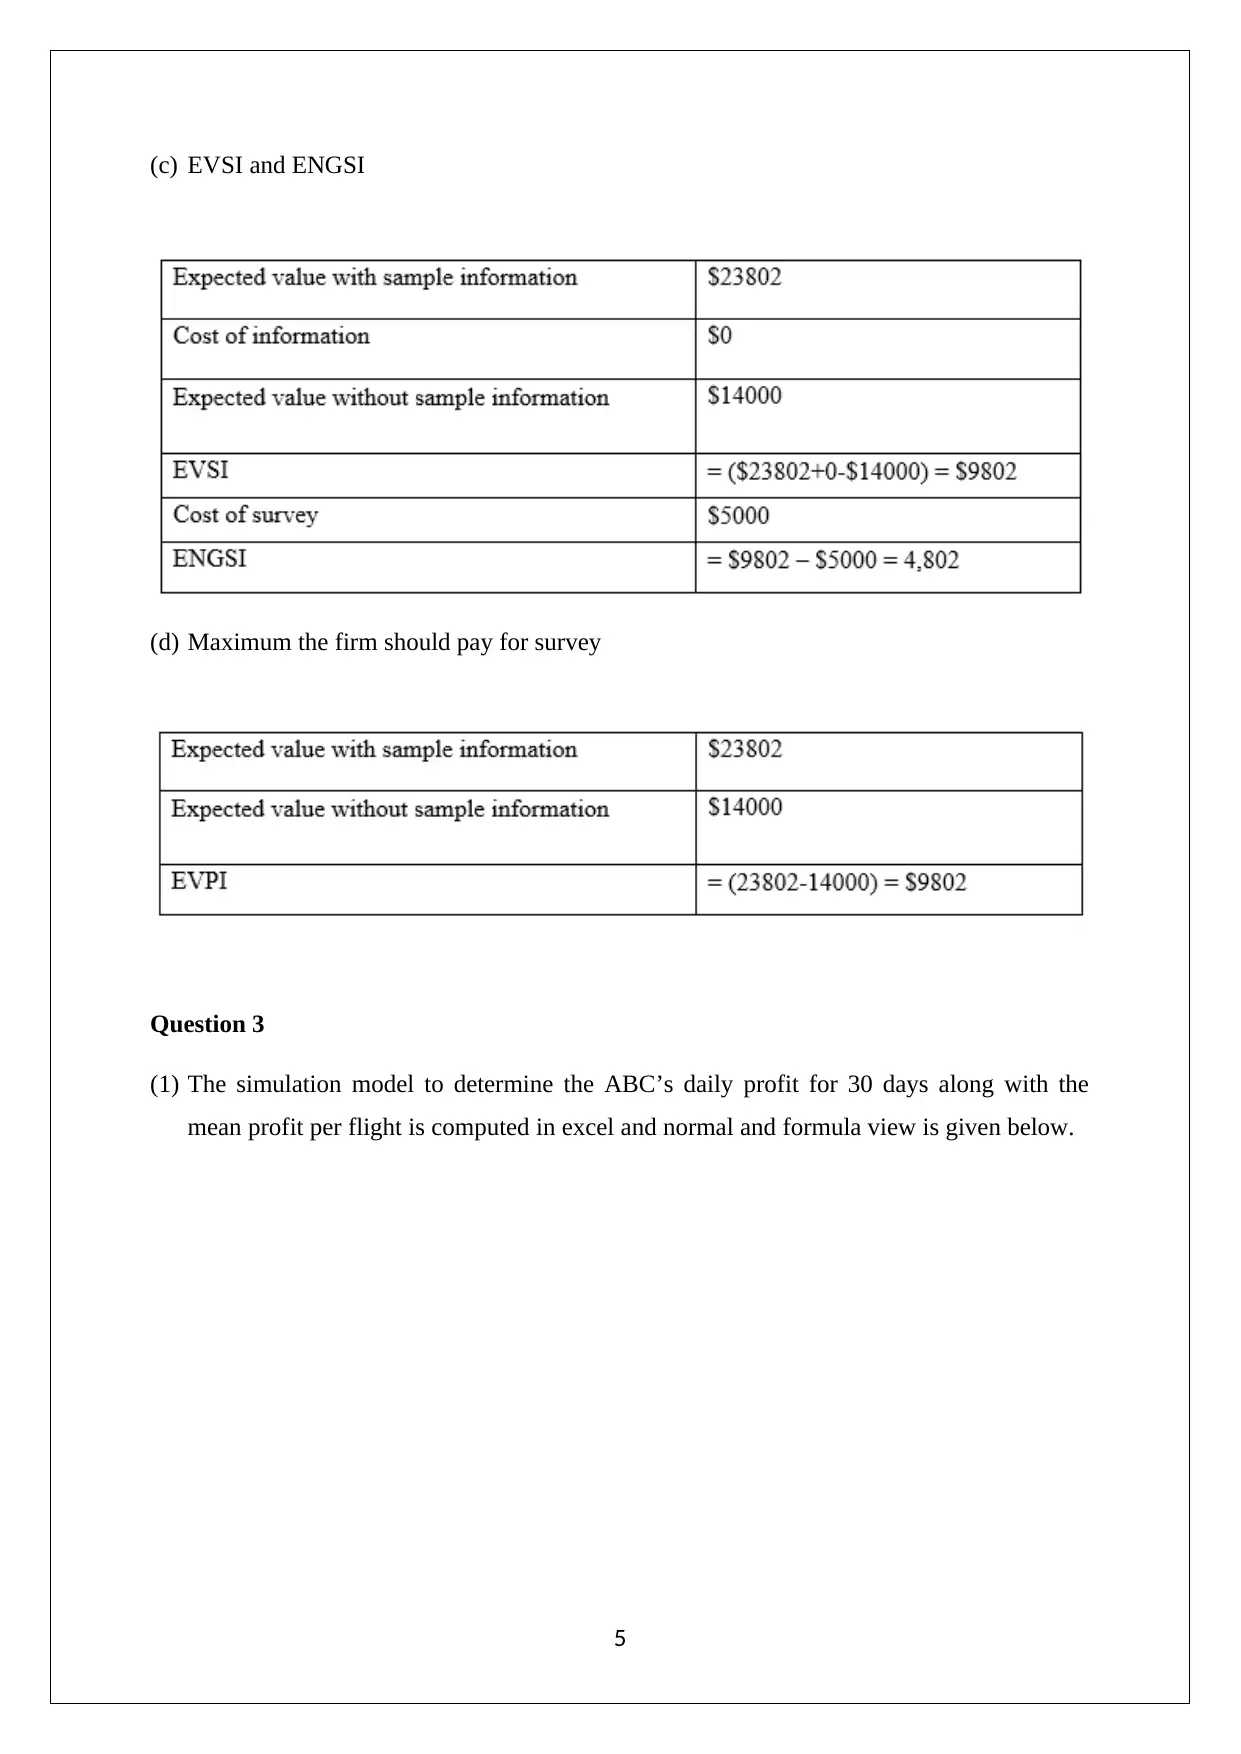
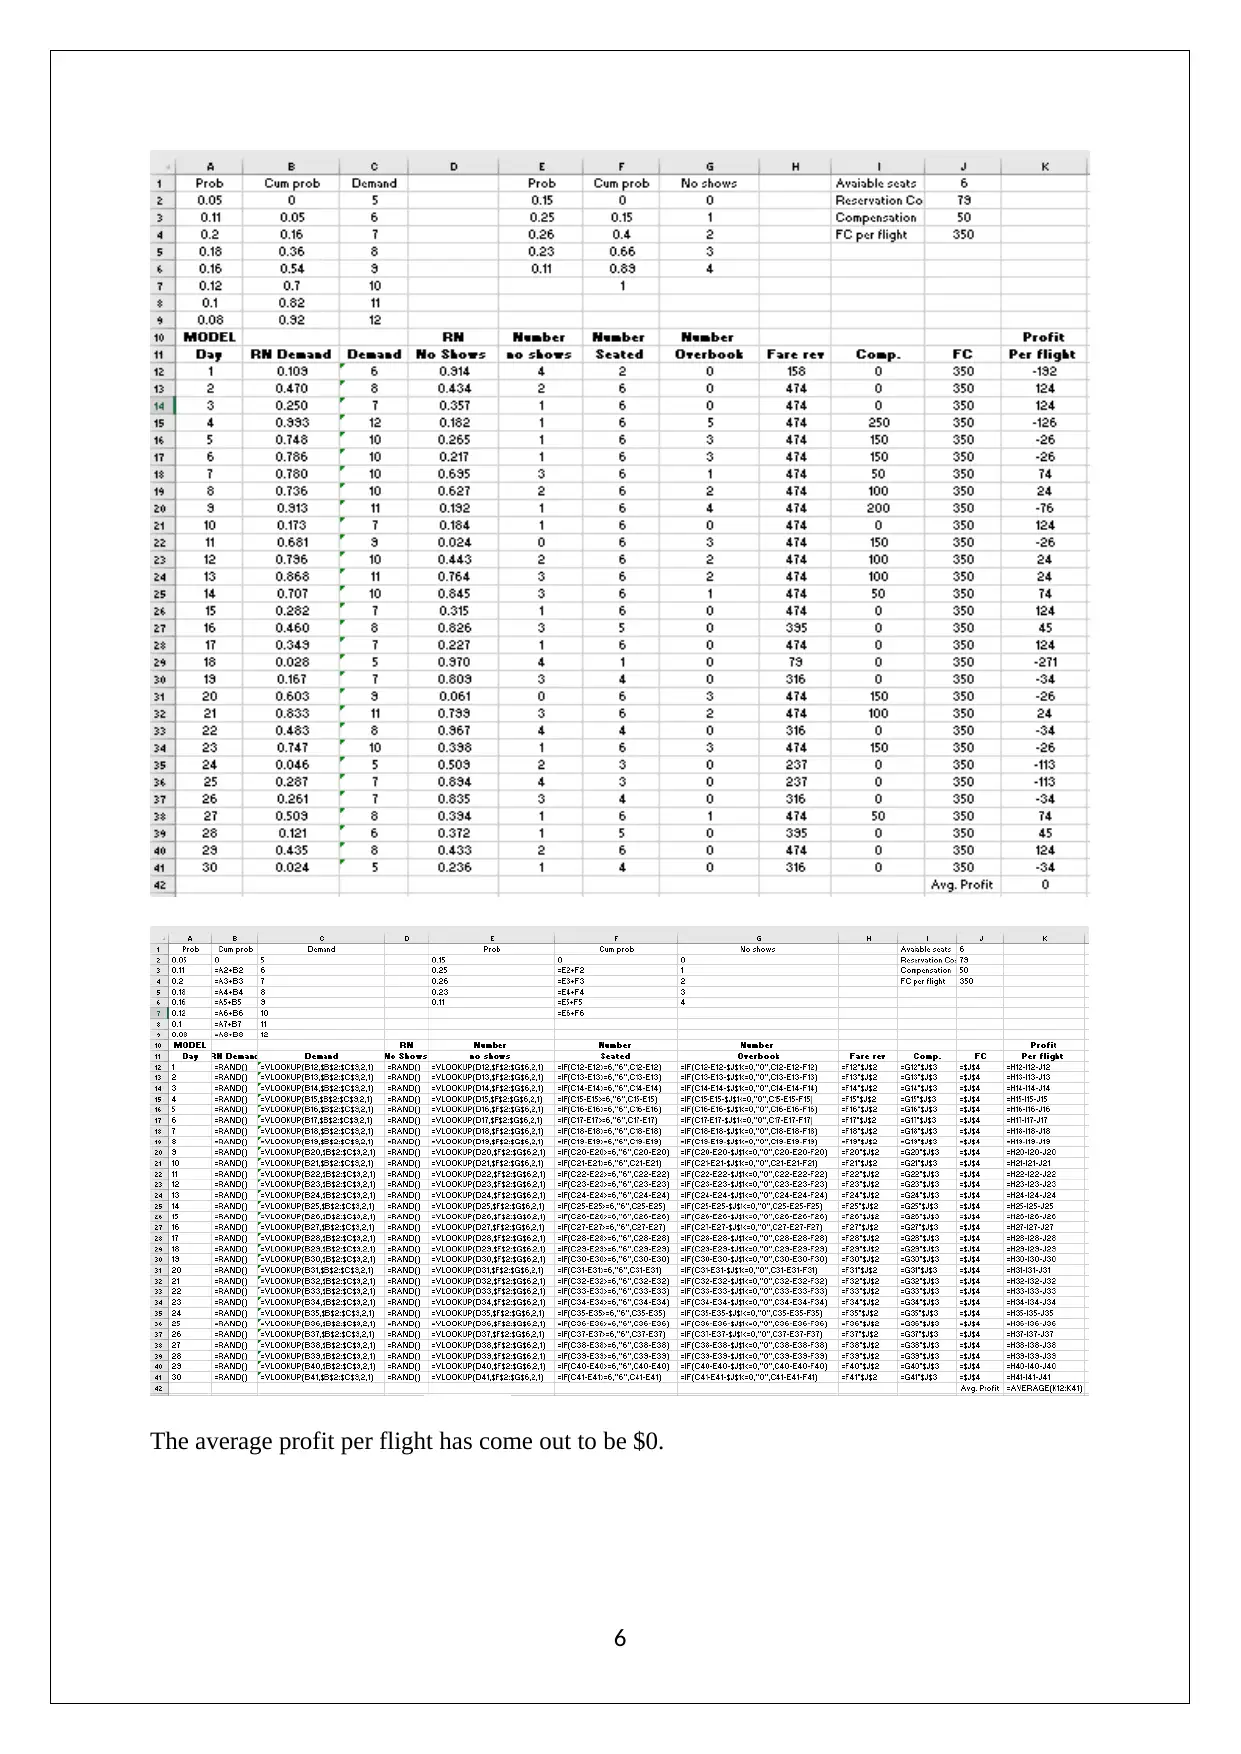
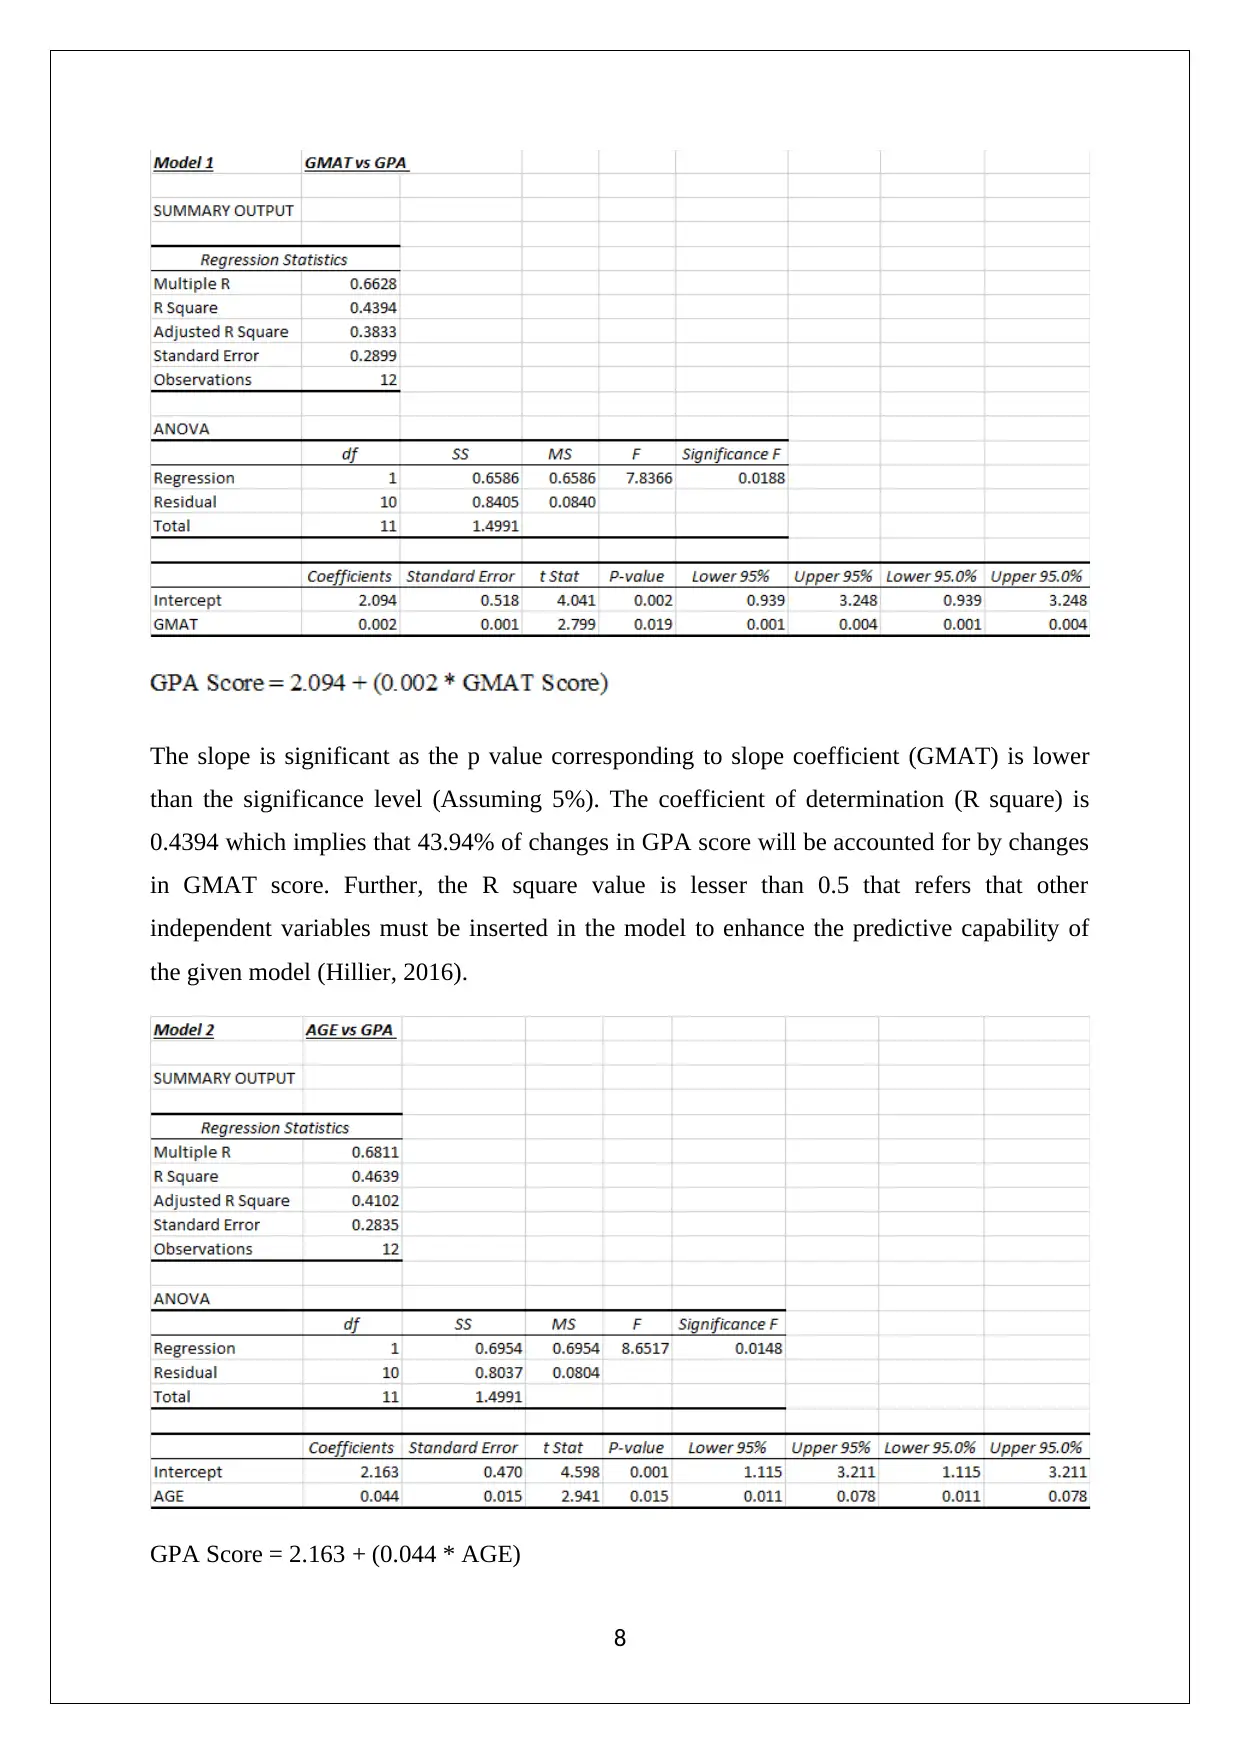
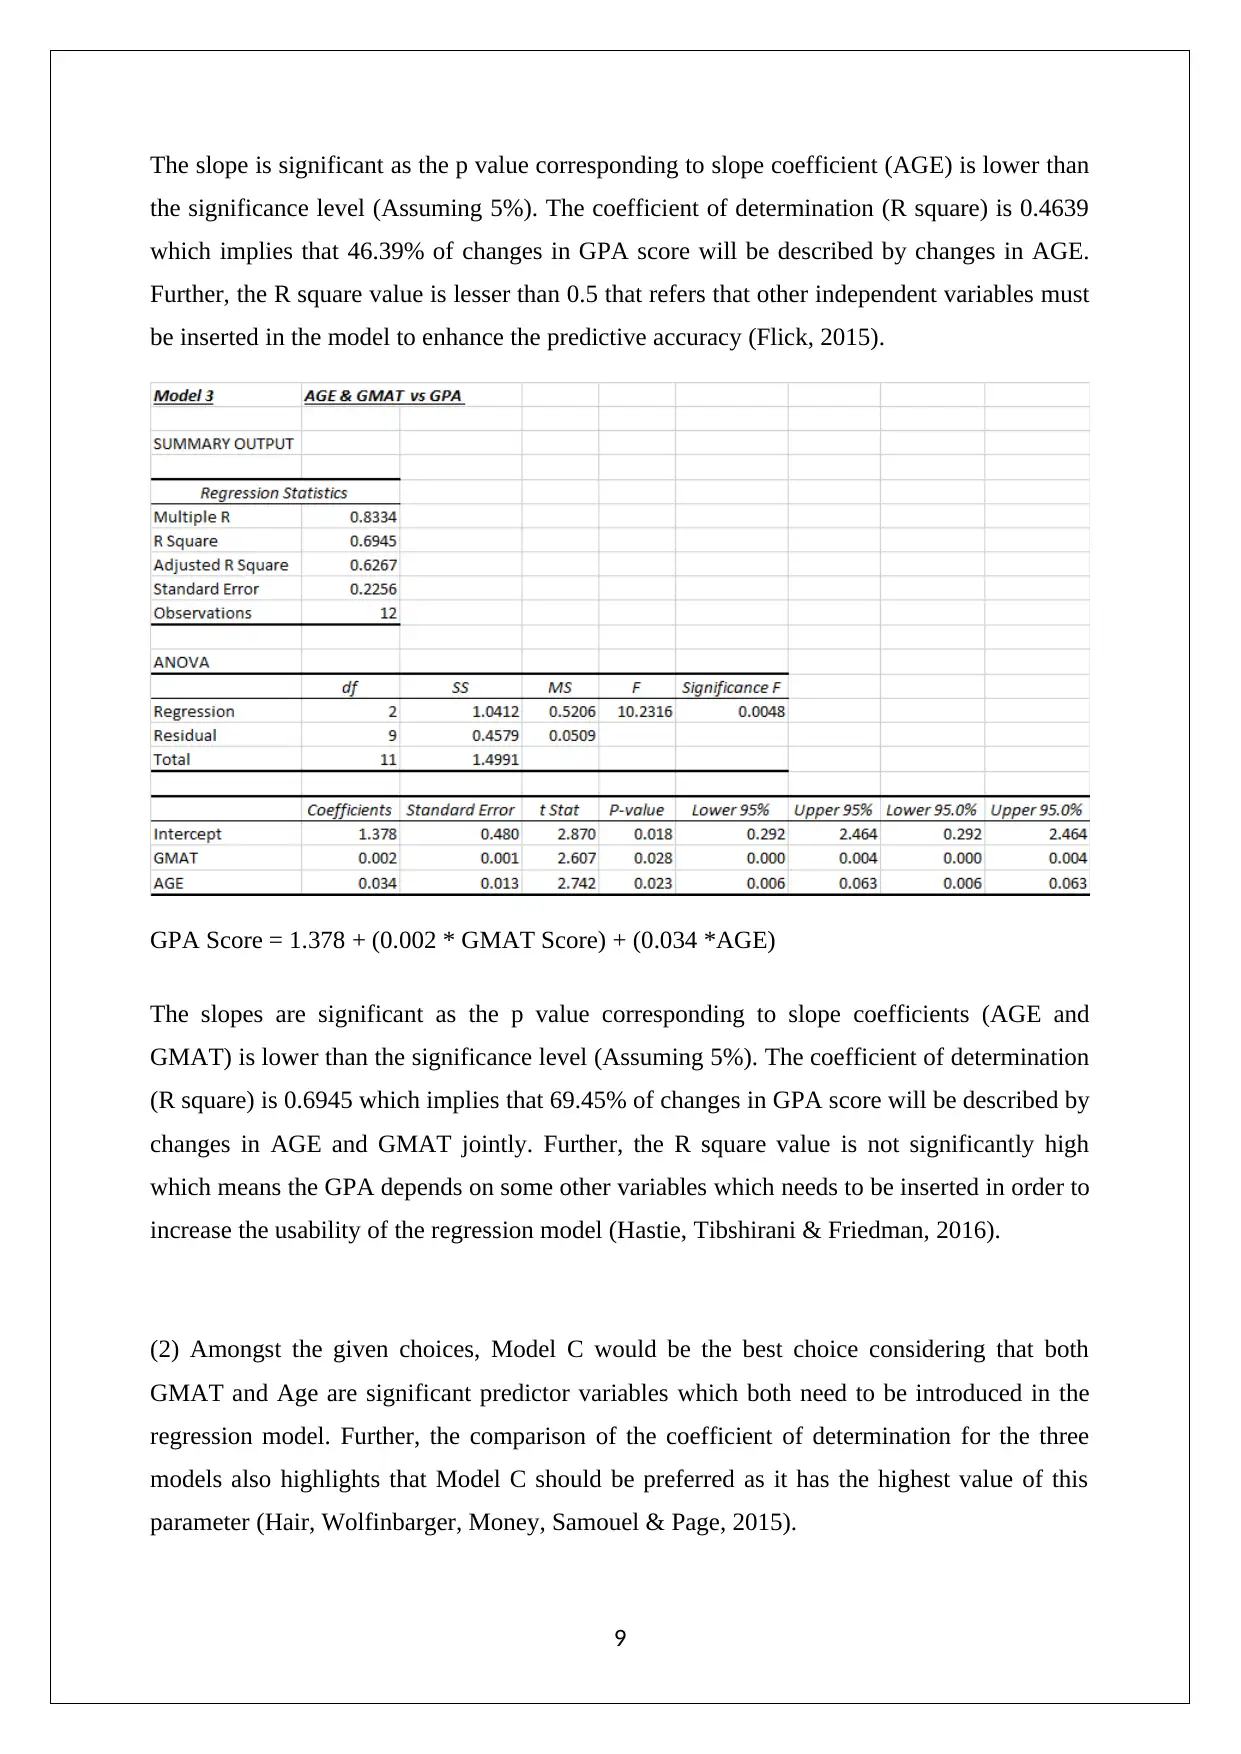
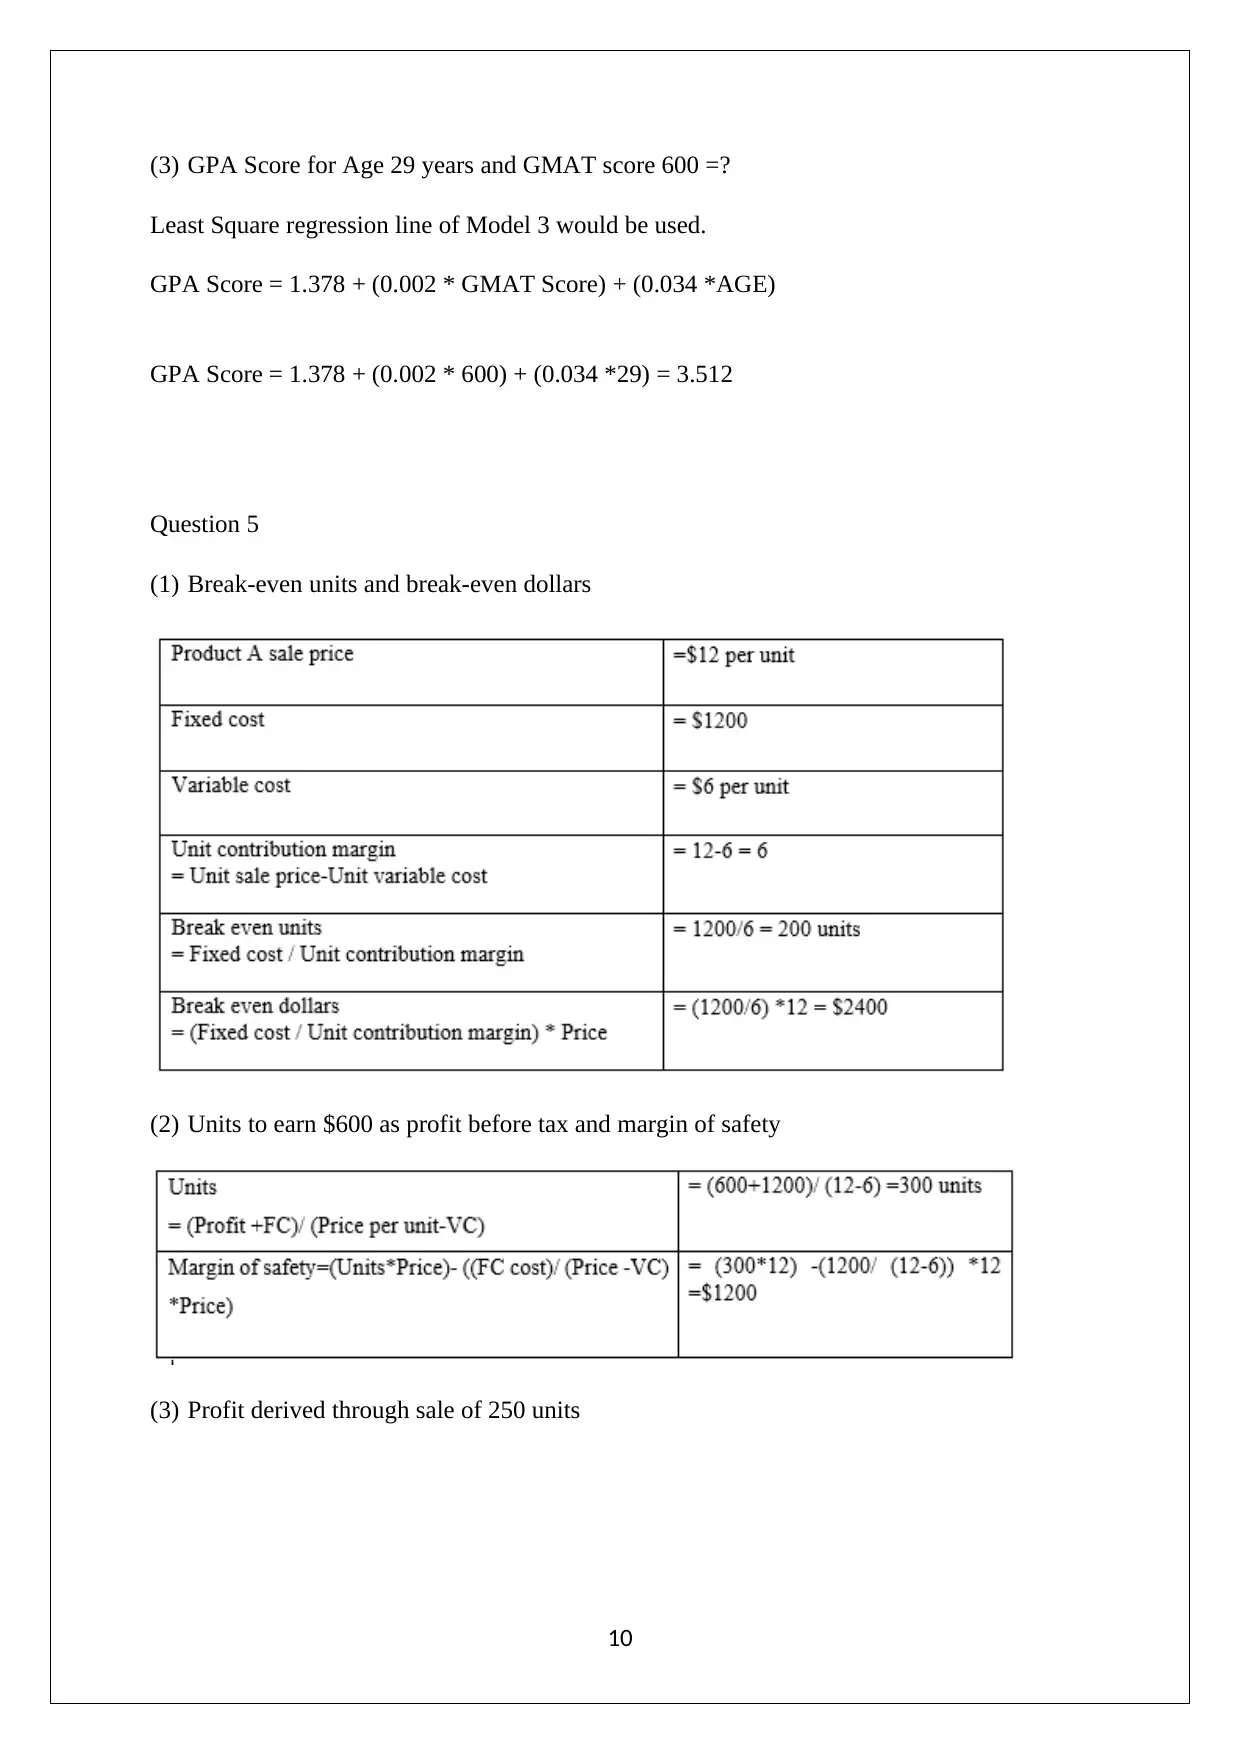
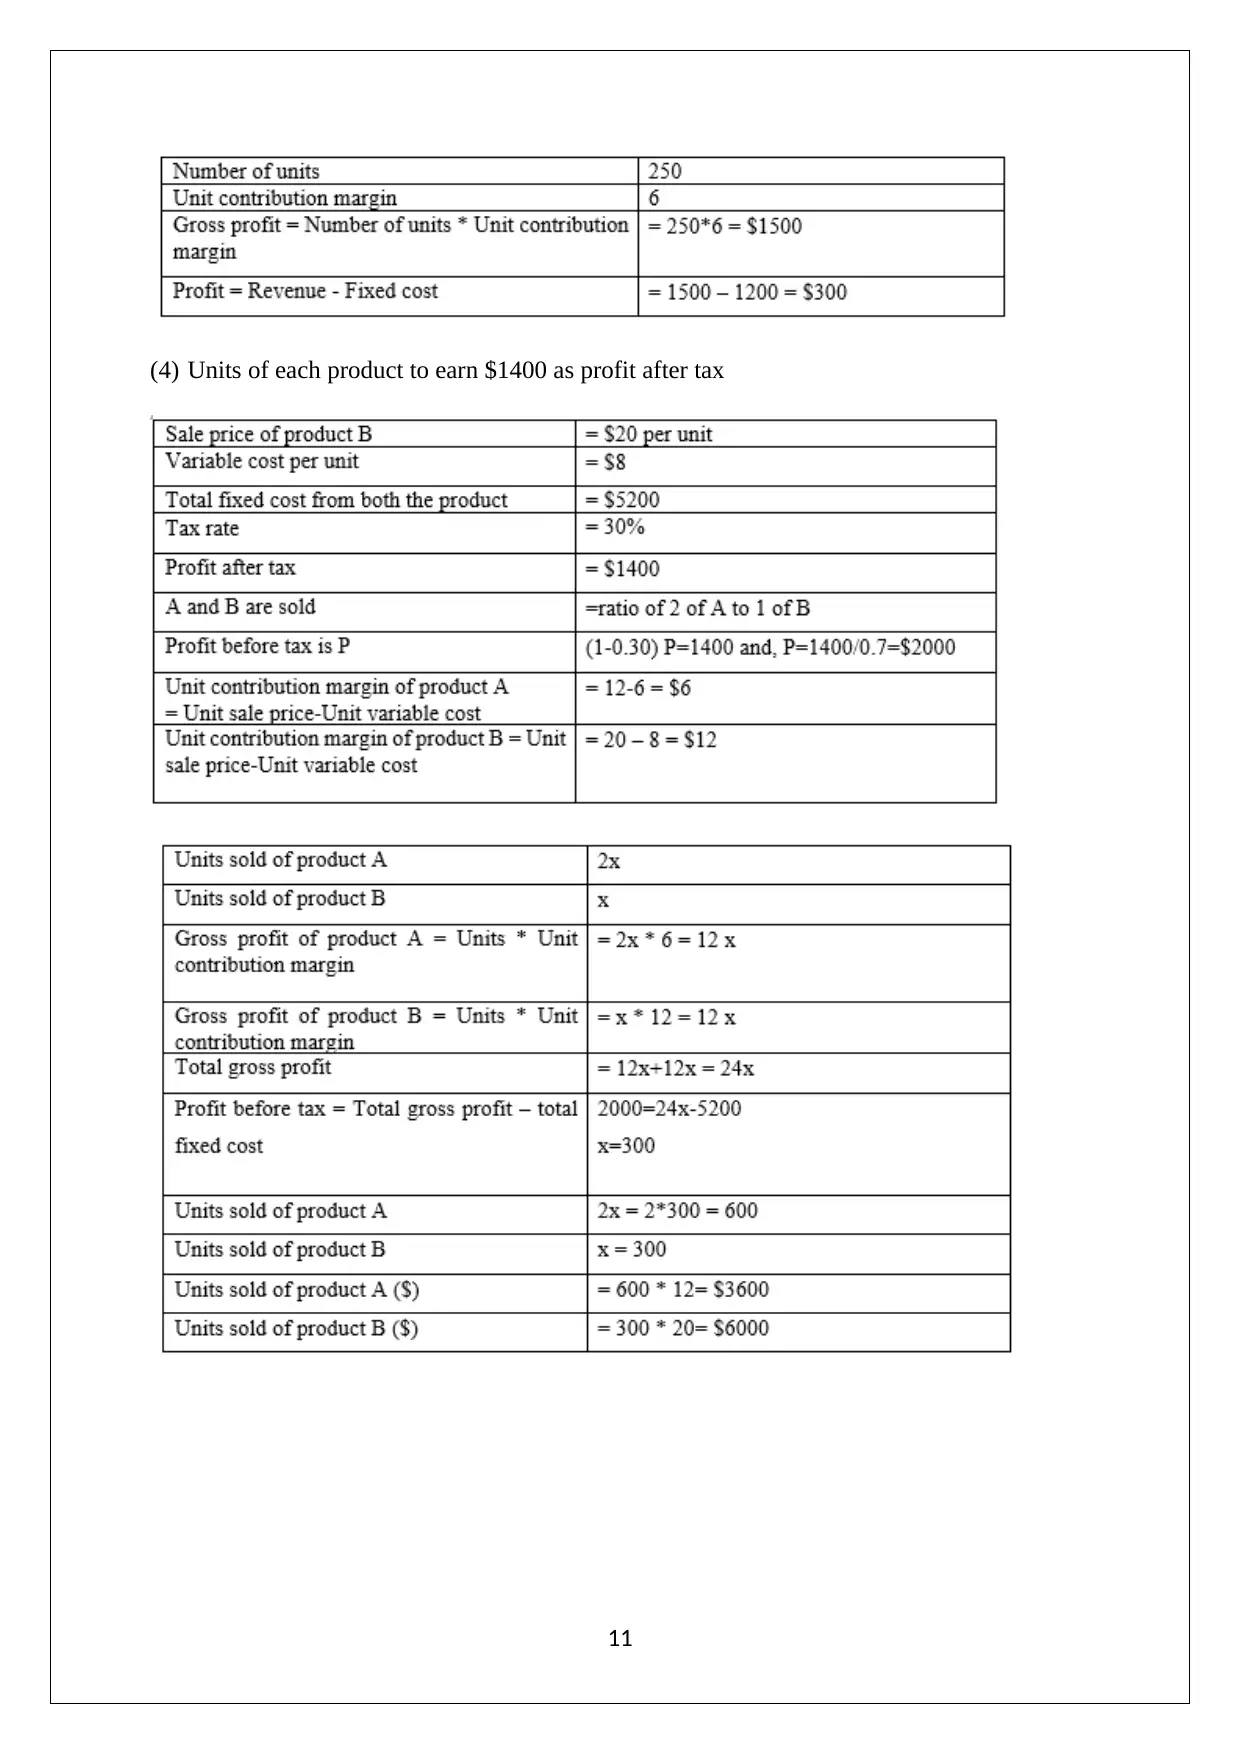
This assignment delves into the realm of decision support tools, exploring various techniques to aid in effective decision-making. It begins with an analysis of payoff matrices, detailing their advantages and the process of their construction. The assignment then contrasts payoff matrices with decision trees, highlighting situations where decision trees offer superior utility. A case study involving the purchase of industrial robots is presented, requiring the application of different decision-making criteria such as optimist, pessimist, Laplace, and regret criteria, as well as the calculation of expected return and the expected value of perfect information. Furthermore, the assignment incorporates a discussion on revised prior probabilities and posterior probabilities, EVSI and ENGSI, and the maximum a firm should pay for a survey. It also involves a simulation model to determine a company's daily profit, along with an analysis of the impact of fare variations and overbooking compensation. Finally, the assignment includes a regression analysis, evaluating the significance of different variables on a GPA score, and a break-even analysis to determine the optimal units and profit levels.

DECISION SUPPORT TOOLS
STUDENT ID:
[Pick the date]
STUDENT ID:
[Pick the date]
Paraphrase This Document
Need a fresh take? Get an instant paraphrase of this document with our AI Paraphraser

Question 1
(a) A key advantage associated with the use of payoff matrix is that the decision maker can
fully understand how changing the decision or choice would impact the payoff which
would enable the decision maker make the best choice after comparing it with other
available choices. In order to form a payoff matrix, it is imperative that all the possible
choices must be listed down along with the underlying probability associated for the
occurrence of each. Finally, the payoff for the different states and choices are multiplied
by the respective probability of obtain the payoff matrix comprising of payoff under
differ scenarios (Fehr & Grossman,2016).
(b) A key difference between payoff matrix and decision tree is that the latter tends to show
the various intermediate decisions and the associated choices with these. The payoff
matrix tend to represent the final outcome associated with a given choice. Hence, in
scenarios where the intermediate decisions are vital or dynamic in nature, the decision
tree as a technique would be more useful than payoff matrix (Eriksson & Kovalainen,
2015).
(c) George has three options: One is to buy ROB1, second is to buy ROB 2, third is not to
buy any robots or say do nothing.
1) Payoff Matrix
2) George: Optimist
Maximum value of the maximum payoff is for Robot 1 and hence, he should buy ROB1.
3) George: Pessimist
2

Maximum value of the minimum value comes out for option third and hence, George should
do nothing.
4) George follows Laplace Criterion
The average comes out to be same for ROB1 and ROB2 and hence, George can buy either of
the robots.
5) George follows Criterion of regret
The optimum action is to buy Robot 2 because it has minimum value of the maximum
opportunity loss.
6) Optimum action and expected return for favourable market probability 0.6
3
⊘ This is a preview!⊘
Do you want full access?
Subscribe today to unlock all pages.

Trusted by 1+ million students worldwide

The optimum action is to buy ROB 1 because it has maximum expected return.
Therefore,optimum action is to purchase Robot 1and expected return is $14,000.
7) Expected value of perfect information
Question 2
(a) Revised prior probabilities
Assumption:
S1 = favourable market, S2 = unfavourable market
Y1 =positive, Y2= negative
Hence, revised prior probabilities (Excel)
(b) Posterior probabilities P (S1 | Y1) = 0.6279 as evident from the computations carried out
above.
4
Paraphrase This Document
Need a fresh take? Get an instant paraphrase of this document with our AI Paraphraser

(c) EVSI and ENGSI
(d) Maximum the firm should pay for survey
Question 3
(1) The simulation model to determine the ABC’s daily profit for 30 days along with the
mean profit per flight is computed in excel and normal and formula view is given below.
5
(d) Maximum the firm should pay for survey
Question 3
(1) The simulation model to determine the ABC’s daily profit for 30 days along with the
mean profit per flight is computed in excel and normal and formula view is given below.
5

The average profit per flight has come out to be $0.
6
6
⊘ This is a preview!⊘
Do you want full access?
Subscribe today to unlock all pages.

Trusted by 1+ million students worldwide

2) In relation to the fare variation, it is noteworthy that if the fare is increased, then the profit
per unit passenger would see a sizable improvement. But, this is assured when the
compensation amount for overbooking does not increase. If there is improvement in the
compensation overbooking and fares, then also if the quantum of increase in overbooking
compensation does not exceed the increase in fares, the profit per passenger would see
improvement only.
3) The Manager
11th May, 2019
Dear Sir
For enhancing the profitability in the context of airline operations, the various input data with
regards to demand, fares, overbooking compensation has been considered and Monte Carlo
simulation is run which leads to the conclusion that the current operations are leading to a
profit of $ 0. To enhance the overall profitability of the business, increasing the passenger
fare is a viable solution. For a sizable boost in profit, it is recommended that the overbooking
compensation should not be increased. The profits may also be increased if the amount
associated with overbooking compensation is decreased. In the context of higher fare for each
passenger, there may be the issue of low occupancy which could possibly hurt profitability.
As a result, the operations would be best served if some dynamic pricing is introduced after
atleast 50% of the seats are booked.
Yours Sincerely
STUDENT NAME
Question 4
Regression Analysis
7
Paraphrase This Document
Need a fresh take? Get an instant paraphrase of this document with our AI Paraphraser

The slope is significant as the p value corresponding to slope coefficient (GMAT) is lower
than the significance level (Assuming 5%). The coefficient of determination (R square) is
0.4394 which implies that 43.94% of changes in GPA score will be accounted for by changes
in GMAT score. Further, the R square value is lesser than 0.5 that refers that other
independent variables must be inserted in the model to enhance the predictive capability of
the given model (Hillier, 2016).
GPA Score = 2.163 + (0.044 * AGE)
8

The slope is significant as the p value corresponding to slope coefficient (AGE) is lower than
the significance level (Assuming 5%). The coefficient of determination (R square) is 0.4639
which implies that 46.39% of changes in GPA score will be described by changes in AGE.
Further, the R square value is lesser than 0.5 that refers that other independent variables must
be inserted in the model to enhance the predictive accuracy (Flick, 2015).
GPA Score = 1.378 + (0.002 * GMAT Score) + (0.034 *AGE)
The slopes are significant as the p value corresponding to slope coefficients (AGE and
GMAT) is lower than the significance level (Assuming 5%). The coefficient of determination
(R square) is 0.6945 which implies that 69.45% of changes in GPA score will be described by
changes in AGE and GMAT jointly. Further, the R square value is not significantly high
which means the GPA depends on some other variables which needs to be inserted in order to
increase the usability of the regression model (Hastie, Tibshirani & Friedman, 2016).
(2) Amongst the given choices, Model C would be the best choice considering that both
GMAT and Age are significant predictor variables which both need to be introduced in the
regression model. Further, the comparison of the coefficient of determination for the three
models also highlights that Model C should be preferred as it has the highest value of this
parameter (Hair, Wolfinbarger, Money, Samouel & Page, 2015).
9
⊘ This is a preview!⊘
Do you want full access?
Subscribe today to unlock all pages.

Trusted by 1+ million students worldwide

(3) GPA Score for Age 29 years and GMAT score 600 =?
Least Square regression line of Model 3 would be used.
GPA Score = 1.378 + (0.002 * GMAT Score) + (0.034 *AGE)
GPA Score = 1.378 + (0.002 * 600) + (0.034 *29) = 3.512
Question 5
(1) Break-even units and break-even dollars
(2) Units to earn $600 as profit before tax and margin of safety
(3) Profit derived through sale of 250 units
10
Paraphrase This Document
Need a fresh take? Get an instant paraphrase of this document with our AI Paraphraser

(4) Units of each product to earn $1400 as profit after tax
11
11

References
Eriksson, P. & Kovalainen, A. (2015). Quantitative methods in business research (3rded.).
London: Sage Publications.
Fehr, F. H., & Grossman, G. (2016).An introduction to sets, probability and hypothesis
testing (3rded.). Ohio: Heath.
Flick, U. (2015). Introducing research methodology: A beginner's guide to doing a research
project (4thed.). New York: Sage Publications.
Hair, J. F., Wolfinbarger, M., Money, A. H., Samouel, P., & Page, M. J. (2015). Essentials of
business research methods (2nded.). New York: Routledge.
Hastie, T., Tibshirani, R. & Friedman, J. (2016). The Elements of Statistical Learning
(4thed.). New York: Springer Publications.
Hillier, F. (2016).Introduction to Operations Research.(6thed.). New York: McGraw Hill
Publications.
12
⊘ This is a preview!⊘
Do you want full access?
Subscribe today to unlock all pages.

Trusted by 1+ million students worldwide
1 out of 12
Related Documents

Your All-in-One AI-Powered Toolkit for Academic Success.
+13062052269
info@desklib.com
Available 24*7 on WhatsApp / Email
Unlock your academic potential
Copyright © 2020–2025 A2Z Services. All Rights Reserved. Developed and managed by ZUCOL.